Research Article
Mechanical Properties and Thermal Conductivity of
Aerogel-Incorporated Alkali-Activated Slag Mortars
Levent Bostanci
1and Ozlem Celik Sola
21School of Advanced Vocational Studies, Beykent University, Istanbul, Turkey
2Department of Civil Engineering, Faculty of Engineering, Istanbul University, Istanbul, Turkey
Correspondence should be addressed to Ozlem Celik Sola; [email protected]
Received 24 March 2018; Revised 8 June 2018; Accepted 25 June 2018; Published 5 August 2018 Academic Editor: Li Li
Copyright © 2018 Levent Bostanci and Ozlem Celik Sola. This is an open access article distributed under the Creative Commons Attribution License, which permits unrestricted use, distribution, and reproduction in any medium, provided the original work is properly cited.
Compressive strength, thermal conductivity coefficient, and porosimetric properties of alkali-activated slag (AAS) mortars con-taining silica aerogel were investigated experimentally in this study. For this purpose, slag mortar mixtures at 0.75% and 1.0% aerogel
content ratios were prepared, and these mortar mixtures were activated with lithium carbonate (Li2CO3) at 0.03% and 1.50% dosage
rates. Mortar samples were exposed to curing process in water for 2, 7, and 28 days, and the samples, which completed the curing stage, were subjected to the compressive strength test. The porosimetry test and the thermal conductivity coefficient measurement were carried out following the compressive strength test on 28-day samples. The varying aerogel content rate in the mixtures and the
effects of the dosage of Li2CO3on the gel, capillary, and macropore distributions, and the effect of changing porosimetric properties
on compressive strength and thermal conductivity coefficient were analyzed in detail. Experimental studies have shown that AAS
mortars including an optimum 0.75% aerogel content rate and 0.03% Li2CO3activation provided a compressive strength of 34.1 MPa
and a thermal conductivity coefficient of 1.32 W/mK. Aerogel addition provides a partial compressive strength increase at 7- and 28-day samples while it also causes maximum strength loss of 5.0% at 2-28-day samples.
1. Introduction
Despite its many useful functional and economical features such as low energy and cost requirements during its production and ensuring an easy production of the structural element in building construction, cement makes a negative contribution to global warming by creating 5–8% of CO2 emissions [1].
Therefore, it is required to use the environment-friendly, easy to recycle materials with low CO2 emissions in material
technology and to improve the environment-friendly prop-erties of existing materials, as such in all sectors [2]. For this purpose, blast furnace slag which can be characterized as a waste-type binder can be replaced by the clinker in the binder matrix by means of its features including high sulfate resistance, high ultimate strengths, and low CO2release in particular [3].
In cement technology, composite binders with reduced clinker ratio have been designed by partial replacement of clinker through supplementary materials such as pozzolan,
granulated blast furnace slag, and limestone for many years. In general, significant losses are observed especially at long-term mechanical strengths at replacement of 50% or more. Thus, alkali-activated alternative binder materials of which mechanical strengths are improved by means of alkali ac-tivators are needed [4].
Alkali-activated slag is a kind of binder which is formed with the chemical reaction of an activator and a slag pre-cursor, especially in countries where slag production is prevalent [5]. Although it has found wide use in recent years, it has not entered the regulations of most countries as a different design material from cement yet [6].
The main hydration products in alkali-activated slag mortars consist of calcium aluminosilicate hydrate gels at low Ca/Si rates, hydrocalcite, and other mineral phases [7]. The anion type of the selected alkali activator is vital in the development of mechanical strengths and the setting time, especially when the pH value exceeds 12 [8]. Both initial and
Volume 2018, Article ID 4156248, 9 pages https://doi.org/10.1155/2018/4156248
final setting times are shortened with the increase in acti-vator dosage [9].
In alkali-activated slag mortars, with increasing activator dosages, higher compressive strengths are observed in ad-dition to shortening setting times. The amount of re-placement by weight within the binder material is also vital on the compressive strengths of the waste-activated mortars. Najimi et al. activated the 30%, 50%, and 70% slag-incorporated binder using sodium hydroxide (NaOH) and sodium silicate solutions in their experimental study. In 28-day compressive strength tests, the strength was found to be varying from 20.9 to 43.2 MPa [10].
Aiming to obtain cement-like strengths in slag mortars, different porosimetric parameters are determined compared to cement mortars. Alkali-activated slag mortars have a different pore structure than conventional cement mortars. The total porosity value of the Na2SiO3-activated slag mortar
at the third day might be lower than the total porosity value of the conventional cement mortar at the ninetieth day [11]. Pore volume of micropores increases and capillary pores decreases with the increment of slag content in alkali-activated slag mortars compared to conventional cement mortars [12]. In experimental studies of Shi et al., the pore diameters above 100 nm represent 11.45% of total pore volume in cement mortars, while the proportion is only 3.92% of total pore volume in alkali-activated slag mortars [13].
Experimental studies with ecological purposes for re-ducing the requirement for conventional cement are not conducted only due to the high CO2 release of the cement
but also for the conservation of energy by lowering the high thermal conductivity coefficient detected in the cement mortars. In order to carry out this task, the coefficient of thermal conductivity can be reduced in mortars by means of forming a suitable pore structure in cement matrix with additive materials having the low thermal conductivity coefficients. Pore structure designs could be made up to the level of “foam concrete” depending on thermal conductivity-compressive strength optimization [14].
Polyurethane foam, phenolic foam, mineral wool, polystyrene, fiberglass, rock wool polystyrene, cork, and so on are used as heat insulation materials in current material technology. In addition to these materials, silica aerogels firstly synthesized by Kistler in 1931 have been used as additive materials in experimental studies for insulation purposes in concrete technology in recent years. Consid-ering the thermal conductivity coefficients of other insu-lation materials are in the range of 0.018–0.048 W/mK, the silica aerogels have extremely superior thermal insulation ability for a solid material with very low thermal conduc-tivity coefficients (0.0034–0.022 W/mK) [15–17]. The lightness and low-volume structure of the aerogels make silica aerogels attractive compared to all other fibrous and foam-based insulation materials besides their high durability properties [18].
In previous studies, it was stated that aerogel particles are stable during the hydration of cementitious materials and aerogel particles are not degraded by the process of hy-dration. However, the mortar compressive strength and
thermal conductivity coefficient decrease in proportion to the increase of aerogel content [19].
In this study, unlike previous experimental studies, aerogel contribution was made to alkali-activated slag (AAS) mortar instead of conventional cement mortar, and it was added at the rates of 0.75% and 1.0%. Alkali activation was performed by activation of slag mortar with lithium car-bonate (Li2CO3) in order to minimize the probable
com-pressive strength losses that could be caused by the lower activation ability of the slag material representing the half of the composite binder material compared to the clinker.
2. Materials and Methods
2.1. Materials
2.1.1. Binder. Composite binder material, which consists of CEM I type 42.5 R Portland cement and granulated blast furnace slag with 50% by weight for each, was preferred in the mortar mixture produced within the scope of experi-mental studies. Granulated blast furnace slag and Portland cement are supplied by Bolu Cement Co.
2.1.2. Sand. Standard Rilem sand, which is packed and supplied from Bolu Cement Co., was used in mortar mixtures. The density of sand used in the experiments was determined as 1.352 kg/dm3, and the specific gravity was 2.563.
2.1.3. Aerogel. Silica-based hydrophilic aerogels are used to increase thermal insulation in mortar mixtures. Silica aerogel was produced by Ensate Yalıtım M¨uhendislik Proje San. Tic ve Ltd. S¸ti and supplied from the same company. The physical properties of the hydrophilic aerogel are given in Table 1.
2.1.4. Lithium Carbonate. Lithium carbonate (Li2CO3),
which is rarely used in previous experimental studies, was preferred as the alkali activator in mortar mixtures. This activator was obtained from Sorel Sanayi ¨Ur¨unleri Tic.
Table 1: The physical properties of the aerogel used in the experiments.
Surface area (m2/gr) 790–840
Pore diameter (nm) 8–10
Porosity (%) >94%
Apparent density (kg/m3) 90–100
Surface group −OH
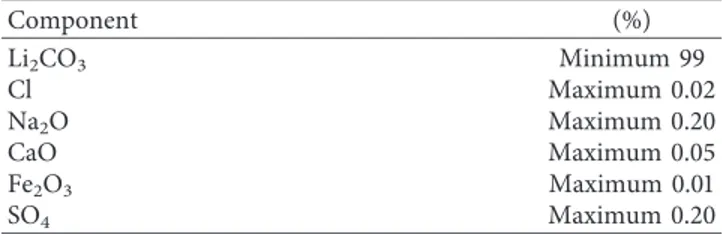
Table 2: Chemical composition of Li2CO3.
Component (%) Li2CO3 Minimum 99 Cl Maximum 0.02 Na2O Maximum 0.20 CaO Maximum 0.05 Fe2O3 Maximum 0.01 SO4 Maximum 0.20
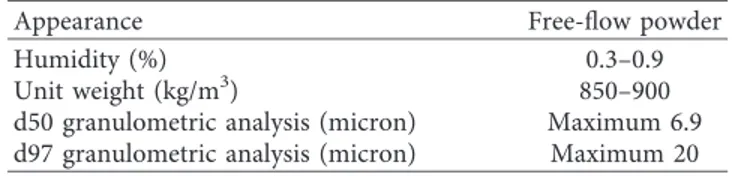
Ltd. Sti. In Tables 2 and 3, the chemical and physical properties of Li2CO3are presented.
2.2. Mix Proportions. In the experimental studies, four mixtures of mortars were prepared for the production of alkali-activated slag mortars. Standard Rilem sand and composite binder, which consist of cement and granulated blast furnace slag, were used in all mortar mixtures. The thermal insulation target in the mortar samples was tried to be provided by the silica-based hydrophilic aerogel content at 0.75% and 1.00% rates. Slag mortars were activated with Li2CO3 in order to increase binding activity of the
granu-lated blast furnace slag, which is about 50% of the binder material. Li2CO3was used in mortar mixtures at the rates of
0.03% and 1.50% by weight. In mortar mixtures, 50% of the binder material used in the mortar mixtures is composed of cement while the remaining 50% of the material is designed as the sum of slag, aerogel, and Li2CO3. Furthermore, the
proportion of water/binder material was adjusted as 0.50 in all mixtures. Mixture ratios of the alkali-activated slag mortars are given in Table 4.
2.3. Curing Conditions and Testing. In the scope of the ex-perimental studies, three prismatic mortar samples with dimensions of 40 × 40 × 160 mm were produced for each of 4 different mixtures designed at different aerogel content rates and Li2CO3 dosages, and the samples were subjected to
curing process in water during 2, 7, and 28 days. The samples which completed the curing session were subjected to compressive strength test through ToniTechnik brand and ToniNORM/Toni TROL model device. Mercury intrusion porosimetry and thermal conductivity coefficient mea-surements were carried out on the parts of the 28-day specimens, which were subjected to compressive strength, after the strength test performed in consistent with TS EN 196-1 standards that define cement strength tests.
Mercury intrusion porosimetry experiments were implemented using a Micromeritics device. Porosimetric properties of the mortar samples were determined by means of the device, and the results of strength and thermal conductivity coefficient were examined by porosimetric parameters.
Thermal conductivity coefficient measurements were carried out using a C–Therm/Tci thermal conductivity de-vice. According to the device specifications, the thermal conductivity coefficient measurement can be carried out on specimen parts subjected to compressive strength without special sample preparation for conductivity determination. Thermal conductivity coefficient measurements were re-peated five times for each specimen.
3. Results and Discussion
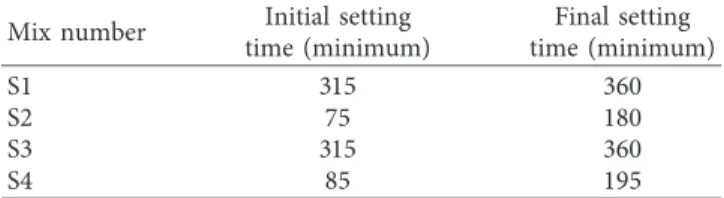
3.1. Setting Time Results. The setting time results of the aerogel-incorporated AAS mortars are shown in Table 5. The varying activator dosage and aerogel content are highly effective both in the initial and final setting times.
S2 and S4 specimens have the earliest initial setting times of 75 and 85 minutes and final setting times of 180 and 195 minutes, respectively. Since these samples are the highest Li2CO3-dosed (1.50%) samples in experimental studies, the
hydration progresses rapidly due to the effect of high ac-tivator dosage. Quite long initial setting times of the samples in S1 and S3 are related to the minimum Li2CO3 dosage
(0.03%) in the samples.
The minor difference between the initial and final setting times of the S2 and S4 samples which have equal activator dosages occurs as a result of the difference in aerogel content rates. The S4 sample that has 1.0% aerogel content has slightly later initial and final setting times than the sample S2 with 0.75% aerogel ratio.
3.2. Compressive Strength Results. In Table 6, the com-pressive strength test results of aerogel-incorporated AAS mortars on days 2, 7, and 28 were presented. The com-pressive strengths of 2 days in mortar specimens with dif-ferent aerogel content ratios and activator dosages are in the range of 12.1–14.5 MPa, while the compressive strengths of 7 and 28 days are varying within the ranges of 19.1–23.8 MPa and 34.1–36.9 MPa, respectively.
The S2 sample (14.5 MPa) with the highest compressive strength among the compressive strength results of the 2-day samples, includes 0.75% aerogel content and 1.50% Li2CO3
activator dosage. The S3 sample at which the minimum compressive strength (12.1 MPa) is obtained includes 1.0% aerogel additive and 0.03% activator dosage. The difference of 19.8% determined between 2-day compressive strength results on the S2 sample compared to the S3 sample occurs due to the Li2CO3effect which is increasing from 0.03% to
1.50% in the mortar mixtures. Similarly, compressive strength differences of 14.1% between S1 and S2 (0.75%) samples and 15.7% between S3 and S4 (1.0%) samples with equal aerogel content is an indicator of the positive effect of increasing Li2CO3 dosage on the compressive strengths.
Evaluating the compressive strength for the equal Li2CO3
dosages, the determined compressive strength losses of 4.9% and 3.5% between the samples S1–S3 and S2–S4, re-spectively, are related to increasing aerogel content rate in the mortar mixtures.
The S4 sample (23.8 MPa), with the highest compressive strength among the compressive strength test results of the 7-day samples, includes 1.0% aerogel content and 1.50% Li2CO3 activator dosage. The second sample, in which the
second highest compressive strength is determined, also contains a 1.50% Li2CO3 dosage. S1 and S3 samples, in
which the lowest compressive strengths are obtained, in-clude 0.03% Li2CO3dosages. For 7-day compressive strength
test results, compressive strength difference between sam-ples which have the maximum and minimum strengths is
Table 3: Physical composition of Li2CO3.
Appearance Free-flow powder
Humidity (%) 0.3–0.9
Unit weight (kg/m3) 850–900
d50 granulometric analysis (micron) Maximum 6.9
24.6%. The strength increments of 0.1 and 0.9 MPa were determined between the compressive strength of S1–S3 and S2–S4 samples, which have equal Li2CO3 dosages, with
increasing aerogel contribution.
The compressive strength test results of the 28-day samples are very similar to those of the 7-day samples. S4 and S2 samples, which have the highest Li2CO3 dosages,
provide maximum strength values among the compressive strength results of the 28-day samples. A 0.8% difference between the compressive strength results of these two samples with the highest strength values is observed. This difference obtained in the equivalent activator dosage is important in terms of determining higher strength in the sample including higher aerogel content rate as in the 7-day compressive strength results. The positive effect of the ac-tivator dosage on the compressive strength is also evident in the results of the 28-day samples since the sample with the activator dosage of 0.03% has the lowest value with the value of S1 of 34.1 MPa. The strength increases of 1.4 and 0.3 MPa were determined between the compressive strength of S1–S3 and S2–S4 samples with equal Li2CO3 dosages, with
in-cremental aerogel contribution.
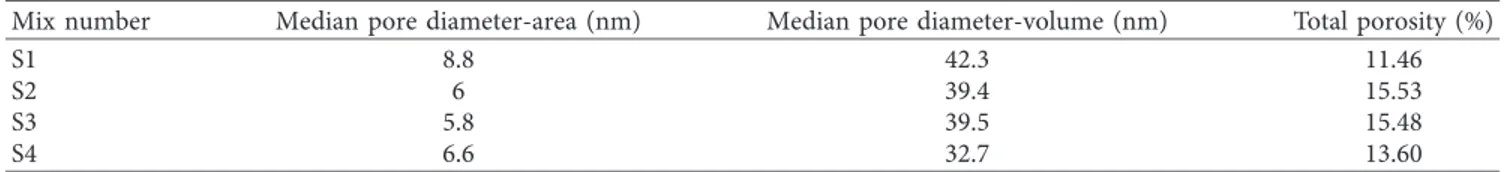
3.3. MIP Test Results. The MIP test results of aerogel-incorporated AAS mortars determined at the end of 28-day curing time are presented in Table 7. The total porosity values in mortar specimens with different aerogel content ratios and activator dosages are varying in the range of 11.46–15.53%. Considering test results, median pore diameter-area values were found to change from 5.8 to 8.8 nm, and median pore diameter-volume values were observed to vary from 32.7 to 42.3 nm.
The effect of the porosity parameters (median pore diameter-volume, median pore diameter-area, and total porosity) given in Table 7 on pore size distribution of mortar samples is presented in Figure 1. In the S2 sample, in which maximum total porosity of 15.53% was detected, there are maximum porosities in the diameter ranges of 10,000– 100,000 and above 100,000 nm (5.63% and 7.07%, resp.) unlike other samples. The total porosity value can reach to
15.48% in the S3 sample by means of the porosity distri-bution determined in the same diameter ranges (5.36% and 4.98%, resp.). The total porosity values of S1 and S4 are lower than those of S2 and S3 since there is no porosity in the diameter ranges of 10,000–100,000 and above 100,000 nm. The total porosity value of the S4 sample (13.60%) is higher than that of the S1 sample (11.46%) due to the higher po-rosity of the sample S4 in the range of 1,000–10,000 nm compared to that of the sample S1.
Figure 2 shows the relationship between median pore diameter-area and total porosity values in the mortar samples. The total porosity value tends to decrease due to increasing median pore diameter-area in the mortar sam-ples. As a result of the porosimetry analysis, the highest and lowest diameters were determined on the S1 sample (8.8 nm) and on the S3 sample (5.8 nm), respectively. The minimum total porosity value (11.46%) was determined by means of the maximum diameter of the S1 sample. In S3, a very high total porosity (15.48%) was determined despite the lowest diameter. Samples S1 and S3, where the lowest and highest diameters are determined, are also the lowest Li2CO3
-dos-aged samples. In the equal Li2CO3 dosages, the aerogel
content rate varying by 0.25% is quite effective on median pore diameters.
In Figure 3, the relationship between median pore diameter-area and median pore diameter-volume in mortar samples is shown. In the samples with 0.03% activator dosage, higher median pore diameter-volume values were obtained compared to the ones with 1.50% activator dosage despite the varying aerogel content ratio. The highest median pore diameter-volume is observed at S1 which has also the highest median pore diameter-area. Examining the com-pressive strengths obtained after 28-day curing time, pore diameter forming at maximum level results in obtaining the minimum compressive strengths in the S1 sample, even though the sample provides maximum the median pore diameter-area and the median pore diameter-the volume values compared to the other samples.
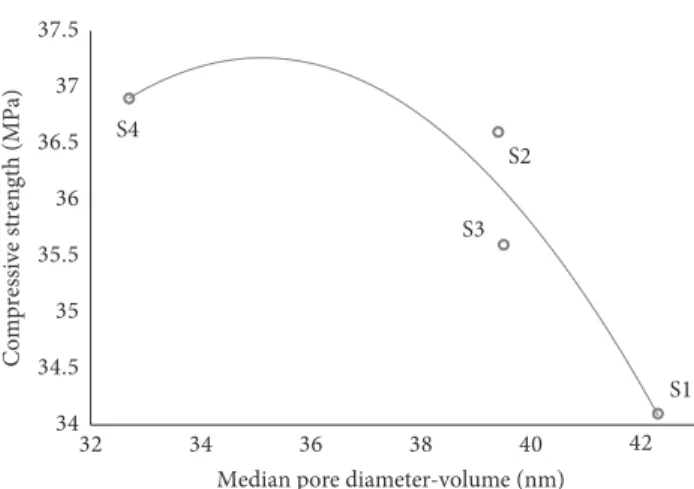
Figure 4 shows the relationship between the median pore diameter-volume and 28-day compressive strengths in the mortar samples. Diameter values for aerogel content rates of
Table 5: Setting time test results of the aerogel-incorporated AAS mortar samples.
Mix number Initial setting
time (minimum) Final setting time (minimum) S1 315 360 S2 75 180 S3 315 360 S4 85 195
Table 6: Compressive strength test results of the aerogel-in-corporated AAS mortar samples.
Compressive strength (MPa)
Mix 2 days 7 days 28 days
S1 12.7 19.1 34.1
S2 14.5 22.9 36.6
S3 12.1 19.2 35.6
S4 14 23.8 36.9
Table 4: Mixture ratios of the aerogel-incorporated AAS mortar samples.
Mix Aerogel (wt.%) Li2CO3(wt.%) Slag (wt.%) Cement (wt.%) Water/cement Water (ml) Sand (g)
S1 0.75 0.03 49.22 50
0.50 225 1350
S2 0.75 1.5 47.75 50
S3 1 0.03 48.97 50
0.75 and 1.0% are at a minimum of 32 nm. The compressive strengths of the samples decrease without any exception depending on the increasing median pore diameter-volume values. Similar compressive strengths of 35.5–36.6 MPa were found in samples S2 and S3 which have also nearly the same median pore diameter-volume values of 39.4–39.5 nm. For the samples S1 and S4, the diameter difference of 9.6 nm
determined at the median pore diameter-volume value allow an increase of 8.2% in compressive strength of the S4 sample. As a result of the increase in hydration products formed by the activator dosing which increases in equal aerogel content, the median pore diameter-volume is decreasing. The reduction of median pore diameters-volume is caused
Table 7: MIP test results of aerogel-incorporated AAS mortars.
Mix number Median pore diameter-area (nm) Median pore diameter-volume (nm) Total porosity (%)
S1 8.8 42.3 11.46 S2 6 39.4 15.53 S3 5.8 39.5 15.48 S4 6.6 32.7 13.60 17.86 62.6 14.68 4.86 0 0 18.03 57.4 7.73 4.14 5.63 7.07 21.55 53.96 10.37 3.78 4.98 5.36 21.87 71.55 2.73 3.85 0 0 <10 10–100 100–1000 1000–10000 10000–100000 >100000 S1 S2 S3S4
Figure 1: Content of pores in mortars.
S1 S2 S3 S4 10 11 12 13 14 15 16 17 5.5 6 6.5 7 7.5 8 8.5 9 Total porosity (%)
Median pore diameter-area (nm)
Figure 2: Relation between median pore diameter-area and total porosity. S1 S2 S3 S4 25 27 29 31 33 35 37 39 41 43 45 5 5.5 6 6.5 7 7.5 8 8.5 9
Median pore diameter-volume (nm)
Median pore diameter-area (nm)
Figure 3: Relation between median pore diameter-area and me-dian pore diameter-volume.
by the placement of the formed hydration products in the pores. Median pore diameter-volume is also reduced with the use of aerogel at a constant activator dosage. This re-duction is not due to the hydration products, however, it is because of the decrease observed in diameters by the effect of increasing aerogel content. As a natural consequence of this, the median pore diameter-volume decreases and therefore the compressive strengths increase.
By evaluating pore size distributions in mortar samples, it is seen that, in Figure 5, the samples tend to behave differently depending on their total porosity values. S4 and S1 samples, which have total porosity values of 13.5% and 11.4%, exhibit a pore diameter distribution behavior that is independent of each other and S2-S3 samples, while S2-S3 samples with the total porosity value of 15.5% show similar behavior.
S2 and S3 samples exhibit similar behavior across all diameters along the graph. Unlike the other samples, pore diameters of 90,000 nm and above were found in these samples. In other samples, however, pore diameter greater than the value of about 7,000 nm was not measured. S2 and S3 samples are the ones exhibiting the highest cumulative pore volume behavior throughout all micro- and capillary pore diameter ranges. Similar cumulative pore volume-pore size distribution behavior of samples S2 and S3 is reflected in all mechanical and porosimetric parameters. The median pore diameter-volume values (39.4 and 39.5 nm), median pore diameter-area values (6.0 and 5.8 nm), total porosity values (15.53 and 15.48%), and compressive strengths (35.6 and 36.6 MPa) of the samples are quite similar.
The maximum pore diameter determined in the S4 sample is 6,670 nm. Throughout the graph, its porosimetric behavior almost coincides with the S1 sample in diameters of 1,000 nm and above, while it exhibits a lower cumulative pore volume behavior than the sample group of S2-S3. This porosimetric diameter distribution difference throughout the diameter range of 3 to 1,000 nm is reflected in the porosimetric parameters of the S4 and S1 samples.
Although the S1 sample behaves quite differently than the S2-S3 samples, it tends to exhibit a characteristic closer to the S4 sample since the highest pore diameter is detected
about 5,080 nm. The lowest total porosity (11.46%) and the highest median pore diameter-volume (42.2 nm) values were found due to the fact that it has the lowest cumulative pore volume value among all samples and exhibits its porosi-metric properties at a limited diameter range.
Figure 6 shows the relationship between total porosity and 28-day compressive strengths in the mortar samples. Regarding previous experimental studies, it is known that aerogel content does not affect the hydration level of binding material. By means of increasing activator dosage ability of increasing the number of C-S-H bonds in the cement matrix in constant aerogel content, higher compressive strengths could be determined in sample S2 than S1 and, similarly, in S4 than S3. Adhesion between the matrix of binder material and the brittle aerogel particles during hydration is highly influenced by the activator dosage. The increased activator dosage in the low aerogel content rates (S1 and S2) increases S1 S2 S3 S4 34 34.5 35 35.5 36 36.5 37 37.5 32 34 36 38 40 42
Compressive strength (MPa)
Median pore diameter-volume (nm)
Figure 4: Relation between median pore diameter-volume and compressive strength. 0 0.01 0.02 0.03 0.04 0.05 0.06 0.07 0.08 0.09 0.1 1.0 0 10 .00 10 0.00 10 00.0 0 10 000 .00 10 000 0 .00 10 000 00.0 0
Cumulative pore volume (ml/g)
Pore diameter (nm) S1
S2
S3 S4
Figure 5: Pore size distributions.
S1 S2 S3 S4 33.5 34 34.5 35 35.5 36 36.5 37 37.5 11 12 13 14 15 16
Compressive strength (MPa)
Total porosity (%)
Figure 6: Relation between compressive strength and total porosity.
the total porosity of the mortar by increasing the volume of the transitive zone formed between the aerogel particles and the binder matrix. At high aerogel content rates (S3 and S4), this effect created by increasing activator dosage is reduced and the influence on the total porosity of the mortar is reversed. This situation is clearly observed in Figure 1 for diameter distributions of 100,000 nm and above. For this reason, the effect of increasing activator dosage ability of increasing the number of C-S-H bonds in cement matrix is more effective than the change in total porosity on com-pressive strengths.
3.4. Thermal Conductivity Test Results. The thermal con-ductivity coefficient results of alkali-activated slag mortars are presented in Table 8. In the experimental studies, the thermal conductivity coefficient results were found in the range of 1.32–1.58 W/mK.
The lowest thermal conductivity coefficient was 1.32 W/mK at S1 sample with 0.75% aerogel content and 0.03% Li2CO3 activator dosage. In this sample, the lowest
conductivity coefficient was found due to the effect of the highest median pore diameter-volume value (42.2 nm) and the highest median pore diameter-area value (8.8 nm) dif-ferently from the other samples. Increasing aerogel content rate decreased median pore diameter-volume values (395 and 32.7 nm) in the S3 (1.46 W/mK) and S4 (1.58 W/mK) samples, respectively, and lead to higher thermal conduc-tivity coefficients (at rates of 10.6% and 19.6%, resp.) in comparison with that in the S1 sample.
Although the S2 sample (1.45 W/mK) has the same aerogel content as the S1 sample, the pore structure of the sample is similar to the S3 sample since the median pore diameter-volume value (39.4 nm) and median pore diameter-area value (6.0 nm) are developed due to the high Li2CO3 dosage. Therefore, almost the same conductivity
coefficient as the S2 sample could be found at the sample S3. Figure 7 shows the relationship between the median pore diameter-area values and the thermal conductivity coefficient in the mortar samples. The thermal conductivity coefficient increases with the increment of pore diameter up to the value around 6.5 nm; however, the coefficient decreases with the increase in the diameter up to higher values. The thermal conductivity coefficients were 1.45–1.46 W/mK for samples with 5.8–6.0 nm pore diameter and 1.58 W/mK for samples with 6.6 nm pore diameter. The thermal conductivity co-efficient has decreased to the minimum value when the me-dian pore diameter-area value reached 8.8 nm for S1 sample. Since the median pore diameter-area values of samples S2 and S3 are very close to each other, the thermal
conductivity coefficients are also very approximate to each other (1.45 and 1.46 W/mK). It is expected that the median pore diameter-area of S1 (8.8 nm) is larger than those of S2 and S3, and the thermal conductivity coefficient is also lower. S4 has a higher thermal conductivity coefficient, even though it has a higher median pore diameter-area than S2 and S3. The case is an unexpected issue. The evaluations made considering experimental findings, however, have shown that median pore diameter-volume gives better results than those with median pore diameter-area measurements. This is an important and promising result for MIP evaluations.
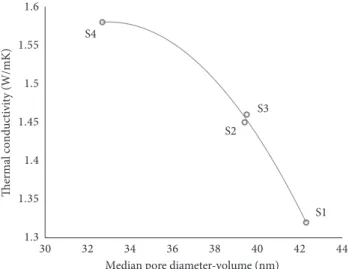
Figure 8 shows the relationship between the median pore diameter-volume values and the thermal conductivity co-efficient in the mortar samples. The thermal conductivity coefficient tends to decrease depending on the increasing pore diameter value. In the samples with the similar pore diameter value of 39.4–39.5 nm, the thermal conductivity coefficient was found relatively similar to 1.45–1.46 W/mK, respectively. The thermal conductivity coefficient has
Table 8: Thermal conductivity test results of aerogel-incorporated AAS mortars. Thermal conductivity (W/mK) S1 1.32 S2 1.45 S3 1.46 S4 1.58 S1 S2 S3 S4 1.3 1.35 1.4 1.45 1.5 1.55 1.6 5 5.5 6 6.5 7 7.5 8 8.5 9
Median pore diameter-area (nm)
Ther m al co nd uc ti vi ty (W/mK)
Figure 7: Relation between median pore diameter-area and thermal conductivity test results.
S1 S3 S2 S4 1.3 1.35 1.4 1.45 1.5 1.55 1.6 30 32 34 36 38 40 42 44 Thermal conductivity (W/mK)
Median pore diameter-volume (nm)
Figure 8: Relation between median pore diameter-volume and thermal conductivity test results.
decreased to the minimum value when the median pore diameter-volume value reached to 42.3 nm for S1 sample.
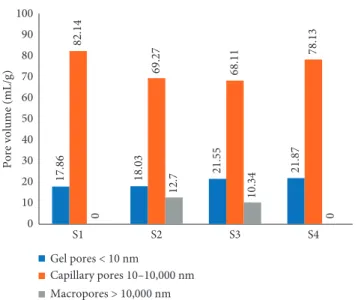
The percentage distribution of pore volumes in the total pore volume is shown in Figure 9. In the S1 sample at which the minimum thermal conductivity coefficient was found, minimum gel pore formation (17.86%) and max-imum capillary pore formation (82.14%) exist compared to the other samples. In S2 and S3 samples which have compressive strengths and thermal conductivity co-efficients close to each other, macropore formation in percentages of 12.7% and 10.35% was observed. In these samples, the formation of macropore increases the maximum total porosity values of the samples to 15.53 and 15.47% compared to the other samples; however, it could not ensure to decrease the conductivity coefficients to desired values.
4. Conclusions
(i) Increasing the aerogel content rates in equal ac-tivator dosaged samples causes negligible exten-sion at both initial and final setting times while increasing Li2CO3 dosage in mortar mixtures
shortens both initial and final setting times at mortar samples.
(ii) In the compressive strength test of aerogel-incorporated AAS mortars performed for 2-, 7-, and 28-day curing times, the highest compressive strengths were obtained from the samples with high Li2CO3doses (1.5%) and the lowest strength
values were determined at the samples with low Li2CO3doses (0.03%) for all curing times.
(iii) Partial strength increase was found with the incrementing aerogel additive ratio at 7- and 28-day samples while increasing aerogel content causes the partial loss in compressive strengths at
2-day ones. By means of increasing aerogel content in the samples with equal dosages, the maximum strength loss measured at 2-day samples is 4.9%. However, maximum strength increases were found as 0.9% and 1.4% at 7- and 28-day strength results for equal doses and increasing aerogel content rates.
(iv) Total porosity value tends to decrease due to the increasing median pore diameter-area value in the mortar samples.
(v) In aerogel-incorporated AAS mortar samples, median pore diameter-volume is more influential on compressive strength and thermal conductivity coefficient than the total porosity value. Since a satisfactorily high median pore diameter-volume value could not be detected in samples with higher total porosity and macropores, a significant re-duction in the conductivity coefficient was not observed.
(vi) The compressive strengths decrease with the in-creasing median pore diameter-volume values. In the samples with the lowest total porosity, mini-mum compressive strength under the control of maximum median pore diameter-volume values was found. The diameter difference of 9.6 nm corresponds to 8.2% improvement in compressive strength.
(vii) Minimum thermal conductivity coefficient (1.32 W/mK) was found by means of maximum median pore diameter-volume and maximum median pore diameter-area values at the 0.75% aerogel content rate and 0.03% Li2CO3 dosage. At these rates, gel
pore and capillary pore diameter formations are at the minimum (17.86%) and maximum (82.14%) levels, respectively.
(viii) The high correlation between compressive strength-median pore diameter-volume values remains valid in also between thermal conductivity coefficient-median pore diameter-volume values. The minimum thermal conductivity coefficient was found at the lowest total porosity value by means of the highest median pore diameter-area and median pore diameter-volume values.
(ix) Increasing activator dosage in equal aerogel con-tent rates brings about an increase in thermal conductivity coefficient due to the decrease in median pore diameter-volume value.
Data Availability
All data generated or analysed during this study are included in this published article.
Conflicts of Interest
The authors declare that there are no conflicts of interest regarding the publication of this paper.
17.86 18.03 21.55 21.87 82.14 69.27 68.11 78.13 0 12.7 10.34 0 0 10 20 30 40 50 60 70 80 90 100 S1 S2 S3 S4 Pore volume (mL/g) Gel pores < 10 nm Capillary pores 10–10,000 nm Macropores > 10,000 nm
Figure 9: Pore volume of gel pores, capillary pores, and macro-pores for all samples obtained from MIP data.
Acknowledgments
The authors specially thank Head of Bolu Cement Factory and employees.
References
[1] K. L. Scrivener and R. J. Kirkpatric, “Innovation in use and research on cementitious material,” Cement and Concrete
Research, vol. 38, no. 2, pp. 128–136, 2008.
[2] J. H. Kim and H. S. Lee, “Improvement of early strength of cement mortar containing granulated blast furnace slag using industrial byproducts,” Materials, vol. 10, no. 9, p. 1050, 2017. [3] H. S. Lee and X. Y. Wang, “Evaluation of the carbon dioxide uptake of slag-blended concrete structures, considering the effect of carbonation,” Sustainability, vol. 8, no. 4, p. 312, 2016. [4] D. E. Angulo-Ram´ırez, R. M. Guti´errez, and F. Puertas, “Alkali-activated Portland blast-furnace slag cement: me-chanical properties and hydration,” Construction and Building
Materials, vol. 140, pp. 119–128, 2017.
[5] R. J. Myers, S. A. Bernal, and J. L. Provis, “Phase diagrams for alkali-activated slag binders,” Cement and Concrete Research, vol. 95, pp. 30–38, 2017.
[6] T. Luukkonen, Z. Abdollahnejad, J. Yliniemi, P. Kinnunen, and M. Illikainen, “One-part alkali-activated materials: a re-view,” Cement and Concrete Research, vol. 103, pp. 21–34, 2018.
[7] X. Huang, S. Hu, F. Wang, Y. Liu, and Y. Mu, “Properties of alkali-activated slag with addition of cation exchange mate-rial,” Construction and Building Materials, vol. 146, pp. 321– 328, 2017.
[8] A. Fernandez-Jimenez and F. Puertas, “Effect of activator mix on the hydration and strength behaviour of alkali-activated slag cements,” Advances in Cement Research, vol. 15, no. 3, pp. 129–136, 2003.
[9] J. J. Chang, “A study on the setting characteristics of sodium silicate-activated slag pastes,” Cement and Concrete Research, vol. 33, no. 7, pp. 1005–1011, 2003.
[10] M. Najimi, N. Ghafoori, and M. Sharbaf, “Alkali-activated natural pozzolan/slag mortars: a parametric study,”
Con-struction and Building Materials, vol. 164, pp. 625–643, 2018.
[11] C. Shi, “Strength, pore structure and permeability of alkali-activated slag mortars,” Cement and Concrete Research, vol. 26, no. 12, pp. 1789–1799, 1996.
[12] F. Collins and J. G. Sanjayan, “Effect of pore size distribution on drying shrinkage of alkali-activated slag concrete,” Cement
and Concrete Research, vol. 30, no. 9, pp. 1401–1406, 2000.
[13] C. Shi, R. L. Day, X. Wu, and M. Tang, “Uptake of metal ions by autoclaved cement pastes,” MRS Proceedings, vol. 245, pp. 141–149, 1992.
[14] M. D. Jalal, A. Tanveer, K. Jagdeesh, and F. Ahmed, “Foam concrete,” International Journal of Civil Engineering Research, vol. 8, pp. 1–14, 2017.
[15] E. Cohen, “Thermal properties of advanced aerogel insu-lation,” M.S. dissertation, Massachusetts Institute of Tech-nology, Cambridge, MA, USA, 2011.
[16] A. C. Pierre and G. M. Pajonk, “Chemistry of aerogels and their applications,” Chemical Reviews, vol. 102, no. 11, pp. 4243–4265, 2002.
[17] M. A. Hasan, R. Sangashetty, A. C. M. Esther, S. B. Patil, B. N. Sherikar, and A. Dey, “Prospect of thermal insulation by silica aerogel: a brief review,” Journal of The Institution of
Engineers (India): Series D, vol. 98, no. 2, pp. 297–304, 2017.
[18] P. Westgate, K. Paine, and R. J. Ball, “Physical and mechanical properties of plasters incorporating aerogel granules and polypropylene monofilament fibres,” Construction and
Building Materials, vol. 158, pp. 472–480, 2018.
[19] T. Gao, B. P. Jelle, A. Gustavsen, and S. Jacobsen, “Aerogel-incorporated concrete: an experimental study,” Construction
International Journal of
Aerospace
Engineering
Hindawi www.hindawi.com Volume 2018Robotics
Journal of Hindawi www.hindawi.com Volume 2018 Hindawi www.hindawi.com Volume 2018Active and Passive Electronic Components VLSI Design Hindawi www.hindawi.com Volume 2018 Hindawi www.hindawi.com Volume 2018
Shock and Vibration Hindawi
www.hindawi.com Volume 2018
Civil Engineering
Advances inAcoustics and VibrationAdvances in Hindawi
www.hindawi.com Volume 2018
Hindawi
www.hindawi.com Volume 2018
Electrical and Computer Engineering Journal of Advances in OptoElectronics Hindawi www.hindawi.com Volume 2018
Hindawi Publishing Corporation
http://www.hindawi.com Volume 2013 Hindawi www.hindawi.com
The Scientific
World Journal
Volume 2018 Control Science and Engineering Journal of Hindawi www.hindawi.com Volume 2018 Hindawi www.hindawi.com Journal ofEngineering
Volume 2018Sensors
Journal of Hindawi www.hindawi.com Volume 2018 Machinery Hindawi www.hindawi.com Volume 2018 Modelling & Simulation in Engineering Hindawi www.hindawi.com Volume 2018 Hindawi www.hindawi.com Volume 2018 Chemical EngineeringInternational Journal of Antennas and Propagation International Journal of Hindawi www.hindawi.com Volume 2018 Hindawi www.hindawi.com Volume 2018 Navigation and Observation International Journal of Hindawi www.hindawi.com Volume 2018