Dergi web sayfası:
www.agri.ankara.edu.tr/dergi www.agri.ankara.edu.tr/journalJournal homepage:
TARIM BİLİMLERİ DERGİSİ
—
JOURNAL OF AGRICUL
TURAL SCIENCES
20 (2014) 337-344
Additive Main Effects and Multiplicative Interactions (AMMI)
Analysis of Grain Yield in Barley Genotypes Across Environments
Hasan KILIÇa
aBingöl University, Faculty of Agriculture, Department of Field Crops, 12000, Bingöl, TURKEY ARTICLE INFO
Research Article
Corresponding Author: Hasan KILIÇ, E-mail: [email protected], Tel: +90 (426) 216 00 12 / 175 Received: 14 January 2013, Received in Revised Form: 14 February 2014, Accepted: 14 March 2014
ABSTRACT
The study was carried out to analyze grain yield performances of nine varieties and sixteen advanced barley genotypes across eight environments of Southeastern Anatolia, Turkey, between 2003-2007 growing seasons. The experimental layout was randomized complete block design with four replications. Additive main effects and multiplicative interactions analysis (AMMI) revealed that the yield performances of genotypes were under the main environmental effects of genotype by environmental interactions. The first two principal component axes (IPCA 1 and IPCA 2) were significant (P<0.01) and cumulatively contributed to 61.07% of the total genotype by environmental interaction. According to the AMMI biplot analysis, genotype G17 and G21 had the desirable characteristics of high or moderate stability with high grain yield and were thus recommended for commercial release in Turkey and genotypes G7, G9 and the G8 proved to be valuable sources for yield stability in barley breeding programs.
Keywords: AMMI analysis; Barley; Biplot analysis; Grain yield; Stability
Arpa Genotiplerinde Çevreler Üzerinden Tane Verimlerinin Eklemeli
Ana Etkiler ve Çarpımsal İnteraksiyonlar Analizi
ESER BİLGİSİ Araştırma Makalesi
Sorumlu Yazar: Hasan KILIÇ, E-posta: [email protected], Tel: +90 (426) 216 00 12 / 175 Geliş Tarihi: 14 Şubat 2013, Düzeltmelerin Gelişi: 14 Şubat 2014, Kabul: 14 Mart 2014
ÖZET
Bu çalışma, 16 ileri hat ve 9 arpa çeşidinin 8 çevrede verim performanslarını belirlemek amacıyla 2003-2007 yılları arasında yürütülmüştür. Denemeler, tesadüf blokları deneme deseninde 4 tekerrürlü olarak kurulmuştur. Eklemeli ana etkiler ve çarpımsal interaksiyonlar analizi (AMMI), genotip × çevre interaksiyonunda genotiplerin verim performansları üzerine çevresel etkilerin baskın olduğunu göstermiştir. İlk iki ana bileşen ekseni (PCA 1 ve PCA 2), istatistiki olarak önemli (P<0.01) bulunmuş ve genotip × çevre interaksiyonunun % 61.07’sini açıklamıştır. AMMI modeli esas alınarak yapılan biplot analizlerinden elde edilen bulgular: (1) orta veya yüksek stabilite ile birlikte yüksek tane verimine sahip olmaları sebebiyle G17 ve G21 genotipleri Türkiye’de tescile teklif edilmiştir; (2) G7, G9 ve G8 genotiplerinin verim stabilitesi bakımından arpa ıslah programları için önemli bir kaynak oldukları tespit edilmiştir.
1. Introduction
Barley (Hordeum vulgare L.) is the second important cereal crop of Turkey and accounts for about 25% of the total cereal production (SAP 2010). In South-Eastern Anatolia, barley has been cultivated for many years and has a significant role. It is also grown mainly on rainfall conditions, but genotype × environment interaction (GEI) restricts the progress in yield improvement under rainfed and unpredictable climatic conditions. Thus, experimental research needs to be carried out over multiple environment trials in order to identify and analyse the major factors that are responsible for genotype adaptation and final selection (DeLacy et al 1996; Öktem et al 2004; Özcan et al 2005; Akcura et al 2006). GEI is an important for plant breeders and agronomists and the stability is mostly used to characterize a genotype, which specified a comparatively stable yield and not affected to changing environmental conditions. In barley improvement activities and in many aspects of barley research, the analysis of GEI is of primary importance, as it is also for other crops (Ceccarelli 1996; Annicchiarico 2002; Voltas et al 2002). The stability methods can be divided into two major groups: parametric (univariate and multivariate) and non parametric stability measures. The main problem with univariate and nonparametric stability statistics is that they do not provide an accurate picture of the complete response pattern, because of the multivariate nature of the genotype‘s response to varying environments (Lin et al 1986). Therefore, using multivariate statistics such as the AMMI model is more useful than univariate stability methods for explanation GEI. The AMMI model ensures a multivariate analytical parameter for interpreting GEI (Crossa et al 1990; Ebdon &Gauch 2002).
When main effects and interaction are both important, AMMI is the model of first choice to improve accuracy of yield estimates (Zobel et al 1988). AMMI method combines ANOVA and principal component analysis (PCA) into a united approach. The most important feature of this analysis is that adjustment is carried out using information from other locations to refine the estimates within
a given location (Sadeghi et al 2011). It removes residual or noise variation from GEI (Crossa et al 1990). It has no specific experimental design requirements, except for a two-way data structure (Zobel et al 1988). The effectiveness of AMMI procedure has been widely applied by many authors (Zobel et al 1988; Yan & Rajcan 2002; Yan et al 2001; Kaya et al 2002; Muhe & Assefa 2010; Wieslaw et al 2011; Mahalingam et al 2006; Ilker et al 2009; Banik et al 2010; Bantayehu 2009; Rodriguez et al 2007). Therefore, the objectives of the study were to (i) explicate GEI obtained by AMMI analysis of yield performances of twenty five barley genotypes over eight environments, (ii) visually evaluate variation of yield performances across environments based on the biplot and (iii) determine genotypes with high grain yield stability.
2. Material and Methods
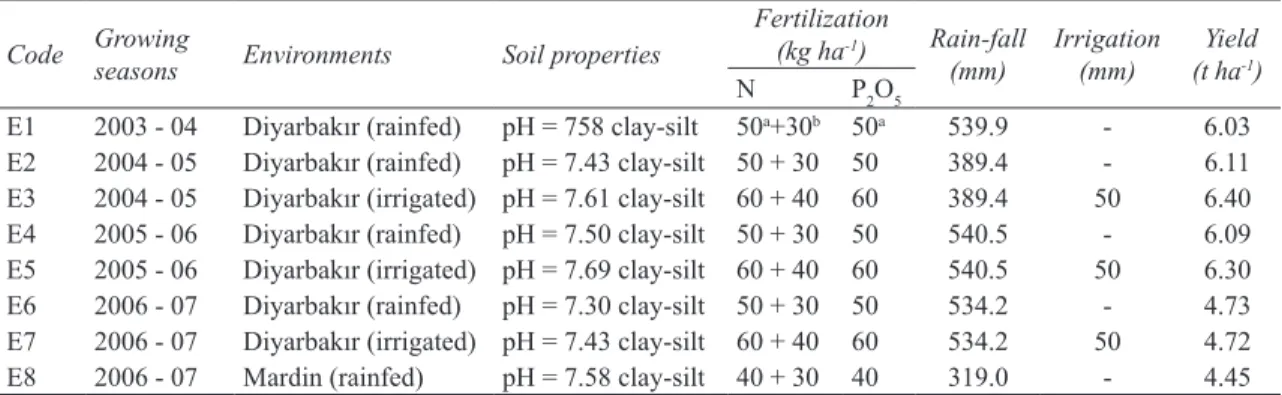
The study was carried out to determine the yield performances of twenty five barley genotypes across eight environments, including five rain-fed environments and three irrigated environments. The agro-ecological characteristics of the locations are shown in Table 2. Sixteen of the twenty five genotypes were advanced genotypes that were obtained from the ICARDA (International Center for Agricultural Research in the Dry Areas), and nine were modern varieties that were chosen from those evaluated in national variety trials and recommended for the south eastern Anatolia, except for Beecher, Assala-04, W12291 and Moroc 9 - 75, which have never been commercialized in Turkey. The name and code of genotypes are given in Table I.
The experiment was conducted using randomized completely block design (RCBD) with four replicates. The experimental plots consisted of six rows, each five m in length with twenty cm row spacing. The seeding density was four hundred seeds m-2. All test plots were sown in the fall (November),
which is the optimal sowing time for barley in the trial areas. The growing seasons, soil properties, amount of rainfall together with supplementary irrigation and details of fertilizer application at each
Table 1- Name or pedigree, code number and mean grain yield in 8 environment of barley genotypes used for AMMI analysis
Çizelge 1- AMMI analizine esas kullanılan arpa genotiplerinin isim, pedigri, kod numaraları ve sekiz çevreye ait tane verim ortalamaları
Code Pedigree and selection history Origin Yield (t ha -1)
G1 Hml02/Arabi Abiad//ER/Apm/3/Belford Barley/Carben//Ms237ICB89-0014-5LAB-1AP-0TR-0AP-5AP-0AP-4AP-8AP-0AP IBYT-MRA 5.929
G2 Lignee527/Chn-01//Lignee527/As45ICB93-0813-0AP-5AP-0AP IBYT-MRA 5.562
G3 Hma-02//11012- 2/CM67/3/Arar/PI386540//Giza121/PueICB93-0247-0AP-9AP-0AP IBYT-MRA 5.514
G4 Beecher USA 5.209
G5 Şahin-91 TURKEY 4.938
G6 Assala-04 ICARDA 4.990
G7 SLB15-05/4/H.spont.96-3/3/Roho//Alger/Ceres362-1-1ICB93-0700-0AP-10AP-0AP IBYT-MRA 5.989
G8 WI2291 USA 6.024
G9 Alanda/4/Arar/3/Mari/Aths*2//M-Att-73-337-1ICB94-0512-14AP-0AP IBYT-MRA 6.085
G10 Sur-93 TURKEY 5.170
G11 F2cc33ms/Cı07555//AlandaICB93-0436-0AP-2AP-0AP IBYT-MRA 6.105
G12 Rhn/Lignee527/3/Hma-02//11012-2/CM67ICB93-0251-0AP-10AP-0AP IBYT-MRA 5.135 G13 Hm02//110122/CM67/6/CI01021/4/CM67/U.Sask.1800//Pro/CICB94-0564-40AP-0AP IBYT-MRA 5.880
G14 Unknown - 5.382
G15 Tokak - 157/37 TURKEY 4.465
G16 Arar/PI386540//Giza121/Pue/3/Lignee527//Chn-01ICB93-0394-0AP 3AP-0AP IBYT-MRA 5.524 G17 Arta/4/Arta/3/Hml-02//Esp/1808-4LICB96-0601-0AP-10AP-0AP (Altıkat) IBYT-LRA-M 6.075 G18 Erdorado/4/ROD586/Nopal’s’/3/PmB/Aths//BcICB93-0932-0AP-1AP-0AP IBYT-LRA-M 5.703
G19 Hml-02//WI2291/BgsICB83-1554-1AP-1AP-6AP-0AP-6AP-0AP IBYT-LRA-M 5.443
G20 Vamıkhoca - 98 TURKEY 5.753
G21 Hml-02//WI2291/Bgs (Samyeli)ICB83-1554-1AP-1AP-6AP-0AP-22AP-0AP IBYT-LRA-M 6.076 G22 805145/Hma01/6/805132/4/Bera’s’/Cel//Oksam/3/Ore’s’/5/GloriICB93-0209-0AP-5AP-0AP IBYT-LRA-M 5.179
G23 Moroc9 - 75 ICARDA 6.716
G24 Moroc9-75/WI2291/WI2269ICB93-1132-0AP-32AP-0AP IBYT-LRA-M 5.467
G25 Akhisar -98 TURKEY 5.711
Mean 5.601
LSD (0.05) 0.326
IBYT-MRA, international barley yield trials Moderate Rainfall Areas (ICARDA); IBYT-LRA-M, low rain fall areas (mild winter) (ICARDA), genotypes name in italics and bolds are variety; Means followed by same letter (or no letter) do not differ significantly at P < 0.05 using LSD
location during the growing period are given in Table II. All agronomic application such as weed control and fertilization were practiced uniformly except irrigation which was only applied to experiment conducted under irrigated conditions.
Combined analysis of variance was carried out for all the tested environments and then genotype × environment interaction was partitioned according to AMMI model in accordance to Gauch & Zobel (1996). The larger the PCA scores, either negative or positive, the more specifically adapted a genotype is to certain environments; the smaller the PCA scores, the more stable the genotype is over all environments studied (Bantayehu 2009). AMMI analysis combines ANOVA and principal component analysis (PCA) into a single model with additive and multiplicative parameters. All statistical analysis was carried out using the SAS (Statistical Analysis Systems) program (SAS Institute 1999).
3. Results and Discussion
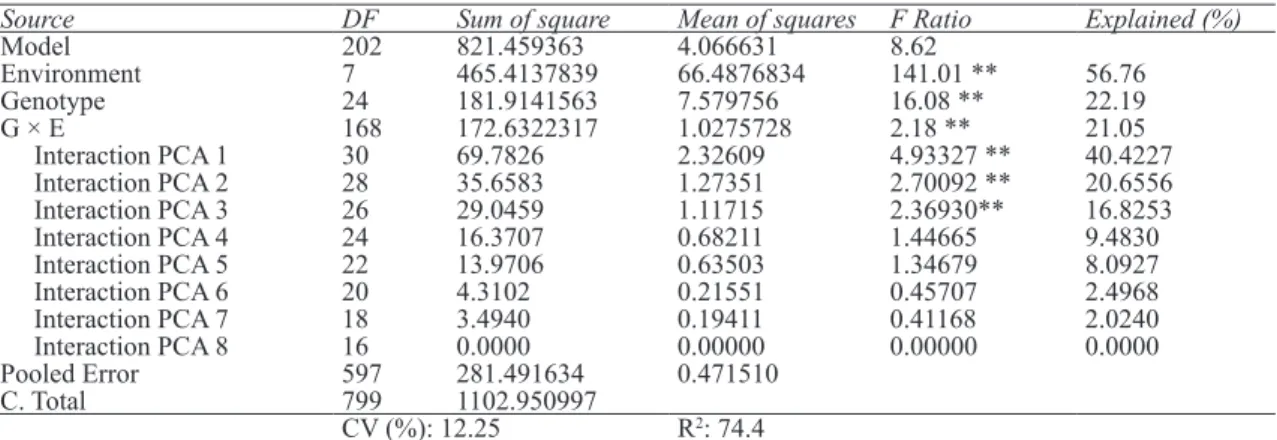
The AMMI analysis of variance of grain yield (t ha-1) of the twenty five genotypes tested in
eight environments demonstrated that 56.76% of the total sum of squares was attributable to environmental effects, only 22.19% to genotypic effects and 21.05% to GEI effects (Table III). Results from AMMI analysis (Table III) also
indicated that the IPCA 1 of the interaction captured 40.42% of the interaction sum of squares in 17.85% of the interaction degrees of freedom. Moreover, IPCA 2 explained a further 20.66% of the GEI sum of squares. The mean squares for the IPCA 1 and IPCA 2 were significant at P < 0.01 and cumulatively contributed to 61.07% of the total GEI. The model was adequate enough to explain the total genotype x environment interaction component. Besides, Yan & Rajcan (2002) reported that the GT (genotype-by-trait biplot) for each of the six years explained 52 to 63% the total variation of the standardized data. Also, the prediction assessment showed that AMMI with only two interaction principal component axes was the best predictive model (Zobel et al 1988) and had 58 degrees of freedom. Further interaction principal component axes captured mostly noise and therefore, did not help to predict validation observations (Mekonnen & Mohammed 2010). Thus, the interaction of the twenty five genotypes with eight environments in this study was predicted by the first two principal components of genotypes and environments.
The IPCA scores of a genotype provide indicators of the stability of a genotype across environments (Purchase 1997). The inferences drawn from biplots will be valid only when the IPCA or the first two
Table 2- Data on experiment, soil properties and climate for environments where the experiments were conducted
Çizelge 2- Denemelerin yürütüldüğü çevrelere ait toprak ve iklim özellikleri
Code Growingseasons Environments Soil properties Fertilization(kg ha-1) Rain-fall
(mm) Irrigation(mm) (t ha Yield-1)
N P2O5
E1 2003 - 04 Diyarbakır (rainfed) pH = 758 clay-silt 50a+30b 50a 539.9 - 6.03
E2 2004 - 05 Diyarbakır (rainfed) pH = 7.43 clay-silt 50 + 30 50 389.4 - 6.11
E3 2004 - 05 Diyarbakır (irrigated) pH = 7.61 clay-silt 60 + 40 60 389.4 50 6.40
E4 2005 - 06 Diyarbakır (rainfed) pH = 7.50 clay-silt 50 + 30 50 540.5 - 6.09
E5 2005 - 06 Diyarbakır (irrigated) pH = 7.69 clay-silt 60 + 40 60 540.5 50 6.30
E6 2006 - 07 Diyarbakır (rainfed) pH = 7.30 clay-silt 50 + 30 50 534.2 - 4.73
E7 2006 - 07 Diyarbakır (irrigated) pH = 7.43 clay-silt 60 + 40 60 534.2 50 4.72
E8 2006 - 07 Mardin (rainfed) pH = 7.58 clay-silt 40 + 30 40 319.0 - 4.45
IPCAs explain maximum interaction variation. Also, biplots are commonly used to explain AMMI results considering one or two PCAs at a time. Plant breeders would like to identify varieties which are stable and high yielding when more than two PCA axes are retained in the AMMI model which cannot be explained with the help of biplots (Hanamaratti et al 2009), in general, factors like type of crop, diversity of the germplasm, and range of environmental conditions will affect the degree of complexity of the best predictive model (Crossa et al 1990).
In Figure 1, the IPCA1 scores for both the genotypes and environments were plotted against the grain yield for the genotypes and the environments and in Figure 2, the IPCA1 scores for both the genotypes and environments were plotted against the IPCA2 scores for the genotypes and the environments. In the biplot, the broken vertical line passing through the center of the biplot was the grand mean (5.601 tone ha-1) of the experiment, and
the solid horizontal line passed through at the IPCA1 axis score = 0. The IPCA1 was highly significant and explained the interaction pattern better than other interaction axes. The mean genotypes or environments in AMMI model 1 biplot located on the same parallel line, relative to the ordinate, have similar yield, while those located on the right side of
Table 3- AMMI analysis for grain yield (t ha-1) of 25 genotypes evaluated in 8 environments
Çizelge 3- Tane verimi açısından 25 adet genotipin değerlendirildiği 8 çevreye ait AMMI analizi
Source DF Sum of square Mean of squares F Ratio Explained (%)
Model 202 821.459363 4.066631 8.62 Environment 7 465.4137839 66.4876834 141.01 ** 56.76 Genotype 24 181.9141563 7.579756 16.08 ** 22.19 G × E 168 172.6322317 1.0275728 2.18 ** 21.05 Interaction PCA 1 30 69.7826 2.32609 4.93327 ** 40.4227 Interaction PCA 2 28 35.6583 1.27351 2.70092 ** 20.6556 Interaction PCA 3 26 29.0459 1.11715 2.36930** 16.8253 Interaction PCA 4 24 16.3707 0.68211 1.44665 9.4830 Interaction PCA 5 22 13.9706 0.63503 1.34679 8.0927 Interaction PCA 6 20 4.3102 0.21551 0.45707 2.4968 Interaction PCA 7 18 3.4940 0.19411 0.41168 2.0240 Interaction PCA 8 16 0.0000 0.00000 0.00000 0.0000 Pooled Error 597 281.491634 0.471510 C. Total 799 1102.950997 CV (%): 12.25 R2: 74.4
**, P < 0.01 probility level; DF, degree of freedom; F, tabulated frequency; CV, coefficient of variation; R2, correlation coefficient of
multiple determination
Figure 1- Biplot analysis of GEI based on AMMI 1 model for the PCA1 scores and grain yield
Şekil 1- Tane verimi ve PCA 1 skoru için AMMI 1 modeli esaslı GEI biplot analizi
Figure 2- Biplot analysis of GEI based on AMMI 2 model for the first two interactions principal component scores
Şekil 2- İlk iki ana bileşen interaksiyonlarına ait AMMI 2 model esaslı GEI biplot analizi
the center of the axis has higher yields than those on the left hand side (Banik et al 2010).
The AMMI model 1 biplot of the barley genotypes was demonstrated in Figure 1. The environments demonstrated much variability in both main effects and interactions. In the biplot, nine barley genotypes (G7, G8, G9, G11, G13, G17, G18, G20, G21, G23 and G25) and five environments (E1, E2, E3, E4 and E5) located at the right side of the grand mean were considered as high yielding genotypes and environments while their corresponding low yielding counterparts were located at the left side of the grand mean (Figure 1). In addition, the high potential environments were distributed evenly in quadrant II (E3) and IV (E4 and E5) with minimum interaction effects, while the high potential environments were sparsely distributed in quadrants II (E1 and E2) with high IPCA1 values. The lowest yielding environments, E6 and E7 demonstrated the high IPCA1 scores. This biplot also indicated E3 as the highest yielding environment.
The relative contributions of barley genotypes to GEI sum square were represented by the magnitude of the respective IPCA score, which in turn determined their position in the biplot. Barley genotypes (G10, G15, G16, G19 and G25) located far from the IPCA axis contributed more to the GEI sum square than other genotypes that were located either on or closer to IPCA1 axis = 0 (Figure 1). Barley genotypes (G2, G3, G7, G8, G14 and G17) had IPCA score value closer to zero, and were classified as highly stable whereas the IPCA scores of cultivars (G1, G4, G5, G6, G9, G11, G12, G18, G20, G21, G22, and G24) were moderately large, and these group of barley genotypes could be classified as less stable. Consequently, AMMI 1 model analysis of barley genotypes produced three categories of responses: (1) most stable and high yielding genotypes G17, G8 and G7, (2) less stable and high yielding genotypes, G21, G23, G11 and G9, and (3) most stable and low yielding genotypes, G2, G3, G14, G12 and G5 ( Figure 1).
However, for the AMMI 2 model, PCA2 scores was considered in interpreting GEI that captured
20.07% of the interaction sum of squares as suggested by Gauch & Zobel (1996). The AMMI model 2 biplot of the genotype trials was demonstrated in Figure 2. A biplot is generated using genotypic and environmental scores of the first two AMMI components (Vargas & Crossa 2000). As IPCA2 scores also have a significant role in explaining the GEI, the IPCA1 scores were plotted against the IPCA2 scores for further explore adaptation (Figure 2). Moreover, when IPCA1 was plotted against IPCA2, Purchase (1997) explained that the closer the genotypes score to the center of the biplot, the more stable they are. According to this figure, G2, G7, G6, G9, G3, G8, G14, G12 and G5 were close to the center and were considered to have high grain yield stability. A little further from the origin were the genotypes G24, G19, G20, G17, G18, G1, G21 G13 and G23 which may be considered to have medium stability. On the other hand, the genotypes G15, G11, G4, G22, G25 and G10 are unstable due to their dispersed position. Also, biplot analysis (Figure 2) displayed that genotype G10, G25 and G22 and environment E1, E2 and E7 have the greatest effect in the GE interaction. Genotype number G25 has specific adaptation with environment E2, while genotype number G10 has specific adaptability with environment E1 and genotype G22 has specific adaptation with environment E3. The accessions G1; G2, G14, G16, G23, G11 and G18 have positive interaction with environment E6 and E7. Genotype G6, G7, G3, G8, G14 and G4 have positive interaction with environment E8, but as the length of the vector for genotype 4 is more on the environment E8, hence it has specific adaptability with environment E8. The genotype G5, G20, G24, G19, G15 and G10 have positive interaction with environment E1. The underlying causes of the interaction observed can therefore be based on both the genetic differences between these genotypes and the different in environments (Wallace et al 1995).
4. Conclusions
The analysis of variance for the AMMI model of grain yield showed that genotypes, environments, genotype x environments interaction and AMMI
components 1 and 2 were significant. Thus, both yield and PCA1 and PCA2 scores should be taken into account simultaneously to utilize the useful effect of GEI and to make recommendation of the genotypes more accurate. It showed that the GEI was an important source of barley yield variation and its biplots were powerful enough for visualizing the response patterns of genotypes and environments. The variety G23 (Moroc9-75) ranked first in grain yield but tended to be unstable. Genotype G7, G9, G8, and G17, namely Altıkat, the best yielding among the studied genotypes showed high yield stability, while G2 and G3 were moderately yielding and high stable genotypes. Genotypes G17, G1, G21 and G13 were high yielding and moderate stable genotypes. Genotype G18 and G20 were moderately yielding and moderate stable genotypes. E5 (Diyarbakır irrigation) environment was the best for testing barley genotypes.
As a result, advanced line G17 and G21 were ideal candidates in this regard as they had high or moderate stability with high grain yield and desirable quality with acceptable morphological traits. These genotypes, namely Altıkat and Samyeli cultivar respectively, proposed for registration were approved for spring coast regions of Turkey. Also, genotypes G7, G9 and variety G8 (W12291) identified to be a valuable source for yield stability in barley breeding programs.
Acknowledgement
The author wish to thank the department of breeding staffs of South-Eastern Anatolia Agricultural Research Institute for their help in collecting and compiling the data and thank Mevlut AKÇURA for his help in statistical analysis.
Abbreviations and Symbols
AMMI additive main effects and multiplicative interactions
PCA principal component analysis (axes)
E environment
G genotype
GEI genotype environment interaction
References
Akcura M, Kaya Y, Taner S & Ayrancı R (2006). Parametric stability analyses for grain yield of durum wheat. Plant Soil Environtment 52(6): 254–261 Annicchiarico P (2002). Genotype environment
interactions challenge and opportunities for plant breeding and cultivar recommendations. FAO Plant production and protection, pp. 174
Banik B R, Khaldun A B M, Mondal A A, Islam A & Rohman M M (2010). Assessment of genotype-by-environment interaction using additive main effects and multiplicative interaction model (AMMI) in Maize (Zea mays L.) Hybrids. Academic Journal of Plant Sciences 3(4): 134-139
Bantayehu M (2009). Analysis and correlation of stability parameters in malting barley. African Crop Science Journal 17(3): 145-153
Ceccarelli S (1996). Positive interpretation of genotype by environment interactions in relation to sustainability and biodiversity. In: Cooper M, Hammer GL (eds) Plant adaptation and crop improvement. CAB International in association with IRRI and ICRISAT, Wallingford, pp. 467-486
Crossa J, P N Fox, Pfeifer W H, Rajaram S & Gauch H G (1990). AMMI adjustment for statistical analysis of international wheat yield trial. Theoretical and Applied Genetics 81: 27-37
DeLacy I H, Basford K E, Cooper M, Bull J K & McLaren C G (1996). Analysis of multi-environment data - An historical perspective .In: M Cooper & G L Hammer (Eds), Plant adaptation and crop improvement, Wallingford, UK, CABI, pp. 39-124
Ebdon J S & Gauch H G (2002). Additive main effect and multiplicative interaction analysis of national turfgrass performance trials. II cultivar recommendations. Crop Science 42: 497-506
Gauch H G & Zobel R W (1996). AMMI analyses of yield trials. In Kang MS and Gauch HG (eds.). Genotype by environment interaction. CRC. Boca Raton, Florida, pp. 85-122
Hanamaratti N G, Salimath P M, Vijayakumar C H M, Ravikumar R L, Kajjidonı S T & Chetti M B (2009). Genotypic stability of superior near isogenic introgression lines for productivity in upland rice. Karnataka Journal of Agricultural Sciences 22(4): 736-740
Ilker E, Tonk F A, Çaylak Ö, Tosun M & Özmen İ (2009). Assessment of genotype x environment interactions
for grain yield in maize hybrids using AMMI and gge biplot analyses. Turkish Journal of Field Crops 14(2): 123–135
Kaya Y, Palta Ç & Taner S (2002). Additive main effects and multiplicative interactions analysis of yield performances in bread wheat genotypes across environments. Turk Journal of Agricultural Forestry
26: 275-279
Mahalingam L, Mahendran S, Chandra B R & Atlin G (2006). AMMI Analysis for stability of grain yield in rice (Oryza sativa L). International Journal of Botany
2(2): 104-106
Mekonnen Z & Mohammed H (2010). Study on genotype x environment interaction of oil content in sesame (Sesamum indicum L.) World Journal of Fungal and Plant Biology 1(1): 15-20
Muhe K & Assefa A (2010). Genotypes × environment interaction in bread wheat (Triticum aestivum L.) cultivar development in Ethiopia. International Research Journal of Plant Science 2(10): 317-322 Öktem A, Engin A & Çölkesen M (2004). Arpada
(Hordeum vulgare L.) genotip x çevre interaksiyonları ve stabilite analizi. Tarım Bilimleri Dergisi-Journal of Agricultural Sciences 10(1): 31-37
Özcan H, Aydın, N & Bayramoğlu H O (2005). Ekmeklik buğdayda verim stabilitesi ve stabilite parametreleri arasındaki korelasyon. Tarım Bilimleri Dergisi-Journal of Agricultural Sciences 11(1): 21-25 Purchase J L (1997). Parametric analysis to describe
G×E interaction and yield stability in winter wheat. PhD. Thesis, Department of Agronomy, Faculty of Agriculture, University of the Orange Free State, Bloemfontein, South Africa
Rodriguez M, Rau D, Papa R & Attene G (2007). Genotype by environment interactions in barley (Hordeum vulgare L.): different responses of landraces, recombinant in bred lines and varieties to Mediterranean environment. Euphytica, DOI10.1007/ s10681-007-9635-8
Sadeghi S M, Samizadeh H, Amiri E & Ashouri M (2011). Additive main effects and multiplicative interactions (AMMI) analysis of dry leaf yield in tobacco hybrids across environments. African Journal of Biotechnology 10(21): 4358-4364
SAP (2010). Statistics of agricultural production From: http://www.tarimsal.com/tarim_istatistikleri.htm Vargas M & Crossa J (2000). The AMMI analysis and
graphing the biplot. Biometrics and Statistics Unit, CIMMYT
Voltas J, Van Eeuwijk F A, Igartua E, Garciadel Moral L.F, Molina Cano J L & Romagosa I (2002). Genotype by environment interaction and adaptation in barley breeding: basic concepts and methods of analysis. In: Slafer GA, Molina-Cano JL, Savin R, Araus JL, Romagosa I (eds) Barley science: recent advances from molecular biology to agronomy of yield and quality. New York, Food Product Press, ISBN1-56022-909-8
Wieslaw M.S, Gacekb E, Paderewski J, Gozdowski D & Drzazga T (2011). Adaptive yield response of winter wheat cultivars across environments in Poland using combined AMMI and cluster analyses. International Journal of Plant Production 5(3): 1735-8043 Wallace D H, Youstone K S, Baudoin J P, Beaver J, Coyne
D P, White J W & Zobel R W (1995). Photoperiod × temperature interaction effects on the days to flowering of beans (Phaseolus vulgaris L.). In: Handbook of Plant and Crop Physiology. Mohammed Pessaraki (Ed.), pp. 863-891
Yan W, Cornelius P L, Crossa J & Hunt L A (2001). Two types of GGE biplots far analyzing multi-environment trial data. Crop Science 41: 656-663
Yan, W & Rajcan I (2002). Biplots analysis of the test sites and trait relations of soybean in Ontario. Crop Science 42: 11-20
Zobel R W, Wright M & Gauch H G (1988). Statistical analysis of a yield trial. Agronomy Journal 80: 388-393