İşletme Fakültesi Dergisi, Cilt 7, Sayı 2, 2006, 1-18
THE INTEGRATION OF THE ISTANBUL STOCK EXCHANGE (ISE) TO THE EUROPEAN UNION COUNTRIES STOCK
MARKETS
Pınar Evrim Mandacı*, Dezhid Vanchikova** Abstract
The aim of this study is to investigate whether the Turkish stock market is integrated or not with the European Union (EU) countries stock markets as a potential candidate for entering the EU. We use Engle-Granger co-integration test to investigate long-run co-integration relations between the Turkish stock market and the EU stock markets. We found long-run co-movements for all the markets indicating limited benefits for portfolio diversification for the EU investors in the Turkish stock market. Also, using a dummy variable, we examine whether integration between the markets increased or decreased during the post-Customs Union (CU) period. The results show increasing co-integration only with the Austrian market among the developed markets of the EU countries and with the Eastern European (EE) markets except Hungary, integration with all the other markets decreased after the passage to the CU.
Keywords: Co-integration, international diversification, stock markets
Özet
Bu çalışmanın amacı, AB’ye üye olma yolunda potansiyel aday ülkelerinden biri olan Türkiye’deki hisse senedi piyasasının AB ülkelerinin hisse senedi piyasalarına entegre olup olmadığını araştırmaktır. Türk ve AB ülkeleri hisse senedi piyasaları arasındaki entegrasyonu test etmede Engle-Granger eşbütünleşme testi kullanılmıştır. Çalışmada, Türk hisse senedi piyasası ile ele alınan tüm AB ülkeleri piyasaları arasında uzun dönemli birlikte hareketlilik gözlemlenmiştir. Bu durum AB yatırımcılarının Türk hisse senetlerini portföylerine katmaları ile yapacakları çeşitlendirmeden sağlayacakları faydayı kısıtlamaktadır. Ayrıca çalışmada kukla değişken kullanılarak Türkiye’nin Gümrük Birliğine girişinden sonraki dönemde AB piyasaları ile entegrasyonun artıp artmadığı araştırılmıştır. Çalışmanın sonuçları, Türkiye’nin Gümrük Birliğine girişinden sonra, gelişmiş AB piyasaları içinde Avusturya piyasası ile ve Doğu Avrupa ülkelerinden Macaristan hariç diğerleriyle entegrasyonun arttığını ve diğer tüm ülke piyasalarıyla ise azaldığını göstermektedir.
Anahtar Kelimeler: Eşbütünleşme, uluslararası çeşitlendirme, hisse senedi piyasaları.
* Yrd.Doç.Dr.
, Dokuz Eylül Üniversitesi, İşletme Fakültesi, Buca, İzmir, E-mail: [email protected]
**
Credit Department Specialist, Credit Europe Bank, Ltd., E-mail: [email protected]
THE INTEGRATION OF THE ISTANBUL STOCK EXCHANGE (ISE) TO THE EUROPEAN UNION COUNTRIES STOCK MARKETS
INTRODUCTION
In this study we investigate the integration of the Turkish equity market with the European Union (EU) countries equity markets. Since the EU aims at the economic, commercial and political integration of the European countries, it is interesting to examine whether the Turkish equity market is integrated with EU equity markets as a possible candidate for the entrance.
In an integrated world equity market, individual stock prices are expected to have long-run relationships, i.e., share common stochastic trends. Many researchers using different methods analyzed long-run relationships between markets or groups of markets. Early researches were mostly devoted to developed markets as the US, Japan, and Western Europe, while recent ones to emerging markets. The most investigated among them have been the markets of Asia and Latin America, as well as the Central European (CE) markets. This focus on emerging markets has been determined by the fact that emerging markets provide good portfolio diversification opportunities for assets invested only in developed markets. This becomes possible because of low correlation coefficients between developed and emerging markets. In general, integration of markets implies long-run relationships between markets and limited diversification benefits for investors.
Most of the recent studies on co-integration were concentrated on CE emerging markets and world developed markets and try to find out whether the CE markets are integrated with major developed European markets or the other major world developed markets such as US. Linne (1998) reported evidence of co-integration within CE markets and no cointegration between CE and mature European markets. Gilmore and McManus (2002) examied the short and long–term relations between three CE markets and US and found no long-run links after the aplication of Johansen cointegration test. The Granger-causality test revealed a causality running from the Hungarian to Polish market, but none with the US. Voronkova (2004) investigated the existence of long-run relations between CE and the mature markets of Europe and US by implementing Gregory and Hansen (1996) residual-based test for cointegration which allows for a structural break in cointegration relationships. Syriopoulos (2005) examined the impact of European Monetary Union (EMU) on stock market linkages and found a stationary long run comovement between CE (Poland, Czech, Hungary and Slovakia) and developed markets (Germany and US) in both the per-EMU and post-EMU subperiods.
There are few works examining integration of the Turkish stock market with the EU stock markets. For example, Darrat and Benkato (2003) applying co-integration techniques on monthly stock price indices
The Integration of the Istanbul Stock Exchange (ISE) to the European Union Countries Stock Markets
3
investigate whether the Turkish stock market is integrated with four developed markets of the US, the UK, Japan and Germany for the period of January 1986 to March 2000. They find a significant co-integrating relationship to exist between the ISE and these matured markets only in the post-liberalization period. Lagoarde-Segot and Lucey (2005), in their study on long run equity linkages in the Middle East and North Africa (MENA), using Gregory-Hansen co-integration test on daily data ranging from 01.01.1998 until 11.16.2004 for stock market price indices from Turkey, Morocco, Tunisia, Egypt, Lebanon, Jordan, Israel, found Turkey to have a few co-integrating vectors with the EMU and the US. Berument and Ince (2005) performing recursive VAR model on daily observations from 23.10.1987 to 08.06.2004 analyze relationship between the US stock market and the Turkish stock market. They show that US is not affected by Turkey, but Turkey is influenced by the US market much. Kasman and Kasman (2005) examined the integration of the Turkish stock market with its four leading trading partners, Germany, France, UK and Italy, in Europe for the period 2004, and sub-periods 1988-1995 (pre CU) and 1996-2004 (post CU). Conventional co-integration tests, Engle and Granger (1987) and Johansen (1988) indicated that Turkish stock market was not integrated with four European stock markets before and after the CU. Gregory and Hansen (1996) residual-based co-integration test, on the other hand, show evidence of some integration among the five markets for the post CU after controlling for structural changes.
Many researches have used different co-integration tests in order to examine long-run relationships between equity markets. In this paper, we use Engle-Granger co-integration test and Error Correction Model to investigate long-run co-integration relations. Addition to the previous studies, we extend our sample data and test co-integration between the Turkish stock market and the 17 EU stock markets. The data used in the study are monthly stock price indices for the period 1988-2006 for 14 developed markets of the EU and for the period 1994-2006 for 3 emerging markets of the EU. We divide the markets of the EU into the developed markets of the EU and the emerging markets of the EU which are the Eastern European (EE) markets in order to find out whether the ISE, as an emerging market, is integrated more with the developed markets or with the emerging markets, or both.
In contrast to some of the previous studies above we found the presence of long-run co-movements for all the markets, both the developed and emerging, i.e., there is co-integration between the Turkish stock market and the EU stock markets. We make a conclusion that the benefits for portfolio diversification are limited for the EU investors in the Turkish stock market. Also, using a dummy variable we examined whether integration between the markets increased or decreased during the post-CU period. The results showed increasing integration of the ISE
only with the Austrian market from the developed markets of the EU and with the EE markets except Hungary, integration of the ISE with all the other markets decreased after the passage to the CU. And finally we analyzed short-run relations between the markets using Error Correction Model (ECM). We found that in average 7% of disequilibrium in every market is corrected each month in the developed markets of the EU and in average 8% in the emerging markets of the EU. The overall conclusion of the study is that the ISE is integrated with the EU major stock markets, both the developed and developing ones.
The remainder of this paper proceeds as follows. Section 2 briefly introduced the data, section 3 summarized the methodology. The empirical results are presented and the implications are discussed in section 4. Section 5 concludes the paper.
DATA
The data used in the study are monthly natural logarithm stock price indices for Turkey and 17 EU countries. They are Austria, Belgium, Denmark, Finland, France, Germany, Greece, Ireland, Italy, the Netherlands, Portugal, Spain, Sweden, the UK, the Czech Republic, Hungary, and Poland. Also used in the study are the world, the European, the EE, and the emerging markets indices. The other EU member countries as Luxemburg, the Baltic countries and others are not included in the study for the insufficient data. There are two samples in our study: the sample period of the 18-year period, January 1988 through February 2006, for the developed markets of the EU, and 12-year period from December 1994 through February 2006 for the developing markets of the EU. The data are obtained from Morgan Stanley Capital International (MSCI) country equity indices. All the index series are in US dollars. Monthly stock returns for the twenty two stock price indices are calculated according to the following formula:
Returns = (ln price index t – ln price index t-1) / ln price index t-1
METHODOLOGY
The integration of Turkish stock market and the major EU stock markets can be assessed by investigating measures of the co-movement of stock prices in these countries. If the stock markets are integrated, they can be expected to be highly correlated and to share a common stochastic trend. Hence, the benefits of international diversification would be small if stock prices in these markets are co-integrated. Prior to testing for co-integration of any set of prices, we need first examine the series on non-stationary and determine the order of integration of the prices and ensure that it is equal for all series. The non-stationary series is the primary condition for performing a co-integration test (Hill et al, 2001; 346). Augmented Dickey and Fuller (ADF) (1981) and Phillips and
The Integration of the Istanbul Stock Exchange (ISE) to the European Union Countries Stock Markets
5
Perron (PP) (1989) unit root tests are used to test for the non-stationary of the series. Since the null hypothesis in ADF test is that a time series contains a unit root, this hypothesis is accepted unless there is a strong evidence against it.
The ADF test is expressed in the following formula:
t j t p j j t t
b
b
Y
Y
Y
=
+
θ
∆
+
ε
∆
− = − +∑
1 1 1 0Where ∆Yt is the first difference of the series yt.
Phillips and Perron (1988) propose an alternative (nonparametric) method of controlling for serial correlation when testing for a unit root (Dutta, Ahmed, 1997; 466). The PP estimates the non-augmented DF test equation and modifies the ratio of a coefficient so that serial correlation does not affect the asymptotic distribution of the test statistic. Next we examine whether the national stock market index series are integrated, namely, whether the Turkish stock market index is co-integrated with the EU stock market indices. For that we run Engle-Granger co-integration test.
We estimate the following co-integration regression: yt = β0 + β1xt + εt
where yt is the Turkish stock market index, xt is the foreign stock market index. In integration test, the null hypothesis is no co-integration against the alternative of co-co-integration.
Co-integration is the property of two non-stationary time series and implies a long-term equilibrium relationship between the two variables. The notion of co-integration can be expressed as follows. If the times series Xt and Yt are both non-stationary in levels (prices), but the first differences of the variables (returns) are stationary, it is both variables are integrated of order one, I(1). The linear combination are also I(1). However, if there is a linear combination of Xt and Yt that is stationary, it is said the two variables are co-integrated. If the two variables are co-integrated, then there is some underlying long-term relationship between both (Arbelaez et al., 2001; 245).
Then we examine whether the integration between the stock markets increased or decreased after the passage to the CU. For that we introduce a dummy variable and assess this formula:
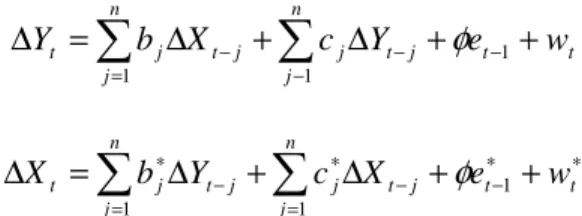
Finally, the next step involves the estimation of the ECM. If two variables, i.e., stock price indices, are co-integrated, the following ECMs are tested: t t j t n j j n j j t j t
b
X
c
Y
e
w
Y
=
∆
+
∆
+
+
∆
− − − = −∑
∑
1 1 1φ
∗ ∗ − − = ∗ − = ∗+
+
∆
+
∆
=
∆
∑
∑
t j t t n j j j t n j j tb
Y
c
X
e
w
X
1 1 1φ
where et-1 and e*t-1 are the lagged residuals from Equations.
The ECM reflects deviations from the long-run co-integration relationship. Therefore, the coefficients of the ECM represent the speed of adjustment to deviations from the long-run equilibrium. Higher values of those coefficients can be interpreted as a higher degree of stock market integration (Pascual, 2003; 198).
Going on, the ECM shows the long run dynamics of the adjustment process between two national indices. The significance and size of the error-correction terms essentially captures the single-period response of the dependent variable to departures from equilibrium.
According to Engle and Granger (1987), an individual economic variable, viewed as a times series, can wander extensively and yet some pairs of series may be expected to move so that they do not drift too far apart. Typically economic theory will propose forces which tend to keep such series together. A similar idea arises from considering equilibrium relationships, where equilibrium is a stationary point characterized by forces which tend to push the economy back toward equilibrium whenever it moves away.
A class of models, known as the error-correcting, allows long-run components of variables to obey equilibrium constraints while short-run components have a flexible dynamic specification.
EMPIRICAL FINDINGS
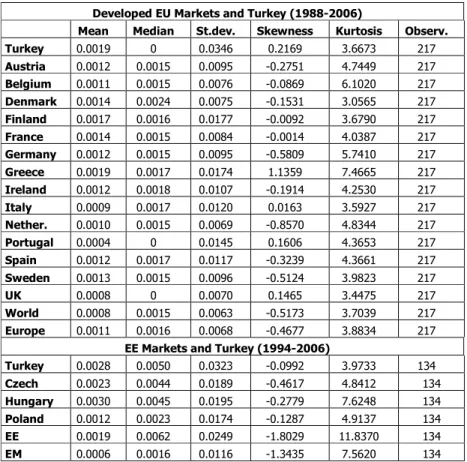
Table 4.1 reports descriptive statistics of returns for the fifteen EU stock market indices studied as well as of the world and the European indices for the 1988-2006 period and three EE indices with the Turkish ones for the 1994-2006 period, as well as the EE and emerging market indices.
The Integration of the Istanbul Stock Exchange (ISE) to the European Union Countries Stock Markets
7
Table 1: Descriptive Statistics of Returns
Developed EU Markets and Turkey (1988-2006)
Mean Median St.dev. Skewness Kurtosis Observ. Turkey 0.0019 0 0.0346 0.2169 3.6673 217 Austria 0.0012 0.0015 0.0095 -0.2751 4.7449 217 Belgium 0.0011 0.0015 0.0076 -0.0869 6.1020 217 Denmark 0.0014 0.0024 0.0075 -0.1531 3.0565 217 Finland 0.0017 0.0016 0.0177 -0.0092 3.6790 217 France 0.0014 0.0015 0.0084 -0.0014 4.0387 217 Germany 0.0012 0.0015 0.0095 -0.5809 5.7410 217 Greece 0.0019 0.0017 0.0174 1.1359 7.4665 217 Ireland 0.0012 0.0018 0.0107 -0.1914 4.2530 217 Italy 0.0009 0.0017 0.0120 0.0163 3.5927 217 Nether. 0.0010 0.0015 0.0069 -0.8570 4.8344 217 Portugal 0.0004 0 0.0145 0.1606 4.3653 217 Spain 0.0012 0.0017 0.0117 -0.3239 4.3661 217 Sweden 0.0013 0.0015 0.0096 -0.5124 3.9823 217 UK 0.0008 0 0.0070 0.1465 3.4475 217 World 0.0008 0.0015 0.0063 -0.5173 3.7039 217 Europe 0.0011 0.0016 0.0068 -0.4677 3.8834 217
EE Markets and Turkey (1994-2006)
Turkey 0.0028 0.0050 0.0323 -0.0992 3.9733 134 Czech 0.0023 0.0044 0.0189 -0.4617 4.8412 134 Hungary 0.0030 0.0045 0.0195 -0.2779 7.6248 134 Poland 0.0012 0.0023 0.0174 -0.1287 4.9137 134 EE 0.0019 0.0062 0.0249 -1.8029 11.8370 134 EM 0.0006 0.0016 0.0116 -1.3435 7.5620 134
It can be seen from Table 1 that the Turkish stock price indices show the highest average returns together with the Greek ones (0.19%) but the highest standard deviation (3.46). We can also see that the mean returns are highest for the Hungarian market (0.30), the Turkish one goes second with 0.28, the standard deviation is again higher for Turkey for the 1994-2006 period among the EE countries.Table 4.2 presents a simple return correlation matrix involving correlation coefficients for pairs of stock prices. The significance of the correlation coefficients for each potential pair of share price indices provides a preliminary indication about the strength of association of share price movements.
The Table 2 indicates that all correlation coefficients are positive. We can see the highest correlation of Turkey being with the Greek index (0.36), the lowest with the Belgian one (0.13). Correlations with Turkey are generally the lowest. However, return correlations are high between the EU member countries. Correlations are significant at the 0.01 level.
Correlations among the EE and Turkish stock returns are presented in Table 3. We see that for the period 1994-2006 the correlations are also positive and higher than among the developed markets of the EU. The Table 3 shows that the correlation with the emerging market index is the highest being 0.54, the lowest correlation is with the Czech returns being 0.31. The correlations are also significant at the 0.01 level.
Table 3: Pearson Correlation of EE Markets and Turkey (1994-2006)
Turkey Czech Hungary Poland EE EM
Turkey 1 .31 .45 .37 .51 .54 Czech .31 1 .59 .55 .69 .51 Hungary .45 .59 1 .68 .71 .61 Poland .36 .55 .68 1 .69 .65 EE .51 .69 .71 .69 1 .78 EM .54 .51 .61 .65 .78 1
All correlations are significant at the 0.01 level (2-tailed).
Before performing a co-integration test we need first examine the series on non-stationary. (Here on we will use natural logarithms of index prices for our analysis of co-integration). The non-stationary series is the primary condition for performing a co-integration test. For that we run ADF and PP unit root tests. Ho hypothesis of the ADF and PP tests is non-stationary; consequently we accept it unless there is a strong evidence against it.
The results of the ADF tests are presented, respectively, in Table 4 for the developed and Table 5 for emerging markets, i.e., EE markets of the EU. The appropriate lag order for the ADF tests were chosen based on Akaike Information Criterion (AIC) according to which the lowest values of the AIC were selected. Lag order for the PP test was set to 4.
T h e I n te g ra ti o n o f th e I s ta n b u l S to c k E x c h a n g e ( IS E ) to t h e E u ro p e a n U n io n C o u n tr ie s S to c k M a rk e ts 9 T a b le 2 : P e a rs o n C o rr e la ti o n o f D e v e lo p e d EU M a rk e ts a n d T u rk e y ( 1 9 8 8 -2 0 0 6 ) Eur wrl Uk Sw Spa Por Net Ita Ire Gre Ger Fra Fin De Bel Aus Tur .28 .27 .21 35 .22 .32 .26 .22 25 .36 .29 .26 .23 .19 .13 .27 1 Tur .58 .41 .47 .36 44 .46 .53 .40 .46 .40 .57 .46 .24 .43 .46 1 .27 Aus .74 .64 .58 .46 .54 .48 .74 .47 .55 .40 .72 .75 .26 .58 1 .46 .13 Bel .70 .61 .59 .58 .57 .47 .64 .51 .56 .29 .66 .60 .37 1 .58 .43 .19 De .54 .56 .46 .62 .47 .32 .44 .46 .41 .21 .45 .40 1 .37 .26 .24 .23 Fin .86 .75 .65 .66 .67 .51 .77 .53 .57 .41 .81 1 .40 .60 .75 .46 .26 Fra .87 .72 .64 .71 .64 .51 .82 .58 .61 .41 1 .81 .47 .66 .72 .57 .29 Ger .41 .33 .28 .36 .43 .50 .36 .36 .37 1 .41 .41 .21 .29 .40 .40 .36 Gre .72 .68 .69 .56 .61 .50 .66 .42 1 .37 .61 .57 .41 .56 .55 .46 .25 Ire .63 .55 .44 .55 .60 .44 .54 1 .42 .36 .58 .53 .46 .51 .47 .40 .22 Ita .90 .79 .76 .67 .65 .57 1 .54 .66 .36 .82 .77 .44 .64 .74 .53 .26 Net .61 .51 .47 .53 .62 1 .57 .44 .50 .50 .51 .51 .32 .47 .48 .46 .32 Por .78 .72 .64 .71 1 .62 .65 .60 .61 .43 .64 .66 .47 .57 .54 .44 .22 Spa .78 .75 .63 1 .71 .53 .67 .55 .56 .36 .71 .66 .62 .58 .46 .36 .35 Sw .88 .80 1 .63 .64 .47 .76 .44 .69 .28 .64 .65 .46 .59 .58 .47 .21 Uk 0.88 1 .80 .75 .72 .51 .79 .55 68 .33 .72 .75 .56 .61 .64 .41 .27 Wrl
All correlations are significant at the 0.01 level (2-tailed).
1 .88 .88 .78 .78 .61 .90 .63 .72 .41 .87 .86 .54 .70 .74 .58 .28 Eur
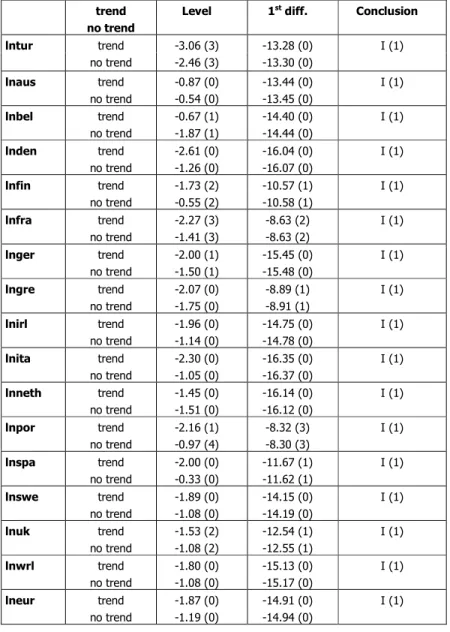
Table 4: ADF Results for Developed EU Markets and Turkey
trend no trend
Level 1st diff. Conclusion
lntur trend no trend -3.06 (3) -2.46 (3) -13.28 (0) -13.30 (0) I (1) lnaus trend no trend -0.87 (0) -0.54 (0) -13.44 (0) -13.45 (0) I (1) lnbel trend no trend -0.67 (1) -1.87 (1) -14.40 (0) -14.44 (0) I (1) lnden trend no trend -2.61 (0) -1.26 (0) -16.04 (0) -16.07 (0) I (1) lnfin trend no trend -1.73 (2) -0.55 (2) -10.57 (1) -10.58 (1) I (1) lnfra trend no trend -2.27 (3) -1.41 (3) -8.63 (2) -8.63 (2) I (1) lnger trend no trend -2.00 (1) -1.50 (1) -15.45 (0) -15.48 (0) I (1) lngre trend no trend -2.07 (0) -1.75 (0) -8.89 (1) -8.91 (1) I (1) lnirl trend no trend -1.96 (0) -1.14 (0) -14.75 (0) -14.78 (0) I (1) lnita trend no trend -2.30 (0) -1.05 (0) -16.35 (0) -16.37 (0) I (1) lnneth trend no trend -1.45 (0) -1.51 (0) -16.14 (0) -16.12 (0) I (1) lnpor trend no trend -2.16 (1) -0.97 (4) -8.32 (3) -8.30 (3) I (1) lnspa trend no trend -2.00 (0) -0.33 (0) -11.67 (1) -11.62 (1) I (1) lnswe trend no trend -1.89 (0) -1.08 (0) -14.15 (0) -14.19 (0) I (1) lnuk trend no trend -1.53 (2) -1.08 (2) -12.54 (1) -12.55 (1) I (1) lnwrl trend no trend -1.80 (0) -1.08 (0) -15.13 (0) -15.17 (0) I (1) lneur trend no trend -1.87 (0) -1.19 (0) -14.91 (0) -14.94 (0) I (1)
The Integration of the Istanbul Stock Exchange (ISE) to the European Union Countries Stock Markets
11 Table 5: ADF Results for EE Markets
trend no trend
Level 1st diff. Conclusion
Lncze trend no trend -0.81 (0) 1.11 (0) -7.71 (3) -11.37 (0) I (1) Lnhun trend no trend -1.40 (2) -0.80 (2) -9.95 (1) -9.99 (1) I (1) Lnpol trend no trend -0.64 (4) -0.40 (4) -4.25 (3) -6.50 (3) I (1) Lnee trend no trend -1.08 (0) -0.23 (1) -11.18 (0) -11.05 (0) I (1) Lnem trend no trend -0.83 (1) -0.87 (1) -10.55 (0) -10.43 (0) I (1) Figures in parentheses are lag orders
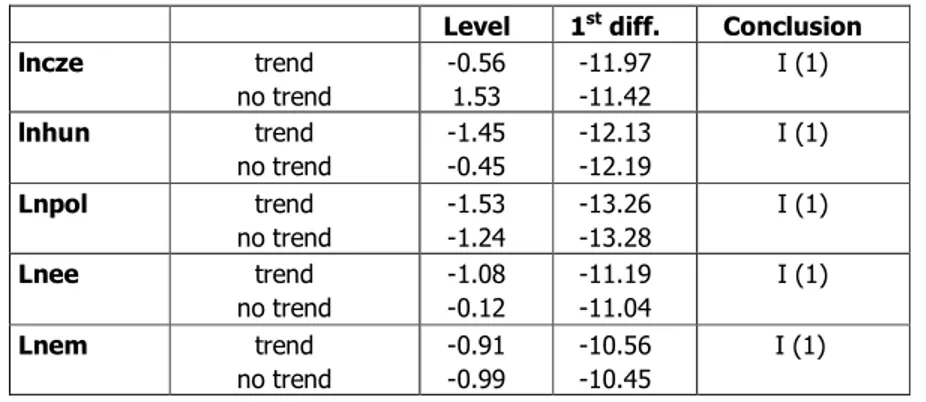
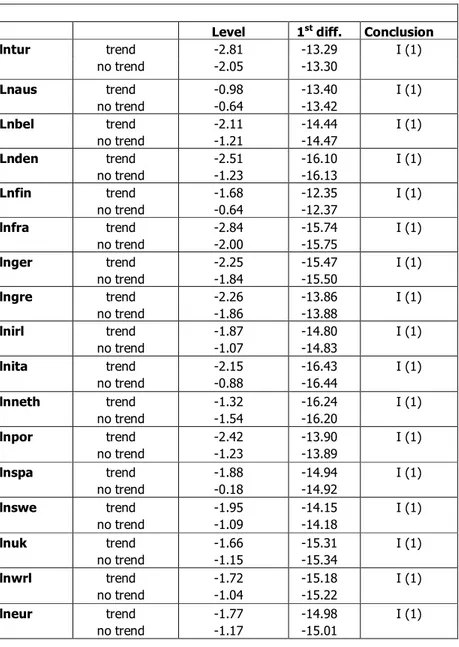
The PP results are presented in Table 6 for developed EU markets and Table 7 for the EE markets. For the PP test the lag order was set to 4. Both ADF and PP tests were performed for both “with trend and without trend” options.
Critical values for ADF and PP tests are for ‘with trend’ 4.00, -3.43, -3.14 for 1%, 5%, and 10%, respectively, for ‘without trend’ they are - 3.46, -2.87, - 2.57. We can see that we can’t reject Ho hypotheses for both ADF and PP tests in levels: t-statistics are less in absolute value than 1% critical value, but we can reject H1 in the 1st differences: t-statistics are greater than 1% critical value. So, we conclude that the series are integrated of order 1, I (1). It means that all the series are non-stationary and stationary only in their first differences.
Table 7: PP Results for EE Markets
Level 1st diff. Conclusion
lncze trend no trend -0.56 1.53 -11.97 -11.42 I (1) lnhun trend no trend -1.45 -0.45 -12.13 -12.19 I (1) Lnpol trend no trend -1.53 -1.24 -13.26 -13.28 I (1) Lnee trend no trend -1.08 -0.12 -11.19 -11.04 I (1) Lnem trend no trend -0.91 -0.99 -10.56 -10.45 I (1) Lag order is set to 4
Table 6: PP Results for Developed EU Markets and Turkey
Level 1st diff. Conclusion
lntur trend no trend -2.81 -2.05 -13.29 -13.30 I (1) Lnaus trend no trend -0.98 -0.64 -13.40 -13.42 I (1) Lnbel trend no trend -2.11 -1.21 -14.44 -14.47 I (1) Lnden trend no trend -2.51 -1.23 -16.10 -16.13 I (1) Lnfin trend no trend -1.68 -0.64 -12.35 -12.37 I (1) lnfra trend no trend -2.84 -2.00 -15.74 -15.75 I (1) lnger trend no trend -2.25 -1.84 -15.47 -15.50 I (1) lngre trend no trend -2.26 -1.86 -13.86 -13.88 I (1) lnirl trend no trend -1.87 -1.07 -14.80 -14.83 I (1) lnita trend no trend -2.15 -0.88 -16.43 -16.44 I (1) lnneth trend no trend -1.32 -1.54 -16.24 -16.20 I (1) lnpor trend no trend -2.42 -1.23 -13.90 -13.89 I (1) lnspa trend no trend -1.88 -0.18 -14.94 -14.92 I (1) lnswe trend no trend -1.95 -1.09 -14.15 -14.18 I (1) lnuk trend no trend -1.66 -1.15 -15.31 -15.34 I (1) lnwrl trend no trend -1.72 -1.04 -15.18 -15.22 I (1) lneur trend no trend -1.77 -1.17 -14.98 -15.01 I (1) Lag order is set to 4
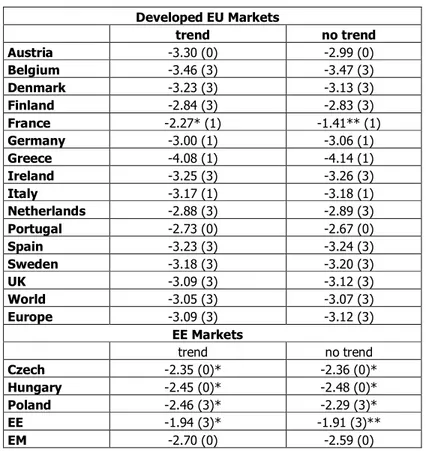
After we have proved the series to be non-stationary, we can pass to the test of integration. The results of Engle and Granger co-integration test for both developed EU markets and EE markets are shown in Table 8. The lag orders were chosen according to the AIC. Turkey is the dependent variable. Critical values for the Engle and
The Integration of the Istanbul Stock Exchange (ISE) to the European Union Countries Stock Markets
13
Granger cointegration test for 1%, 5%, and 10% critical values are -2,5899, -1,9439, -1,6177, respectively (Gujarati, 1995). The null hypothesis for the Engle and Granger test is no co-integration, the alternative hypothesis is there is co-integration. The results indicate the t-values of the test to be higher of the critical values indicated above. We can say that the results are significant at 1% critical value, except that of France: its t-value for “trend” is significant at 5% critical value, “no trend” is significant at 10% critical value. So, we reject the null hypothesis of no co-integration and conclude the ISE to be co-integrated with the major EU stock markets. This indicates limited diversification benefits for the EU investors.
Table 8:Engle-Granger Results
Developed EU Markets trend no trend Austria -3.30 (0) -2.99 (0) Belgium -3.46 (3) -3.47 (3) Denmark -3.23 (3) -3.13 (3) Finland -2.84 (3) -2.83 (3) France -2.27* (1) -1.41** (1) Germany -3.00 (1) -3.06 (1) Greece -4.08 (1) -4.14 (1) Ireland -3.25 (3) -3.26 (3) Italy -3.17 (1) -3.18 (1) Netherlands -2.88 (3) -2.89 (3) Portugal -2.73 (0) -2.67 (0) Spain -3.23 (3) -3.24 (3) Sweden -3.18 (3) -3.20 (3) UK -3.09 (3) -3.12 (3) World -3.05 (3) -3.07 (3) Europe -3.09 (3) -3.12 (3) EE Markets trend no trend Czech -2.35 (0)* -2.36 (0)* Hungary -2.45 (0)* -2.48 (0)* Poland -2.46 (3)* -2.29 (3)* EE -1.94 (3)* -1.91 (3)** EM -2.70 (0) -2.59 (0)
Figures in parentheses are lag orders
*significant at 5%, ** significant at 10%, all the rest are sig. at 1% Engle-Granger critical values: 1% -2,5899; 5% -1,9439; 10% -1,6177
We are also interested whether the integration between the Turkish stock market and the EU stock markets increased or decreased
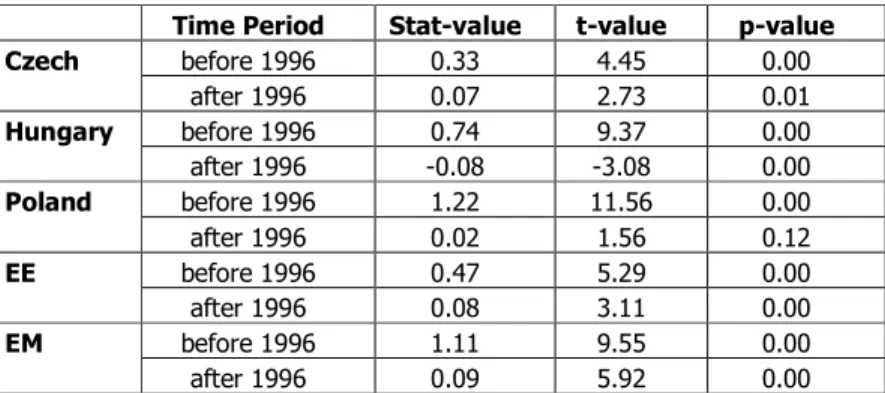
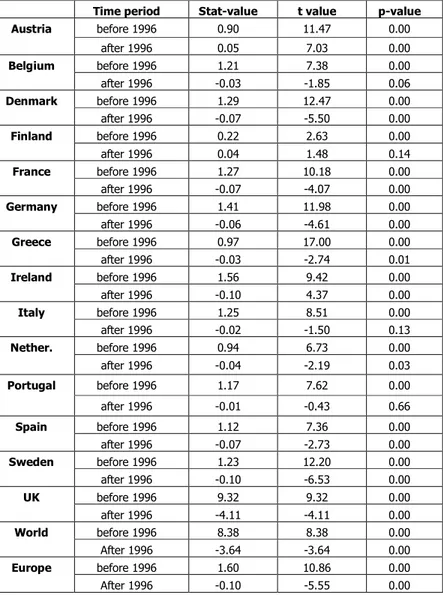
after the passage to the CU in 1996. In order to examine this, a dummy variable is introduced. Using a dummy variable is the easiest way to test co-integration with a structural break. The results of the Engle and Granger with the dummy variable are presented in Table 9 for developed EU and Table 10 for the EE markets, respectively. We see that only the integration of the Turkish stock market with the Austrian stock market after the passage to the CU in 1996 increased by 0.05 percent, the integration with the other markets decreased. Integration with Finland also shows a positive result but it is insignificant. Integration with the EE markets increased except the Hungarian market which decreased. The increasing integration with the Polish market is insignificant.
Table 10: Engle and Granger Results with a Structural Break for EE Markets
Time Period Stat-value t-value p-value
before 1996 0.33 4.45 0.00 Czech after 1996 0.07 2.73 0.01 before 1996 0.74 9.37 0.00 Hungary after 1996 -0.08 -3.08 0.00 before 1996 1.22 11.56 0.00 Poland after 1996 0.02 1.56 0.12 before 1996 0.47 5.29 0.00 EE after 1996 0.08 3.11 0.00 before 1996 1.11 9.55 0.00 EM after 1996 0.09 5.92 0.00
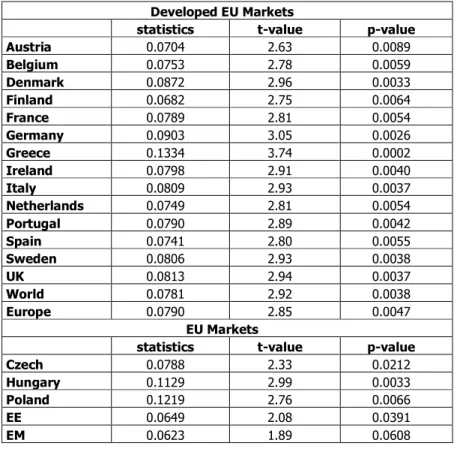
We found the existence of long-run relationships between the Turkish stock market and the EU stock markets. As in short-run there can be some departures from a common co-movement, we are interested what percent of them are corrected each month. The results of the ECM are presented in Table 11.
Analyzing the results for the developed markets, we see that in average 7 % of disequilibrium is corrected each month, the highest being that of the Greek market, 13%, indicating that the ISE has a high degree of stock market integration with this market. As for the EE markets, average 8% of disequilibrium is corrected each month, the highest being of the Polish market, 12%, implying that the integration with the Polish market is high.
The Integration of the Istanbul Stock Exchange (ISE) to the European Union Countries Stock Markets
15
Table 9: Engle and Granger Results with a Structural Break for Developed EU Markets
Time period Stat-value t value p-value before 1996 0.90 11.47 0.00 Austria after 1996 0.05 7.03 0.00 before 1996 1.21 7.38 0.00 Belgium after 1996 -0.03 -1.85 0.06 before 1996 1.29 12.47 0.00 Denmark after 1996 -0.07 -5.50 0.00 before 1996 0.22 2.63 0.00 Finland after 1996 0.04 1.48 0.14 before 1996 1.27 10.18 0.00 France after 1996 -0.07 -4.07 0.00 before 1996 1.41 11.98 0.00 Germany after 1996 -0.06 -4.61 0.00 before 1996 0.97 17.00 0.00 Greece after 1996 -0.03 -2.74 0.01 before 1996 1.56 9.42 0.00 Ireland after 1996 -0.10 4.37 0.00 before 1996 1.25 8.51 0.00 Italy after 1996 -0.02 -1.50 0.13 before 1996 0.94 6.73 0.00 Nether. after 1996 -0.04 -2.19 0.03 before 1996 1.17 7.62 0.00 Portugal after 1996 -0.01 -0.43 0.66 before 1996 1.12 7.36 0.00 Spain after 1996 -0.07 -2.73 0.00 before 1996 1.23 12.20 0.00 Sweden after 1996 -0.10 -6.53 0.00 before 1996 9.32 9.32 0.00 UK after 1996 -4.11 -4.11 0.00 before 1996 8.38 8.38 0.00 World After 1996 -3.64 -3.64 0.00 before 1996 1.60 10.86 0.00 Europe After 1996 -0.10 -5.55 0.00
Table 11: Error Correction Model (ECM) Results Developed EU Markets
statistics t-value p-value
Austria 0.0704 2.63 0.0089 Belgium 0.0753 2.78 0.0059 Denmark 0.0872 2.96 0.0033 Finland 0.0682 2.75 0.0064 France 0.0789 2.81 0.0054 Germany 0.0903 3.05 0.0026 Greece 0.1334 3.74 0.0002 Ireland 0.0798 2.91 0.0040 Italy 0.0809 2.93 0.0037 Netherlands 0.0749 2.81 0.0054 Portugal 0.0790 2.89 0.0042 Spain 0.0741 2.80 0.0055 Sweden 0.0806 2.93 0.0038 UK 0.0813 2.94 0.0037 World 0.0781 2.92 0.0038 Europe 0.0790 2.85 0.0047 EU Markets
statistics t-value p-value
Czech 0.0788 2.33 0.0212 Hungary 0.1129 2.99 0.0033 Poland 0.1219 2.76 0.0066 EE 0.0649 2.08 0.0391 EM 0.0623 1.89 0.0608 CONCLUSION
The aim of this study is to examine whether the Turkish stock market is integrated with the EU stock markets. In case it is, we conclude that portfolio diversification benefits for the EU investors in the Turkish stock market are limited. The importance of the study is in examining whether the Turkish stock market is integrated or not with the EU markets as a possible candidate for the EU. We divide the sample into developed and emerging markets in order to assess whether the Turkish stock market is integrated more with the developed or with the emerging markets of the European Union, or both. The study contributes to the literature in the aspect that it will have important implications for individual investors, portfolio managers, and financial managers of corporations willing to invest in the Turkish stock market.
In this paper, we use Engle and Granger methodology in order to examine integration between the Turkish equity market and the EU equity markets. Thus, we have conducted the analysis of co-integration of the Istanbul Stock Exchange (ISE) with the EU equity markets. We
The Integration of the Istanbul Stock Exchange (ISE) to the European Union Countries Stock Markets
17
first conducted the descriptive statistics and found that the returns of the ISE are the highest among the developed markets of the EU, but the standard deviation is also highest; among the emerging markets of the EE countries, the returns of the ISE are also high ranking the second after the Hungarian market, the standard deviation is also the highest among the EE markets. As for the correlations between the ISE and EU markets, they are positive and rather high.
Before performing the Engle and Granger co-integration test we first analyzed the series on non-stationary as it is the primary condition for the co-integration analysis. For that we ran ADF and PP tests and proved our index series to be non-stationary. Conducting then the Engle and Granger test we found that the Turkish equity market is co-integrated with the EU equity markets, both the developed and the developing ones. Obtaining these results we concluded that for the EU investors diversification strategies are limited in the Turkish market. The Engle and Granger test with a structural break showed that only integration with the Austrian market and the EE markets, except the Hungarian and Polish ones, increased after the passage of Turkey to the Customs Union in 1996. The ECM results for the developed markets indicated that in average 7 % of disequilibrium is corrected each month, the highest being of the Greek market, 13%. As for the Eastern European markets, average 8% of disequilibrium is corrected each month, the highest being of the Polish market, 12%. Our findings are not complying with some of the previous studies. The overall conclusion to the study is that the ISE is integrated with most of the EU stock markets.
REFERENCES
Arbelaez, H., Urrutia, J. and Abbas, N. (2001). Short-term and Long Run Linkages Among The Colombian Capital Market Indexes. International Review of Financial Analysis, 10, 237-273.
Berument, H., and Ince, O. (2005). Effect of S&P 500’s Return on Emerging Markets: Turkish Experience. Applied Financial Economics Letters, 1(1), 1-10.
Darrat A., and Benkato O.M. (2003). Interdependence and Volatility Spillovers Under Market Liberalization: the Case of Istanbul Stock Exchange. Journal of Business Finance and Accounting, 30(7), (8), 1089-1114.
Dickey, D. A. and Fuller, W. A. (1979). Distribution of the Estimators for Autoregressive Time Series with a Unit Root. Journal of the American Statistical Association, 74, 427-431.
Dutta, D., and Ahmed, N. (1999). An Aggregate Import Demand Function for Bangladesh: a Co-integration Approach. Applied Economics, 31, 465-472.
Engle, R.F. and Granger, C.W.J. (1987). Cointegration and Error Correction: Representation, Estimation and Testing. Econometrica, 55, 251-276.
Gilmore, C.G. and MacManus, G.M. (2002). International Portfolio Diversification: US and Central European equity markets. Emerging Markets Review, 3, 69-83.
Gregory, A. W. and Hansen, B. E. (1996). Residual-Based Tests for Cointegration in The Models With Regime Shifts. Journal of Econometrics, 70, 99-126.
Gujarati, D.N. (1995). Basic Econometrics. McGraw-Hill: USA.
Hill, P.C., Griffits, W.E., and Judge, G.G. (2001). Undergarduate Econometrics: Addison-Wesley.
Johansen, S. (1988). Statistical Analysis of Cointegrated Vectors. Journal of Economic Dynamics and Control, 12, 231-254.
Kasman, S.K., and Kasman, A. (2005). Long-term Price Linkages between the Equity Market of Turkey and its Major Trading Partners in Europe. First International Conference on Business, Management and Economics in a Changing World, Yaşar University, 16-19 June 2005: Çeşme, İZMİR.
Lagoarde-Segot, T., & Lucey, B. M. (2005). Long-run Equity Market Linkages in the Middle East and North Africa: in Search for
Diversification Benefits.
Access:02.02.2006,WWW:Web:http://www.fma.org/Siena/Papers/ 720414.pdf
Linne, T. (1998). The Integration of the Central and Eastern European Equity Markets into the International Capital Markets: A Co-integration Analysis. Working Paper.
Pascual, A.G. (2003). Assessing European Stock Market Co(integration). Economic Letters, 78, 197-203.
Phillips, P. C., and Perron, P. P. (1988). Testing for a Unit Root in Times Series Regression. Biomertrica, 75, 335-346.
Syriopoulos, T., (2005). Dynamic Linkages between Emerging European and Developed Stock Markets: Has the EMU any impact? International Review of Financial Analysis, Vol: 16, Issue: 1,pp:41-60.
Voronkova, S. (2004). Equity Market Integration in Central European Emerging Markets: a Co-integration Analysis with Shifting Regimes. International Review of Financial Analysis, 13, 633-647.