Behavioral/Systems/Cognitive
Border Ownership Selectivity in Human Early Visual Cortex
and its Modulation by Attention
Fang Fang,
1Huseyin Boyaci,
2and Daniel Kersten
31Department of Psychology and Key Laboratory of Machine Perception (Ministry of Education), Peking University, Beijing 100871, China,2Department of Psychology, Bilkent University, Ankara 06800, Turkey, and3Department of Psychology, University of Minnesota, Minneapolis, Minnesota 55455
Natural images are usually cluttered because objects occlude one another. A critical aspect of recognizing these visual objects is to identify
the borders between image regions that belong to different objects. However, the neural coding of border ownership in human visual
cortex is largely unknown. In this study, we designed two simple but compelling stimuli in which a slight change of contextual information
could induce a dramatic change of border ownership. Using functional MRI adaptation, we found that border ownership selectivity in V2
was robust and reliable across subjects, and it was largely dependent on attention. Our study provides the first human evidence that V2 is
a critical area for the processing of border ownership and that this processing depends on the modulation from higher-level cortical areas.
Key words: visual cortex; fMRI; vision; figure– ground segregation; attention; border ownership
Introduction
Border ownership is a term for the phenomenon that a visual
border between two image regions is normally perceived to
be-long to only one of the regions. Border ownership assignment
determines the figure– ground organization in a visual image and
it is a critical aspect of object recognition (Nakayama et al., 1989;
Driver and Baylis, 1996). Primate electrophysiological studies
(Zhou et al., 2000; Qiu and von der Heydt, 2005) have shown that
neurons in the early visual cortex encode the side to which a
border belongs. Human functional imaging studies (Kourtzi and
Kanwisher, 2001; Andrews et al., 2002) have demonstrated that
higher-level visual areas lateral occipital complex (LOC) and
fusiform face area (FFA) are sensitive to a change of border
own-ership, but to date have provided no evidence regarding border
ownership selectivity in human early visual cortex.
We designed our stimuli (see Fig. 1 A) by modifying a bright/
dark square-wave radial grating annulus. In the stimuli, either the
bright or dark stripes (sectors of a disk) are slightly longer in the
radial direction, both inward and outward. This provides
contex-tual information that causes the borders between the bright and
the dark stripes to appear to belong either to the bright stripes or
the dark stripes, respectively. Although the image difference (the
contextual information) between the two stimuli is very small, it
dramatically changes the border ownership of locally identical
edges along the edges of the stripes. With these two stimuli, we
attempted to address three specific questions: (1) Are neurons in
human early visual cortical areas selective for border ownership
due to contextual modulation? (2) If so, is there any selectivity
difference between the striate cortex (V1) and extrastriate cortical
areas (e.g., V2)? (3) What is the role of attention in the processing
of border ownership?
Since the border ownership selective neurons, if any, are very
likely to mix with each other below functional MRI (fMRI)
spa-tial resolution, we used fMRI adaptation to overcome this
diffi-culty. fMRI adaptation has been demonstrated to provide insight
into the functional properties of subpopulations of neurons
within an imaging voxel (Fang et al., 2005; Krekelberg et al.,
2006). To address the third question, we used two distinct
atten-tional tasks to examine how manipulating attention modulates
the border ownership selectivity of early cortical areas. Subjects
were asked to attend to either the stimulus or a fixation point.
Materials and Methods
Subjects. Four subjects (3 male and 1 female) participated in all the
ex-periments. All of them were right-handed, reported normal or corrected-to-normal vision, and had no known neurological or visual disorders. Ages ranged from 26 to 36. They gave written, informed consent in accordance with procedures and protocols approved by the human sub-jects review committee of the University of Minnesota.
Stimuli and designs. The two stimuli (Fig. 1 A) used in the main
exper-iment were generated by modifying a square-wave radial grating with 18 cycles per revolution and Michelson contrast of 0.8. The inner and outer radii of the grating were 1.21° and 7.46° respectively. In one stimulus, the bright stripes were slightly elongated in the radial direction both inward and outward by 0.35°. This provided contextual information that caused the borders between the bright and the dark stripes to appear to belong to the bright stripes. In the other stimulus, the dark stripes were elongated in the radial direction both inward and outward by 0.35°, which caused the borders to appear to belong to the dark stripes.
For the stimuli used in the control experiment (Fig. 1 B), the areas between 1.21° and 3.69° eccentricity and between 4.71° and 7.46° eccen-tricity were filled with a mean luminance of 120 cd/m2. The other parts were the same as those in the stimuli used in the main experiment. So the
Received Sept. 26, 2008; revised Dec. 5, 2008; accepted Dec. 8, 2008.
This work was supported by National Institutes of Health Grant EY015261 and the National Natural Science Foundation of China (Project 30870762). The 3T scanner at the University of Minnesota, Center for Magnetic Reso-nance Research, was supported by National Center for Research Resources P41 008079 and P30 NS057091 and by the MIND Institute.
Correspondence should be addressed to Fang Fang, Department of Psychology and Key Laboratory of Machine Perception (Ministry of Education), Peking University, Beijing 100871, China. E-mail: [email protected].
DOI:10.1523/JNEUROSCI.4628-08.2009
image difference between the stimulus pair in the control experiment was the same as that in the main experiment. The checkered ring stim-ulus (Fig. 1C) used to define the regions of in-terest (ROI) in V1 and V2 had the same size as the rings in the stimuli used in the control ex-periment, with inner and outer radii of 3.69° and 4.71°, respectively.
The main experiment consisted of an stimulus condition and an attend-to-fixation condition. Each 410 s adaptation scan (six in one session for the attend-to-stimulus condition and six in another session for the attend-to-fixation condition) consisted of 54 continuous trials and began with 30 s preadap-tation (Fig. 1 D). There were three types of tri-als: same, different and blank trials. In the same and different trials, after a 4 s topping-up adap-tation and 1 s blank interval, a test stimulus was presented for 1 s, followed by a 1 s blank inter-val. In the blank trials, a 4 s topping-up adapta-tion was followed by 3 s blank interval. One of the two stimuli in Figure 1 A was used as adapt-ing stimulus in three scans and the other was used in the other three scans. Both stimuli were used as test stimuli in all six scans. In the same trials, the adapting stimulus was the same as the test stimulus. In the different trials, the adapt-ing stimulus was different from the test stimu-lus. Although the stimuli in the stimulus condition and in the attend-to-fixation condition were the same, subjects performed different tasks. In the attend-to-stimulus condition, they were asked to passively view the adapting stimulus and to identify the test stimulus as one of the two stimuli as quickly as possible by pressing one of two buttons. In the attend-to-fixation condition, the subjects performed a very demanding fixation task in which they needed to press one of two buttons to indicate the 200 ms luminance change (in-crease or de(in-crease) of the fixation point as quickly as possible. The luminance changes oc-curred randomly and approximately every 1–1.2 s across the whole scan. Subjects reported having little awareness of the peripheral stimu-lus while performing this task. For the control experiment, the experimental procedure was the same as that in the attend-to-stimulus con-dition except the stimuli (Fig. 1 B). To avoid retinal adaptation and the formation of after-image, all the test and adapting stimuli rotated back and forth within a range of⫾5° at a speed of 2.5°/s.
For all of these event-related experiments, there were a total of 18⫻ 6 trials, 108 for each type of trial. The order of the three types of trials (same, different and blank) was counterbal-anced across 6 adaptation scans using M-sequences (Buracas and Boynton, 2002). These are pseudo-random sequences which have the advantage of being perfectly counter-balanced n trials back, so that each type of trial was preceded and followed equally often by all types of trials, including itself.
Retinotopic visual areas were defined by a standard phase-encoded method developed by Sereno et al. (1995) and Engel et al. (1997), in which subjects viewed rotating wedge and ex-Figure 1. Stimuli and designs. A, Stimuli used in the main experiment. The interior part of the stimuli was locally identical
across the two stimuli, but as a consequence of the difference in the contextual information, the borders between the bright and the dark stripes were perceived to belong to either the bright or the dark stripes. B, Stimuli used in the control experiment. The image difference between the stimulus pair in the control experiment was the same as that in the main experiment, but the borders between the bright and the dark stripes do not have a clear ownership. C, ROI definition. The checkered ring in the left panel was used to define ROIs in V1 and V2. The transparent gray ring in the right panel shows the size of the checkered ring relative to the stimulus in the main experiment. D, Schematic description of the experimental procedure. The example here illustrates three trial types: same, different and blank.
panding ring stimuli that create traveling waves of neural activity in visual cortex. A block-design scan was used to define the ROI in V1 and V2. The scan consisted of five 15 s stimulus blocks interleaved with five 15 s blank intervals. In a stimulus block, subjects passively viewed a 5 Hz counterphase-flickering checkered ring (Fig. 1C).
MRI data acquisition. In the scanner, the
stim-uli were back-projected via a video projector (60 Hz) onto a translucent screen placed inside the scanner bore. Subjects viewed the stimuli through a mirror located above their eyes. The viewing dis-tance was 92 cm. MRI data were collected using a 3T Siemens Trio scanner with an eight-channel phase-array coil. Blood oxygen level-dependent (BOLD) signals were measured with an echo-planar imaging sequence (echo time: 30 ms, rep-etition time: 1000 ms, field of view: 22⫻ 22 cm2, matrix: 64⫻ 64, flip angle: 60, slice thickness: 3 mm, gap: 0 mm, number of slices: 14, slice orien-tation: axial). The fMRI slices covered the occipi-tal lobe. A high-resolution 3D structural data set (3D MPRAGE; 1⫻ 1 ⫻1 mm3resolution) was collected in the same session before the functional scans. All four subjects participated in four fMRI sessions for the retinotopic mapping, the attend-to-fixation condition, the attend-to-stimulus condition and the control experiment, respectively.
MRI data processing and analysis. The
ana-tomical volume for each subject in the retino-topic mapping session was transformed into the anterior commissure–posterior commissure space. The cortical surface was extracted and then inflated using BrainVoyager QX. Func-tional volumes in all the sessions for each sub-ject were preprocessed which included 3D mo-tion correcmo-tion, linear trend removal, and high-pass (0.015 Hz) (Smith et al., 1999) filtering using BrainVoyager QX. The images were then aligned to the anatomical volume in the retino-topic mapping session and transformed into the AC–PC space. The first 10 s of BOLD signals were discarded to minimize transient magnetic-saturation effects.
A general linear model procedure was used for selecting ROIs. The ROIs in V1 and V2 were de-fined as areas that responded more strongly to the flickering ring than the blank interval ( p⬍ 10⫺4, Bonferroni corrected), and were confined by the V1/V2/V3 boundaries defined by the retinotopic mapping experiment. For three subjects, the fMRI slices covered their posterior intraparietal sulcus (pIPS). Part of this area could be activated by the flicking ring ( p⬍ 10⫺2) and served as a ROI out-side the retinotopic areas.
The event-related BOLD signals were calcu-lated separately for each ROI in each subject and experiment, following the method used by Larsson et al. (2006) and Liu et al. (2007). For each fMRI scan, the time course of MR signal intensity was first extracted by averaging the data across all the voxels within the predefined ROI and then normalized by the mean intensity across the scan. Event-related averages were then performed for each of the three trial types (same, different and blank) by averaging 12 time points starting at the test stimulus. The
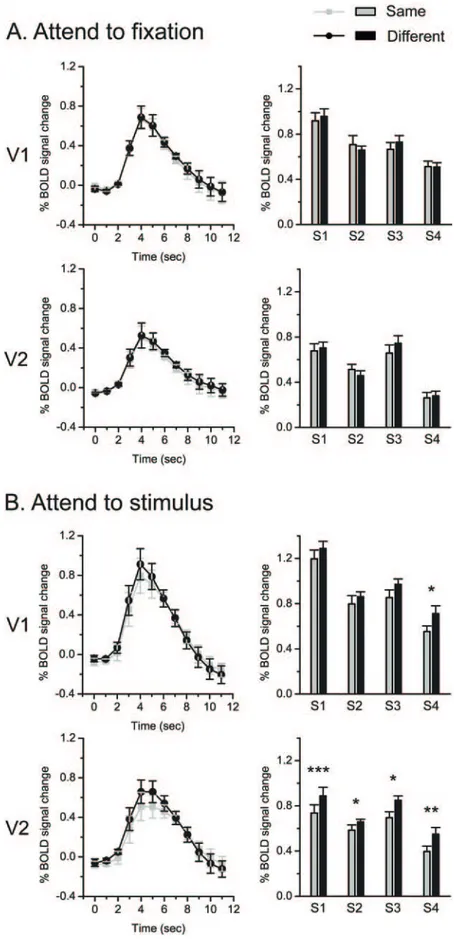
Figure 2. fMRI results in the main experiment. A, Attend-to-fixation condition. B, Attend-to-stimulus condition. For each experimental condition, left column shows the time courses of BOLD signals evoked by test stimuli that were presented at time point 0. The signals were averaged across four subjects in V1 and V2. Error bars denote 1 SEM calculated across subjects at each time point. Right column shows fMRI response amplitudes to test stimuli for individual subjects. Asterisks indicate a statistically significant difference between the fMRI response amplitudes to the same and the different test stimuli (*p⬍ 0.05; **p ⬍ 0.01; ***p⬍ 0.001). Error bars denote 1 SEM calculated across scans for each subject.
average response to the blank trials was subtracted from the averages of the same and different trials to isolate the response to the test stimulus.
The peak fMRI response to the test stimulus was used as a measure of the response amplitude. We also computed an adaptation index IAto quantify how much the measured response changed after adaptation, relative to the overall response to the stimuli in each visual area. The index was calculated as follows: IA⫽(Adifferent⫺Asame)/(Adifferent⫹Asame), where Adifferent is the mean amplitude of the responses to the different test stimulus, and Asameis the mean amplitude of the responses to the same test stimulus. This index could range from⫺1 to 1 and was positive whenever the mean response to the different test stimulus was greater than the mean response to the same test stimulus. A large adaptation index of a ROI means a strong adaptation effect, with the implication of a large proportion of border ownership-selective neurons in that ROI.
Eye movement recording. Eye movements were recorded at 60 Hz with
an iView X RED eye tracker (SensoMotoric Instruments) in a psycho-physics lab when subjects viewed the same stimuli as those in the magnet. Inspection of the eye movement data revealed that all subjects were able to maintain stable fixation throughout the experiment and most of their gaze positions were within 0.5° radius of the fixation point.
Results
Behavioral data
Behavioral data showed that the subjects strictly followed the
instructions. In the attend-to-stimulus condition, their responses
to the test stimuli were both accurate and fast. The correct rates
for both the same and different trials were
⬎97%. The reaction
times (mean
⫾ SEM) were 519 ⫾ 31 ms for the same trials and
517
⫾ 33 ms for the different trials. In the attend-to-fixation
condition, for the same trials and the different trials, the correct
rates (mean
⫾ SEM) of discriminating the luminance change
were 77
⫾ 3% and 75 ⫾ 3% respectively, and the reaction times
(mean
⫾ SEM) were 451 ⫾ 16 ms and 443 ⫾ 19 ms, respectively.
For all these measurements, there was no significant difference
between the two types of trials.
Border ownership adaptation in V1 and V2
fMRI signals were extracted from the ROIs in V1 and V2 and were
selectively averaged according to the trial type. The peak fMRI
response to the test stimulus was used as a measure of the
re-sponse amplitude. We hypothesize that, if a cortical area contains
neurons selective to border ownership, according to the fMRI
adaptation logic, the area should show a higher response to the
test stimulus that is different from the adapting stimulus
(differ-ent trial) than to the test stimulus that is the same as the adapting
stimulus (same trial).
In the attended-to-fixation condition (Fig. 2 A), none of the
four subjects showed a significant adaptation effect, a higher
re-sponse in the different trial than in the same trial, in both V1 and
V2. In the attend-to-stimulus condition (Fig. 2 B), the adaptation
effect in V1 was weak and unreliable. Only one subject (S4)
showed a significant adaptation effect (t
⫽ 3.165, p ⫽ 0.025).
However, the adaptation effect in V2 was strong and consistent
across all the four subjects (S1: t
⫽ 7.212, p ⬍ 0.001; S2: t ⫽ 2.679,
p
⫽ 0.044; S3: t ⫽ 2.891, p ⫽ 0.034; S4: t ⫽ 5.095, p ⫽ 0.004).
These results demonstrate that V2 is a critical area for the
pro-cessing of border ownership and this propro-cessing is largely
depen-dent on attention.
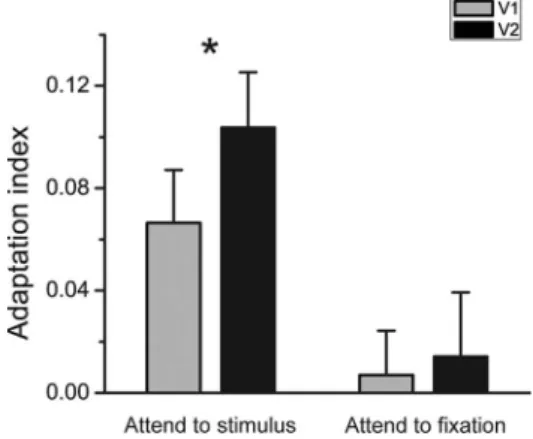
The adaptation index can be used for comparing border
own-ership selectivity between different cortical areas. A large index of
a cortical area means a strong adaptation effect and suggests a
large proportion of border ownership-selective neurons in this
area (Larsson et al., 2006; Ashida et al., 2007; Fang et al., 2007). In
the attend-to-stimulus condition, the adaptation index of V2 was
significantly larger than that of V1 (t
⫽ 4.958, p ⫽ 0.016). The
adaptation index of V1 was significantly larger than zero (t
⫽
3.214, p
⫽ 0.049) although the V1 adaptation effect was not
con-sistently exhibited at the individual subjects level. But in the
attend-to-fixation conditions, the adaptation indices of both V1
and V2 were not significantly larger than zero (no adaptation
effect), and there was no significant difference between V1 and
V2 (Fig. 3). These results further suggest that V2 plays a more
important role than V1 in border ownership processing.
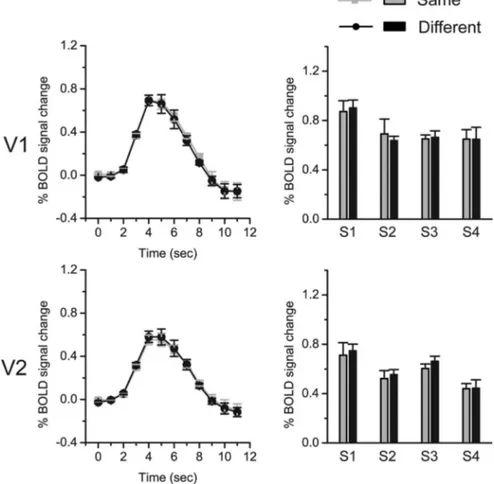
Control experiment
It could be argued that the adaptation effect we found in V2 was
due to the image difference (the contextual information itself)
between the adapting stimulus and the test stimulus, rather than
the perceived border ownership difference. In the main
experi-ment, the separation between the ROI ring and the image regions
that provide the contextual information was at least 2.5° (Fig.
1C), which is much larger than the classical receptive field sizes
(0.5° and 1.5°) of V1 and V2 neurons at the eccentricity of the ring
(Smith et al., 2001). The human population receptive field size
estimates (Dumoulin and Wandell, 2008) also agree well with the
electrophysiological measurements. All the evidence suggests
that the V1 and V2 neurons in the ROIs cannot respond directly
to the distant contextual information and were presumably
driven by locally identical stimuli.
However, Cornelissen et al. (2006) argued that, within V1 and
V2, the fMRI signal from one subregion could be enhanced by a
visual stimulus that stimulated another remote subregion. Thus,
the observed effect in the ROI in V2 could be an artifactual
con-sequence of the contextual change, but not the border ownership
adaptation. We performed the control experiment to rule out this
potential confound. The stimuli used in the control experiment
were modified from the stimuli in the main experiment. Only the
image region providing the contextual information and an
annu-lar interior part of the radial grating having the same size as the
ROI stimulus were kept. Thus, the image difference between the
stimulus pair in the control experiment was the same as that in
the main experiment. But the borders in the annular interior part
of the radial grating did not have a clear ownership. The
experi-mental procedure was the same as the attend-to-stimulus
condi-tion in the main experiment. We did not find any adaptacondi-tion
effect in either V1 or V2: there was no significant difference
be-tween same trials and different trials (Fig. 4).
Figure 3. Adaptation indices of V1 and V2 averaged across four subjects in the attend-to-fixation condition and the attend-to-stimulus condition. Asterisks indicate a statistically signif-icant difference between the adaptation indices of V1 and V2 (*p⬍ 0.05). Error bars denote 1 SEM calculated across subjects.
Discussion
It is well known that spatial attention can
strongly modulate fMRI signals in the visual
cortex, as early as V1 (Tootell et al., 1998;
Brefczynski and DeYoe, 1999). The observed
fMRI signal difference between same trials
and different trials in the main experiment
could have reflected an attentional signal
elicited by the change in the stimulus, rather
than selective adaptation to border
ship. Although we found that border
owner-ship adaptation was dependent on attention,
we have several reasons to argue against that
it is a pure attentional effect. First, there was
no significant difference in the behavioral
data (reaction time and correct rate)
be-tween same trials and different trials. More
attention allocated to the test stimulus in the
different trials could have presumably
re-sulted in a better performance (Posner,
1980). Second, the image difference in the
stimulus pair in the control experiment was
the same as that in the main experiment. If
the fMRI signal difference in the main
exper-iment reflected an attentional signal elicited
by the physical change of the stimulus, we
should have observed a similar signal
differ-ence in the control experiment. But our data
show that this is not the case. Third, for three
subjects, fMRI slices covered their pIPS, one
of the core regions of the dorsal attention
network (Kastner and Ungerleider, 2000;
Corbetta and Shulman, 2002), which is the
putative source of attentional signals to
vi-sual cortex (Moore and Armstrong, 2003).
Although the pIPS showed a robust response
to the presentation of the same and different test stimuli, there was
no difference between them, which suggested that no more attention
was paid to or elicited by the different test stimulus than the same test
stimulus.
Previous human fMRI studies found that some higher-level
vi-sual areas, the LOC and FFA, were sensitive to a change of border
ownership (Kourtzi and Kanwisher, 2001; Andrews et al., 2002).
Baylis and Driver (2001) showed that the inferotermporal (IT)
cor-tex of awake, behaving monkeys contains neurons that were selective
to border ownership. Since monkey IT and human LOC and FFA are
the brain areas critically involved in object and face recognition, the
border ownership selectivity in these areas might be an
epiphenom-enon of the neural processes underlying object recognition. It is
pos-sible that earlier visual areas resolve border ownership and provide
input to higher visual areas (Rubin, 2001). Zhou et al. (2000)
re-ported that
⬎50% of the neurons in monkey V2 showed a border
ownership selectivity, which provides some tentative support for the
early computation idea. In a human psychophysical study, von der
Heydt et al. (2005) showed a border-ownership-dependent tilt
after-effect pointing to the existence of border-ownership selective
neu-rons at early stages in the human visual cortex. Consistent with these
studies, our fMRI study demonstrated the important role of V2 in
mediating the processing of border ownership.
We found that attention is critical for the neural selectivity of
border ownership: when subjects did a very demanding fixation task,
the border ownership adaptation effect was nearly abolished in their
early visual cortex. Qiu et al. (2007) reported that, although the
neu-ronal responses to border ownership in V2 were strongly modulated
by attention, there were still some neurons whose selectivity to
bor-der ownership was independent of attention. This discrepancy could
be attributed to many factors. In addition to the species difference
(human vs monkey) and stimulus difference, one important factor is
the attentional task difference. Subjects did the fixation task
throughout an fMRI run (⬃7 min) and they reported having little
awareness of the border ownership assignment. It might be more
proper to claim that border ownership assignment depends on
vi-sual awareness. In Qiu et al. (2007), the onset of a test stimulus could
have recruited some bottom-up (exogenous) attention, although the
stimulus was cued to be ignored. Another important factor is the
measure difference (fMRI adaptation vs single-unit recording). Our
claim that border ownership selectivity depends on attention is
based on the finding of attention-dependent border ownership
se-lective adaptation. It might be argued that border ownership signals
do not depend on attention, but their adaptation does. Although we
cannot completely rule out this possibility and it is true that some
kind of adaptation requires attention (Yeh et al., 1996), it is widely
accepted that selective adaptation originates from neuronal
selectiv-ity and many studies have demonstrated that they can be modulated
similarly by attention (Murray and Wojciulik, 2004; Clifford and
Rhodes, 2005).
The attentional effect indicates that border ownership
pro-cessing depends on the modulation from higher-level cortical
areas. This modulation could be realized in two different ways.
Figure 4. fMRI results in the control experiment. Left column shows the time courses of BOLD signals evoked by test stimuli that were presented at time point 0. The signals were averaged across four subjects in V1 and V2. Error bars denote 1 SEM calculated across subjects at each time point. Right column shows fMRI response amplitudes to test stimuli for individual subjects. Error bars denote 1 SEM calculated across scans for each subject.
One way is that attention enhances V2 activity, and V2 by itself
generates the border ownership signal through intracortical
in-teractions, as suggested in a computational model by Zhaoping
(2005). The other way is that, higher visual areas whose activity is
largely dependent on attention, integrate contextual
informa-tion, determine the border ownership and feed back to V2.
In visual information processing, border ownership assignment
is closely related to figure– ground organization.
Electrophysiologi-cal studies (Zipser et al., 1996; Lee et al., 1998) (but see Rossi et al.,
2001) have found enhancement of texture-evoked activity in figure
regions compared with the ground region in V1 neurons. In our
study, the border ownership changes were accompanied by a change
of figure– ground organization. However, the weak and unreliable
adaptation effect in V1 indicates that there was no robust sensitivity
to the figure– ground change. Zipser et al. (1996) and Lee et al.
(1998) used line-textured figures that were centered on the receptive
field. Thus, the enhancement in figure regions reflected the activity
of neurons that are selective for the texture orientation, not the figure
boundary. However, the figures and ground in our stimuli were
objects of uniform color. Because it is known that most cortical
neurons respond very little to uniform stimuli (Hubel and Wiesel,
1968), figure– ground information in our study is likely coded only
in the border responses. It remains to be examined whether the
figure– ground effect can be revealed in V1 by using line-textured
stimuli and fMRI adaptation technique.
Consistent with previous studies (Albright and Stoner, 2002),
our results suggest that neurons in early visual cortex integrate the
image context far beyond the classical receptive field, and add weight
to the claim that high-level visual computations and representations
involve neural activity in early visual cortex (Lee et al., 1998).
Al-though it has been shown that fMRI signals in human early visual
cortex can be modulated by contextual information
(Zenger-Landolt and Heeger, 2003; Sasaki and Watanabe, 2004; Murray et al.,
2006; Boyaci et al., 2007), we demonstrate a context-dependent
fMRI adaptation effect that provides clear evidence of border
own-ership selectivity at a subvoxel level in human early visual cortex.
Together with other evidence, the resolution of border ownership
involves computations in early as well as high-level cortical areas. In
future research, asking how these computations are done by inter- and
intracortical cooperation will be of great importance to understand how
human visual system parses images and recognizes objects.
References
Albright TD, Stoner GR (2002) Contextual influences on visual processing. Annu Rev Neurosci 25:339 –379.
Andrews TJ, Schluppeck D, Homfray D, Matthews P, Blakemore C (2002) Activity in the fusiform gyrus predicts conscious perception of Rubin’s vase-face illusion. Neuroimage 17:890 –901.
Ashida H, Lingnau A, Wall MB, Smith AT (2007) fMRI adaptation reveals separate mechanisms for first-order and second-order motion. J Neuro-physiol 97:1319 –1325.
Baylis GC, Driver J (2001) Shape-coding in IT cells generalizes over contrast and mirror reversal, but not figure-ground reversal. Nat Neurosci 4:937–942. Boyaci H, Fang F, Murray SO, Kersten DJ (2007) Responses to lightness
variations in early human visual cortex. Curr Biol 17:989 –993. Brefczynski JA, DeYoe EA (1999) A physiological correlate of the
“spot-light” of visual attention. Nat Neurosci 2:370 –374.
Buracas GT, Boynton GM (2002) Efficient design of event-related fMRI ex-periments using M-sequences. Neuroimage 16:801– 813.
Clifford CWG, Rhodes G (2005) Fitting the mind to the world: adaptation and after-effects in high-level vision. New York: Oxford UP.
Corbetta M, Shulman GL (2002) Control of goal-directed and stimulus-driven attention in the brain. Nat Rev Neurosci 3:201–215.
Cornelissen FW, Wade AR, Vladusich T, Dougherty RF, Wandell BA (2006) No functional magnetic resonance imaging evidence for brightness and color filling-in in early human visual cortex. J Neurosci 26:3634 –3641.
Driver J, Baylis GC (1996) Edge-assignment and figure-ground segmenta-tion in short-term visual matching. Cognit Psychol 31:248 –306. Dumoulin SO, Wandell BA (2008) Population receptive field estimates in
human visual cortex. Neuroimage 39:647– 660.
Engel SA, Glover GH, Wandell BA (1997) Retinotopic organization in hu-man visual cortex and the spatial precision of functional MRI. Cereb Cortex 7:181–192.
Fang F, Murray SO, Kersten D, He S (2005) Orientation-tuned fMRI adap-tation in human visual cortex. J Neurophysiol 94:4188 – 4195.
Fang F, Murray SO, He S (2007) Duration-dependent fMRI adaptation and distributed viewer-centered face representation in human visual cortex. Cereb Cortex 17:1402–1411.
Hubel DH, Wiesel TN (1968) Receptive fields and functional architecture of monkey striate cortex. J Physiol 195:215–243.
Kastner S, Ungerleider LG (2000) Mechanisms of visual attention in the human cortex. Annu Rev Neurosci 23:315–341.
Kourtzi Z, Kanwisher N (2001) Representation of perceived object shape by the human lateral occipital complex. Science 293:1506 –1509.
Krekelberg B, Boynton GM, van Wezel RJA (2006) Adaptation: from single cells to BOLD signals. Trends Neurosci 29:250 –256.
Larsson J, Landy MS, Heeger DJ (2006) Orientation-selective adaptation to first- and second-order patterns in human visual cortex. J Neurophysiol 95:862– 881.
Lee TS, Mumford D, Romero R, Lamme VAF (1998) The role of the primary visual cortex in higher level vision. Vision Res 38:2429 –2454.
Liu T, Larsson J, Carrasco M (2007) Feature-based attention modulates orientation-selective responses in human visual cortex. Neuron 55:313–323.
Moore T, Armstrong KM (2003) Selective gating of visual signals by micro-stimulation of frontal cortex. Nature 421:370 –373.
Murray SO, Wojciulik E (2004) Attention increases neural selectivity in the human lateral occipital complex. Nat Neurosci 7:70 –74.
Murray SO, Boyaci H, Kersten D (2006) The representation of perceived angular size in human primary visual cortex. Nat Neurosci 9:429 – 434. Nakayama K, Shimojo S, Silverman GH (1989) Stereoscopic depth: its
rela-tion to image segmentarela-tion, grouping, and the recognirela-tion of occluded objects. Perception 18:55– 68.
Posner MI (1980) Orienting of attention. Q J Exp Psychol 32:3–25. Qiu FT, von der Heydt R (2005) Figure and ground in the visual cortex: V2
combines stereoscopic cues with Gestalt rules. Neuron 47:155–166. Qiu FT, Sugihara T, von der Heydt R (2007) Figure-ground mechanisms
provide structure for selective attention. Nat Neurosci 10:1492–1499. Rossi AF, Desimone R, Ungerleider LG (2001) Contextual modulation in
primary visual cortex of macaques. J Neurosci 21:1698 –1709. Rubin N (2001) Figure and ground in the brain. Nat Neurosci 4:857– 858. Sasaki Y, Watanabe T (2004) The primary visual cortex fills in color. Proc
Natl Acad Sci U S A 101:18251–18256.
Sereno MI, Dale AM, Reppas JB, Kwong KK, Belliveau JW, Brady TJ, Rosen BR, Tootell RBH (1995) Borders of multiple visual areas in humans re-vealed by functional magnetic resonance imaging. Science 268:889 – 893. Smith AM, Lewis BK, Ruttimann UE, Ye FQ, Sinnwell TM, Yang Y, Duyn JH, Frank JA (1999) Investigation of low frequency drift in fMRI signal. Neuroimage 9:526 –533.
Smith AT, Singh KD, Williams AL, Greenlee MW (2001) Estimating recep-tive field size from fMRI data in human striate and extrastriate visual cortex. Cereb Cortex 11:1182–1190.
Tootell RB, Hadjikhani N, Hall EK, Marrett S, Vanduffel W, Vaughan JT, Dale AM (1998) The retinotopy of visual spatial attention. Neuron 21:1409 –1422.
von der Heydt R, Macuda T, Qiu FT (2005) Border-ownership-dependent tilt aftereffect. J Opt Soc Am A 22:2222–2229.
Yeh SL, Chen IP, De Valois KK, De Valois RL (1996) Figural aftereffects and spatial attention. J Exp Psychol Hum Percept Perform 22:446 – 460. Zenger-Landolt B, Heeger DJ (2003) Response suppression in V1 agrees
with psychophysics of surround masking. J Neurosci 23:6884 – 6893. Zhaoping L (2005) Border ownership from intracortical interactions in
vi-sual area V2. Neuron 47:143–153.
Zhou H, Friedman HS, von der Heydt R (2000) Coding of border owner-ship in monkey visual cortex. J Neurosci 20:6594 – 6611.
Zipser K, Lamme VA, Schiller PH (1996) Contextual modulation in pri-mary visual cortex. J Neurosci 16:7376 –7389.