A MULTI SCALE MOTION SALIENCY
METHOD FOR KEYFRAME EXTRACTION
FROM MOTION CAPTURE SEQUENCES
a thesis
submitted to the department of computer engineering
and the institute of engineering and science
of b˙ilkent university
in partial fulfillment of the requirements
for the degree of
master of science
By
Cihan Halit
December, 2010
I certify that I have read this thesis and that in my opinion it is fully adequate, in scope and in quality, as a thesis for the degree of Master of Science.
Asst. Prof. Dr. Tolga C¸ apın(Advisor)
I certify that I have read this thesis and that in my opinion it is fully adequate, in scope and in quality, as a thesis for the degree of Master of Science.
Prof. Dr. B¨ulent ¨Ozg¨u¸c
I certify that I have read this thesis and that in my opinion it is fully adequate, in scope and in quality, as a thesis for the degree of Master of Science.
Assoc. Prof. Dr. Veysi ˙I¸sler
Approved for the Institute of Engineering and Science:
Prof. Dr. Levent Onural Director of the Institute
ABSTRACT
A MULTI SCALE MOTION SALIENCY METHOD FOR
KEYFRAME EXTRACTION FROM MOTION
CAPTURE SEQUENCES
Cihan Halit
M.S. in Computer Engineering Supervisor: Asst. Prof. Dr. Tolga C¸ apın
December, 2010
Motion capture is an increasingly popular animation technique; however data ac-quired by motion capture can become substantial. This makes it difficult to use motion capture data in a number of applications, such as motion editing, motion understanding, automatic motion summarization, motion thumbnail generation, or motion database search and retrieval. To overcome this limitation, we propose an automatic approach to extract keyframes from a motion capture sequence. We treat the input sequence as motion curves, and obtain the most salient parts of these curves using a new proposed metric, called ’motion saliency’. We select the curves to be analyzed by a dimension reduction technique, Principal Com-ponent Analysis. We then apply frame reduction techniques to extract the most important frames as keyframes of the motion. With this approach, around 8% of the frames are selected to be keyframes for motion capture sequences. We have quantified our results both mathematically and through user tests.
Keywords: motion saliency, motion capture, keyframe extraction, Principal Com-ponent Analysis, PCA.
¨
OZET
HAREKET YAKALAMA D˙IZ˙ILER˙INDEN ANAHTAR
KARE C
¸ IKARTMAK ˙IC
¸ ˙IN YEN˙I B˙IR METOD: C
¸ OK
¨
OLC
¸ EKL˙I HAREKET BEL˙IRG˙INL˙I ˘
G˙I
Cihan Halit
Bilgisayar M¨uhendisli˘gi, Y¨uksek Lisans Tez Y¨oneticisi: Asst. Prof. Tolga C¸ apın
Aralık, 2010
Hareket yakalama, kullanımı gittik¸ce artan animasyon tekniklerindendir; lakin hareket yakalama ile elde edilen veriler kolaylıkla ¸cok b¨uy¨uk boyutlara ula¸sabilir. Bu durum hareket yakalamayı, hareket d¨uzenleme, hareket anlama, otomatik hareket ¨ozetleme, hareket ¨onizlemesi olu¸sturma ya da hareket veritabanı sorgu-lama gibi ¸ce¸sitli uygusorgu-lamalarda kullanı¸ssız hale getirmektedir. Bu kısıtsorgu-lamayı a¸smak amacıyla, hareket yakalama dizisinden otomatik olarak anahtar kareleri bulabilen bir y¨ontem ¨onermekteyiz. Bu y¨ontemde, girdi olarak kullanılan diziyi e˘griler olarak alıp, ’hareket belirginli˘gi’ adlı yeni bir metrik kullanılarak bu e˘grilerin en belirgin b¨ol¨umleri bulunmaktadır. Analiz edilecek e˘griler ”Esas Bile¸sen Analizi” isimli boyut indirgeme metodu kullanılarak se¸cilmektedir. Daha sonra, uygulanan kare indirgeme tekni˘gi ile ¨onemli kareler anahtar kareler olarak ¸cıkartılmaktadır. Bu y¨ontem sayesinde, hareket yakalama verisinin yakla¸sık %8’i anahtar kare olarak se¸cilmektedir. Son olarak bu sonu¸clar matematiksel ve kul-lanıcı testleri sayesinde de˘gerlendirilmektedir.
Anahtar s¨ozc¨ukler : hareket belirginli˘gi, hareket yakalama, anahtar kare ¸cıkartma, Esas Bile¸sen Analizi.
Acknowledgement
First of all, I would like to thank my supervisor Asst. Prof. Dr. Tolga C¸ apın for his great support on publishing this work as a journal and for his encouragement to extend this work as a thesis.
I would also like to thank Prof Dr. B¨ulent ¨Ozg¨u¸c and Assoc. Prof. Dr. Veysi ˙I¸sler for accepting to evaluate my work as the members of the thesis committee without hesitation.
Great thanks to my family for their unending support during the entire time of my graduate study. They were the greatest encouragement for me to finish my thesis.
Lastly, I would like to thank to all of my friends in the office and my family members for participating in the user tests. I could not have finished this thesis without their contribution.
Contents
1 Introduction 1
2 Background 3
2.1 Keyframe Extraction . . . 3
2.1.1 Curve Simplification Based Algorithms . . . 5
2.1.2 Clustering Based Methods . . . 5
2.1.3 Matrix Factorization Based Methods . . . 6
2.2 Human Motion . . . 7
2.3 Saliency . . . 8
3 Approach 9 3.1 Steps of the Method . . . 10
3.1.1 Step 1: Dimension Reduction . . . 11
3.1.2 Step 2: Computing Motion Saliency . . . 13
3.1.3 Step 3: Candidate Keyframes . . . 15
3.1.4 Step 4: Clustering . . . 16 vi
CONTENTS vii
3.2 Complexity . . . 16
3.3 Contact Point Problems . . . 17
4 Results and Evaluation 20 4.1 Keyframe Extraction . . . 21
4.2 Extraction Parameters . . . 24
4.3 Motion Curve Representation . . . 26
4.4 Performance . . . 27
4.5 Applications . . . 28
5 User Tests and Experiments 30 5.1 Test Cases . . . 31
5.1.1 Test Case 1: Different Extraction Methods . . . 31
5.1.2 Test Case 2: Different Extraction Parameters . . . 36
5.1.3 Test Case 3: Contact Point Handling Tests . . . 40
5.2 Overall Evaluation of User Tests . . . 44
6 Conclusion and Future Work 45
List of Figures
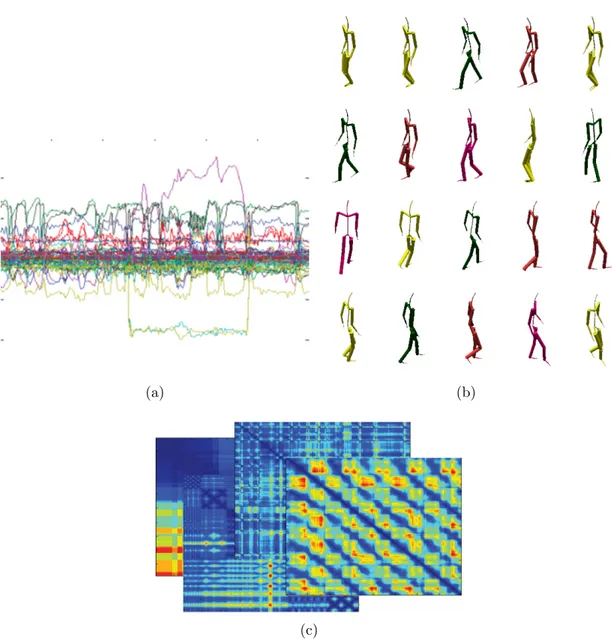
2.1 Summary of approaches for keyframe extraction. (a) Curve Sim-plification based methods extract and analyze motion curves of each degree of freedom (DOF); (b) Clustering based methods com-pare the motion frame by frame to group similar frames into clus-ters; (c) Matrix Factorization based methods form a matrix, where frame-by-frame comparison is computed, and keyframes are then extracted by using matrix algebra. . . 4
3.1 General outline of the method . . . 10 3.2 Algorithm . . . 11 3.3 Saliency values of frames in a sample joint in walking action. . . . 15 3.4 Set of Candidate keyframes are indicated on sample curve. Each
of the points indicated in red are more salient than the average saliency value. . . 15
4.1 a-b. Effect of dimension reduction (k) on the overall error, for high-dynamic and low-dynamic motions. c-d. Effect of parameter σ on the overall error, for high-dynamic and low-dynamic motions. 26 4.2 Keyframe extraction execution time of our method for different
size of motions . . . 27
LIST OF FIGURES ix
4.3 Keyframes of a flip motion(a-l) and the thumbnail(m) generated
from the set of keyframes . . . 29
5.1 Method comparison user test on playing basketball motion. . . 33
5.2 Method comparison user test on boxing motion. . . 34
5.3 Method comparison user test on walking motion. . . 35
5.4 Parameter comparison user test on playing basketball motion. . . 37
5.5 Parameter comparison user test on flip motion. . . 38
5.6 Parameter comparison user test on walking motion. . . 39
5.7 Contact Handling comparison user test on playing basketball motion. 41 5.8 Contact Handling comparison user test on dancing motion. . . 42
5.9 Contact Handling comparison user test on walking motion. . . 43
A.1 Summary of the Basketball motion that is used in the user tests. . 52
A.2 Summary of the Walking motion that is used in the user tests. . . 53
A.3 Summary of the Boxing motion that is used in the user tests. . . 54
A.4 Summary of the Flip motion that is used in the user tests. . . 55
List of Tables
4.1 Comparison of keyframe extraction algorithms in the Euler angle space and body coordinate space. . . 23 4.2 Peak Signal-to-Noise Ratio values for reconstructed motions in
Eu-ler angle space. . . 24
5.1 Statistical Results of testing different methods on playing basket-ball motion. . . 33 5.2 Statistical Results of testing different methods on boxing motion. 34 5.3 Statistical Results of testing different methods on walking motion. 35 5.4 Statistical Results of testing varying parameters on playing
bas-ketball motion. . . 37 5.5 Statistical Results of testingvarying parameters on flip motion. . . 38 5.6 Statistical Results of testing varying parameters on walking motion. 39 5.7 Statistical Results of testing contact handling on playing basketball
motion. . . 41 5.8 Statistical Results of testing contact handling on dancing motion. 42 5.9 Statistical Results of testing contact handling on walking motion. 43
Chapter 1
Introduction
Motion capture is a central technique in the creation of computer games, virtual environments, digital special effects in movies, and medical applications. The power of motion capture comes from its ability to produce very realistic results, even for the most complex motions, in real time. Unfortunately, problems still arise when motion capture is used. It is costly to capture an action, as repeated trials are commonly needed. Another problem of motion capture is that ap-plying the captured sequence to a different character model requires a complex retargeting process.
Keyframing delivers a potential solution that overcomes the disadvantages of the use of motion capture alone: massive amounts of motion capture data can be summarized by keyframes, and keyframe editing can be used on an already captured sequence to obtain a new motion without having to go through the costly process of recapturing. This process requires that representative frames be selected from a very large set of frames of a motion capture sequence, which is the focus of this work.
In this paper, we propose a new multiscale approach to extract keyframes from a motion capture sequence. We treat the input motion data as a set of motion curves, and find the most salient parts of these curves that are crucial in the representation of the motion behavior. We apply the idea of motion saliency,
CHAPTER 1. INTRODUCTION 2
a new multiscale metric, to motion curves in the first step of our algorithm. The multiscale property of our approach allows us to measure the degree of difference between the center frame and the surround frames, in different time scales. Then in the second step, we apply clustering and keyframe reduction techniques to obtain the most important keyframes of the motion.
There are a large number of potential applications of our solution. An obvious application of our technique is as a tool in summarization: it allows the user to acquire an image preview of the motion. This approach is commonly used in automatic thumbnail generation for motion capture databases. Our technique is also applicable for motion editing; it allows the user to manually edit the motion by automatically selecting relevant keyframes. Our method can also be used as a tool in a wide variety of applications, such as motion understanding, motion compression, motion database search and retrieval.
As discussed in the previous work section, there exist prior brute-force ap-proaches to extract better set of keyframes; however, they are computationally expensive with computational complexity O(n2), where n is the number of frames
in the motion capture sequence. Our algorithm solves the same problem with O(n) complexity, and provides a solution that can be used in interactive applica-tions and for processing large motion capture databases.
The remainder of the paper is organized as follows. First, we survey previous work on keyframe extraction and the saliency model of attention. Then, we ex-plain our multiscale keyframe extraction approach with a new metric to estimate the importance of a frame. We present the experimental results and applica-tions of our approach. Lastly, we provide results of our user tests and present discussions and conclusions of our work.
Chapter 2
Background
We draw upon different areas of research for our keyframe extraction method. The following sections discuss the relevant work in these areas.
2.1
Keyframe Extraction
Various methods have been proposed for keyframe extraction; these methods can be classified into three categories in terms of their approach: (i) Curve Simpli-fication, (ii) Clustering, and (iii) Matrix Factorization. Figure 2.1 illustrates the difference among these approaches, and the related work for each category is summarized and discussed below.
CHAPTER 2. BACKGROUND 4
(a) (b)
(c)
Figure 2.1: Summary of approaches for keyframe extraction. (a) Curve Simplifica-tion based methods extract and analyze moSimplifica-tion curves of each degree of freedom (DOF); (b) Clustering based methods compare the motion frame by frame to group similar frames into clusters; (c) Matrix Factorization based methods form a matrix, where frame-by-frame comparison is computed, and keyframes are then extracted by using matrix algebra.
CHAPTER 2. BACKGROUND 5
2.1.1
Curve Simplification Based Algorithms
Curve Simplification Based Algorithms are principally based on simplifying a motion curve as a set of straight lines, which describe the original curve with a certain error margin. An initial work of curve simplification belongs to Lim and Thalmann [20]. Their method uses Lowe’s algorithm [22] for curve simplification. Starting with the line which combines the start and end points of the curve, the algorithm divides the line into two line segments if the maximum distance of any point on the curve from the line is larger than a certain error rate. The algorithm performs the same process recursively for each new line segment, until the desired error rate is achieved.
Another approach that aims to find the keyframes based on motion curves is the work of Okuda et al. [18][28]. This algorithm detects the keyframes in motion capture data by using frame decimation: the frames are decimated one by one, according to their importance. When a desired number of keyframes are obtained, the process stops. Another related work is Matsuda and Kondo’s approach [23]. First, the solution finds the fixed frames of the motion, which satisfy one of the following: (i) local minimum or maximum value, (ii) one of the end points of a straight line, (iii) a point that has a large angle difference on both sides; that is, the points which are at least 50% of the amplitude far away from the neighbour frames. Having the fixed frames of the motion that cannot be deleted, Matsuda et al. apply reduction operations to the other characteristic frames and find the keyframes of the motion. However, this method is not optimal; it has been reported that on average, 55% of all frames are selected to be keyframes of a motion.
2.1.2
Clustering Based Methods
Clustering Based Methods transform the keyframe extraction process into a clus-tering algorithm. In this approach, similar frames are grouped into clusters, and a representative frame is selected from each cluster as a keyframe. Similarity is defined here as a function of weighted distance between joints of the character
CHAPTER 2. BACKGROUND 6
between frames [21]. Park et al. [25] represent motion capture data in quaternion form, and apply PCA and k-means clustering on quaternions. Then, scattered data interpolation is used to extract keyframes out of these clusters. The or-der of frames is an important part of keyframe extraction, but these approaches generally do not take the order of frames into account in the clustering step.
2.1.3
Matrix Factorization Based Methods
Matrix Factorization Based Methods represent frames of motion sequence as ma-trices, such as feature frame matrices formed by color histograms of frames. By using techniques such as singular value decomposition [9] or low-order discrete cosine transform (DCT) [7], the summary of the motion is constructed. Key-Probe is such a factorization technique, which constructs a frame matrix that holds vertex positions of a 3D mesh, and processes this matrix to extract the key matrix [12]. Every other frame in the sequence is a linear combination of this key matrix. The key matrix can be calculated by specifying the number of keyframes or an error threshold.
Each of these approaches has its advantages and disadvantages. Curve sim-plification algorithms are very efficient in terms of speed, but these algorithms have to consider only a subset of the curves which represent the motion in order work efficiently; and there is no single way to select the best subset among all subsets. On the other hand, clustering and matrix factorization methods do not have to select such subsets, and they can operate on the entire set of data. The disadvantage of clustering algorithms is that they do not take the order of the frames into account. However, discarding the time domain in keyframe extraction is a big disadvantage. The best performing methods, in terms of extracting the most favourable keyframes, are the matrix factorization methods; however these algorithms perform very slowly due to their quadratic running time complexity.
CHAPTER 2. BACKGROUND 7
2.2
Human Motion
Several researchers have observed that there is a lot of redundancy in human motion [20], which is caused by the fact that human joints act in a coordinated manner for any kind of motion [26]. Various animation methods, covering a wide range of techniques from inverse kinematics to procedural animation, make use of this property. Coleman et al. use coordinated features of human motion, such as maxima of acceleration and directional acceleration, to extract staggered poses out of a capture sequence [6]. Procedural generation of grasping motion is another popular technique; Parent states the motions of all fingers are inter-related in the grasping motion [24]. Other studies have also shown that the spine controls the human motion, and therefore torso, arms and head, are involved even in a simple walking motion [24]. All these and similar findings arise from the fact that the human body aims to minimize the total amount of strain on the body, thus many joints strain in a little amount to account for a great strain on a single joint. Furthermore, many human motions, such as walking, are cyclic in nature and create uniformity in joint positions [14]. Methods which analyze human motion exploit this feature by defining joint groups, where joints in a joint group are functionally dependent on each other [31].
Our method removes such redundancies in human motion using the Principal Component Analysis (PCA) method. PCA has been used successfully for a num-ber of applications in computer animation. For example, Alexa and M¨uller have applied this technique to mesh deformations, yielding up to 100 times compres-sion of meshes [2]. Glardon et al. have applied the PCA technique to a set of motion captured walking animations, for reconstruction of parameters that pro-vide high-level control over subsequent procedural walking animation [8]. Sattler et al. use PCA to compress mesh animations [27]. This method uses Clustered PCA to employ clustering on the mesh, and then applies PCA to compress each cluster by itself. Barbic et al. use different models of representation to clas-sify motion capture segments, and they conclude that the best representation is provided by Probabilistic PCA[4].
CHAPTER 2. BACKGROUND 8
2.3
Saliency
Our method builds upon the saliency model that is popular in the perception field. Saliency, which characterizes the level of significance of the subject being observed, has been a focus of cognitive sciences for more than 20 years. Saliency is commonly thought as a visual cue, but in effect it is a multiscale metric to measure the significance of the subject as the result of its contrast from its neighbours. Itti and Koch [15] describe one of the earliest methods to compute the saliency map of 2D raster images. Lee et al. have introduced the saliency model of 3D static meshes, using the curvature property of mesh vertices [17]. They have shown how the computed saliency values can be used to drive the simplification of the 3D mesh or best viewpoint selection.
We propose a new motion saliency metric for motion frames, based on the multiscale center-surround operator on Gaussian-weighted mean curvatures in the motion curve. In earlier work, Bulut and Capin use a center-surround oper-ator to detect important frames from the motion curve [5]. This approach has the shortcoming of selecting a single joint among all the joints to analyze for keyframing, which yields a large error if the wrong joint is selected. Also com-pared to this earlier work, our proposed method analyzes every DOF according to its importance by dimensionality reduction, and selects keyframes from a number of motion curves to obtain an optimal amount of keyframes. Finally, our pro-posed approach uses a multiscale operator with different neighborhood sizes. The multiscale property of our approach allows us to measure the degree of difference between the center frame and the surround frames, in different time scales. This type of approach leads to a more robust detection of keyframes. We explain the details of the proposed algorithm in the next section.
Chapter 3
Approach
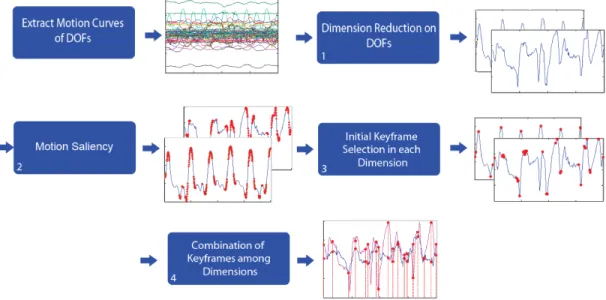
Our method is composed of four steps: dimension reduction, computing motion saliency, candidate keyframe selection, and clustering (Figure 3.1). The first step involves dimension reduction of the input motion sequence. Our approach considers each joint angle of the character as a separate dimension of the signal, and applies Principal Component Analysis (PCA) to reduce input dimension space. Next, an initial set of candidate keyframes are selected in the reduced dimensions, using the proposed motion saliency metric.
Our method of computing the saliency of each frame is based on the center-surround operator of Itti et al. [15]. In the final step, clusters are formed for neighbouring candidate keyframes and the most significant keyframe is selected within each cluster.
CHAPTER 3. APPROACH 10
Figure 3.1: General outline of the method
There are clear advantages for decoupling these three tasks as opposed to solving them jointly. First, the human motion is essentially a high-dimensional signal, and dimension reduction helps to remove redundancies in the motion in-put. Second, rather than focusing on local features of frames that typically have large variations; our solution aims to capture the saliency of frames by search-ing over varysearch-ing ranges of frame neighborhood. Third, the candidate keyframes tend to form groups, because of the high frame rate for motion capture and the smooth nature of human motion; and the clustering step helps to exploit the similarity in neighbouring frames. From a computational point of view, by solv-ing each of the problems separately in linear time, our entire algorithm runs in linear time. For detailed explanation of computational complexity of the method, please read section 3.2.
3.1
Steps of the Method
Summary of our method is given in Figure 3.2. Details of each step is given below.
CHAPTER 3. APPROACH 11
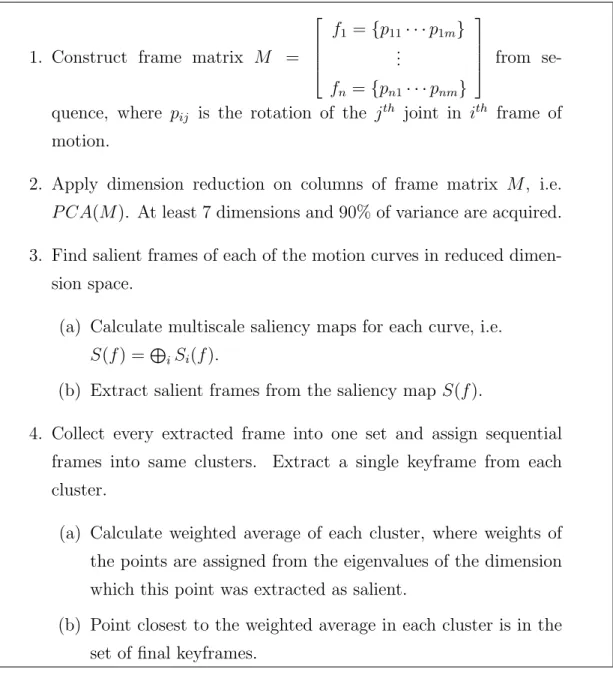
1. Construct frame matrix M =
f1 = {p11· · · p1m} .. . fn = {pn1· · · pnm} from se-quence, where pij is the rotation of the jth joint in ith frame of
motion.
2. Apply dimension reduction on columns of frame matrix M , i.e. P CA(M ). At least 7 dimensions and 90% of variance are acquired. 3. Find salient frames of each of the motion curves in reduced
dimen-sion space.
(a) Calculate multiscale saliency maps for each curve, i.e. S(f ) =L
iSi(f ).
(b) Extract salient frames from the saliency map S(f ).
4. Collect every extracted frame into one set and assign sequential frames into same clusters. Extract a single keyframe from each cluster.
(a) Calculate weighted average of each cluster, where weights of the points are assigned from the eigenvalues of the dimension which this point was extracted as salient.
(b) Point closest to the weighted average in each cluster is in the set of final keyframes.
Figure 3.2: Algorithm
3.1.1
Step 1: Dimension Reduction
Human motion is a high-dimensional signal, and it would be infeasible to con-sider every dimension of the motion in keyframe extraction. However, there are strong correlations between different joint groups, as shown by previous research discussed in section 2.2. To propose a general solution, we assume that the joints
CHAPTER 3. APPROACH 12
that form these groups are not fixed, and they differ from one motion to another. We use the PCA (Principal Component Analysis) dimension reduction tech-nique to take account of this correlation [2]. The PCA techtech-nique analyzes dif-ferences and similarities of data consisting of many trials and a high number of variables, in order to find suitable bases for dimension reduction. We use the PCA method to find the principal components of the input motion. In other words, we reduce the number of degrees of freedom in the motion capture sequence while not losing much of the information content of the motion. There are vari-ous methods to perform PCA, such as SVD (Singular Value Decomposition) and covariance matrices [2]. In this work, we use covariance matrices, because ex-tracting eigenvalues from the covariance matrix helps us to find the importance of every component. We use these eigenvalues in the candidate keyframe selection stage.(subsection 3.1.3)
We build the PCA model so that each joint angle (represented as three Euler angles) is considered as a dimension in the high dimensional space. We construct an n × m data matrix: M = f1 = {p11· · · p1m} .. . fn= {pn1· · · pnm} = [J1· · · Jm] (3.1)
where m is the original number of degrees of freedom, and n is the number of frames in the motion, which is standardized in each column. We then construct an m × m covariance matrix from this data, and find eigenvectors and eigenvalues of this matrix. We choose the most significant k eigenvectors as the new bases by selecting eigenvectors with the highest k eigenvalues.
As a result, we form a row feature vector R by:
R = (eig1· · · eigk) (3.2)
Where eigi is the ith significant eigenvector. Thus, by choosing k eigenvectors,
we reduce the number of dimensions of the human motion data from m to k . We then construct the reduced motion matrix F , as:
CHAPTER 3. APPROACH 13
where F is a n × k matrix, and k dimensions are represented as separate k curves, Di. The percentage variance maintained during the dimension reduction
can be found by the ratio of the sum of the selected eigenvalues to the sum of all eigenvalues.
We observe that there is no single number of dimensions k suitable for every motion sequence. This greatly depends on the nature of the motion. Naturally, a higher number of dimensions have to be used for highly dynamic motions, such as jumping, running, etc. in order to maintain visual quality in the constructed motion. A detailed analysis of this parameter is presented in the results section.
3.1.2
Step 2: Computing Motion Saliency
The second step selects the candidate keyframes in the reduced dimensions. To identify the salient frames in the motion curves, we apply multiscale Gaussian filters. Our method of computing the saliency of each frame is based on the center-surround operator of Itti et al. [15], which measures the degree of difference between the center and surround of an image element. Lee et al. have used this metric for 3D mesh geometry to calculate the regions of the mesh that attract attention [17]. Our method for computing the significance of motion frames uses a similar curvature-based center-surround operator, adapted to motion curves.
The first step in our saliency computation is calculating standard curvatures of the motion curves in the neighbourhood of each frame i [29] by Equation 3.4:
C(Dij) = |D00 ij| (1 + D02 ij)3/2 (3.4) where Dij is the value of principal curve j at frame i in the lower dimension space,
calculated by PCA.
The second step (Equation 3.5) computes the Gaussian-weighted average of the curvature in the neighbourhood of a point for each curve, assuming a Gaussian distribution with mean 0 and standard deviation σ and centered at that point. We calculate values for fine-to-coarse scales, with standard deviation (σ1, σ2, σ3, σ4)
CHAPTER 3. APPROACH 14 [17]: G(f, σ) = P x∈N (f,2σ)C(f )e[−kx−f k 2/(2σ2)] P x∈N (f,2σ)e[−kx−f k 2/(2σ2)] (3.5)
where G(f, σ) is the Gaussian-weighted average of curvature at frame f .
To compute the motion saliency of a frame f , we use the saliency definition of frame f at a scale level i as Si(f ) following the approach proposed by Lee et al.
[17]. Extracting poses out of important features of animation is better done in multiple scales, because the features of animation can be categorized on multiple scales, such as the individual poses of a walking animation on a small scale and the transition from a long walking motion to a jumping motion on a bigger scale. To be able to capture all features on different scales we apply our multi scale model:
Si(f ) = |G(f, σi) − G(f, 2σi)| (3.6)
where σi is the standard deviation of the Gaussian filter at scale i.
Although any ratio can be choosen for σi, our motivation in selecting small
ratios between scales is to avoid disregarding the highly temporal coherency in human animation and to eliminate problems arising when choosing a large neigh-borhood, such as foot skating.
(σ1 = σ, σ2 =
3
2σ, σ3 = 2σ, 5
2σ) (3.7)
The final motion saliency S(f ) is computed by adding the saliency maps at all scales after applying non-linear normalization operator [15]. Since we have a number of saliency maps, each saliency map has to be normalized within the same values to ensure equal contribution of each saliency map. Therefore, we first normalize each saliency map between [0, H], where H is the greatest saliency value among all the saliency maps. Then we find the global maximum Miof the saliency
map and calculate mean mi of the local maxima excluding Mi and then multiply
the saliency map by (Mi−mi)2. This multiplication gives the non-linear property
to the normalization; and it eliminates excessive number of salient points which would arise in a linear normalization.
CHAPTER 3. APPROACH 15
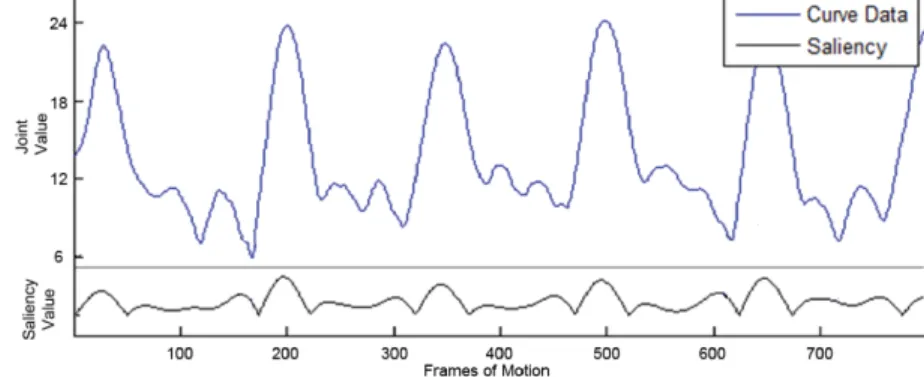
If a point is significant for the motion, it is due to its location on the curve. That is, if its value shows a remarkable change according to the values of neigh-bouring points, it is a significant frame. If a remarkable change occurs in the value of the point between the results of the two Gaussians, then its motion saliency has a higher value. Figure 3.3 shows the saliency values on a sample motion curve.
Figure 3.3: Saliency values of frames in a sample joint in walking action.
3.1.3
Step 3: Candidate Keyframes
After the calculation of the saliency value for each frame on the motion curve, we define the frames having a saliency value greater than average saliency for the motion as candidate keyframes. Figure 3.4 shows the result of this process on the curve given in Figure 3.3.
Figure 3.4: Set of Candidate keyframes are indicated on sample curve. Each of the points indicated in red are more salient than the average saliency value.
CHAPTER 3. APPROACH 16
The value σ is a significant parameter in keyframe selection process and it is not uniform for every motion sequence. Our approach is to reduce σ as the motion becomes more dynamic, in order to maintain fast and frequent changes in these types of motions.A detailed explanation for σ parameter is presented in chapter 4 and chapter 5.
3.1.4
Step 4: Clustering
In the fourth step, we form clusters for neighbouring candidate keyframes, and select the most significant keyframe within each cluster. The selected keyframes from different curves tend to form clusters, due to the redundancy of human motion as discussed above. Extracting each frame in every group as a keyframe results in an excessive number of candidate keyframes. Since each group actually represents similar keyframes in the motion, it is only sufficient to select the most significant frame among each group to represent that group. For every cluster, i.e. for each of group of sequential frames, the selection of the most significant frame is done by calculating a weighted average among each cluster. The weight of each frame is assigned as the eigenvalue of the curve where this frame was found salient.
However, the human motion is continuous and there may be times where clusters overlap each other while the actor is finishing a pose and starting another. Therefore we limit the maximum number of elements in a group to 2σ, because every frame takes into account a neighborhood of 2σ while calculating the saliency of that frame.
3.2
Complexity
The computational complexity of the system can be assessed by evaluating the complexity of each step in Figure 3.1. The combination of these complexities will yield the overall complexity of the algorithm.
CHAPTER 3. APPROACH 17
The first step of the algorithm places the values in matrix M , which can be trivially done in linear time during processing of the motion capture sequence. In the second step, the PCA method is used to perform dimension reduction. This part of the algorithm governs the complexity of the algorithm, because of the matrix operations involved in the algorithm. The calculation of the covariance matrix involves the multiplication of one m × n and one n × m matrix which can be done in O(m2n) time. The calculation of eigenvectors and eigenvalues
are performed in constant time, independent of the number of frames, because inputs and outputs of this function are always m × m matrices. Lastly, the matrix multiplication between a n × m and m × k matrix takes O(kmn) time. Since the system operates on motion capture data, the number of sensors is fixed for every motion and does not increase asymptotically. Therefore, the number of captured degrees of freedom, value m, can be considered as constant. The system sets a bound on the number of principal components, which also renders k as constant. Therefore, the PCA operation effectively becomes an O(n) process for this system.
The next step of the algorithm creates the saliency maps by filtering the cur-vature values of the principal components, all of which can be done in linear time by sequentially computing these values. Lastly, clustering sequential candidate frames together is performed in linear time.
Therefore, on the overall, each step contributes to the algorithm with O(n) complexity, therefore the entire system runs in O(n).
3.3
Contact Point Problems
As an extension of Halit et. al.’s work [11], this thesis focuses on handling contact points in motion capture data. Unfortunately, problems about contact points generally require special handling in the system, otherwise motion anomalies such as foot skating may occur. These anomalies are very easy to be spotted by the human eye, which reduces the quality of constructed motion substantially. In
CHAPTER 3. APPROACH 18
order to increase the realism of the constructed motions, it is essential to take care of these problems.
Arikan states the difficulty of capturing foot contact points very precisely [3]:
”Unfortunately, human motion contains valuable high frequency detail. This is why people often capture motions at high sampling rates (commonly 120-240 Hz). The high frequency detail is usually due to environmental contacts such as foot strikes. Ground reaction force is quite significant (more than the weight of the entire body) and applies over a very short amount of time in a typical gait. Therefore, it fundamentally affects what motion looks like.”
The literature offers methods which resolve contact point issues. However, employing any of these methods would increase the overall complexity of the system, which is currently O(n). So, we have to come up with a new method which does not increase the computational complexity.
In order to maintain a linear complexity, we had to integrate a variation of our original method into the system. Taking the initial definition of Arikan, our method was changed so that the curve representing the global positioning of the feet will be analyzed seperately. This can be interpreted as if the output of the PCA step (subsection 3.1.1) has reduced the motion into k dimensions and two of these k dimensions are the vertical position data of both feet.
”High frequency changes in a short amount of time” actually constitutes a part of the definition of saliency. Therefore ideally, after selecting feet curves as two of the important dimensions, the rest of the method should find the important points by saliency and contact points problems should be solved. Although this is close to reality, the system must ensure that none of the high frequency changes should be skipped. This is done by fixating the σ to small constant, because different motion categories like low-dynamic motions may use higher σ values according their needs. Using a small σ will guarantee that the system will always find frames with high frequency changes in the feet, regardless of motion type. More information on high-dynamic and low-dynamic motions can be found in
CHAPTER 3. APPROACH 19
chapter 4.
As a result, step two (subsection 3.1.2) is now divided into two; σ parameter for the output of the PCA step (k − 2 dimensions) will be selected specifically for the motion, but the σ parameter for the feet curves (2 dimensions) will always be a small value. We have selected this value as 3, since this value was small enough to capture salient data in high-dynamic motions. Tests for this novel method will provided in chapter 5.
Another change in step four (subsection 3.1.4) has to be done to sucessfully output the important points found in modified second step; step four (subsec-tion 3.1.4) selects the most important frame from each group. This step is mod-ified so that frames selected from the feet will be always be selected as the most important for every group. If no candiate frame is selected from a feet curve in a group, previously employed method will be used.
Regarding the new complexity, these modifications do not change the com-plexity of the overall system. First modification in step two is still exactly the same in terms of complexity, because we have only replaced 2 curves from the output of dimension reduction step with feet curves, and changing σ parameter in step two does not the change the complexity in any way.
Modification in step four also does not change the complexity since candidate frames from feet can be flagged by a single boolean. During the processing of candidate keyframes candidate frames from feet will be selected automatically by comparing the flag.
Chapter 4
Results and Evaluation
We have tested our method using motions from the motion capture database of Carnegie Mellon University [1]. From this database, we have selected mo-tions with different dynamic properties to measure the performance of our al-gorithm under different conditions. We have selected walking and stretching as low-dynamic motions, and playing basketball and boxing as high-dynamic mo-tions. All the motion capture sequences were recorded with 120 frames/sec. In order to assess the quality of our work, we have constructed a motion using the selected keyframes by means of interpolation and then we have compared this constructed motion against the original motion . We have used a metric, mean squared error, to quantitatively describe the quality of the reconstructed motion.
The first observation is that more keyframes must be selected in a motion as it becomes more dynamic, otherwise the visual quality of the reconstructed motion degrades significantly. Another important observation is that there is a direct relationship between the number of selected keyframes and the error rate of the constructed motion. Different values of σ and k yield different sets of keyframes. These parameters are studied in detail in the next section. We use Euler joint angles as the main representation method in the system. We have used quaternion spherical interpolation for reconstruction of the motions from the keyframes We also provide results with motion curves in the Euclidean body coordinate space that is local to the body, with body root as the origin, for comparison.
CHAPTER 4. RESULTS AND EVALUATION 21
4.1
Keyframe Extraction
We have compared our results with two state-of-the-art keyframe extraction tech-niques: Frame Decimation [28] and Curve Simplification [19], both for low- and high-dynamic types of motions. We have slightly modified these two algorithms to be able to compare them with our approach: all methods are assumed to take the same desired number of keyframes as input. In the case of frame decima-tion, no changes had to be made because the initial algorithm already depends on the required number of keyframes as the stopping condition. Curve Simpli-fication, however, depends on another metric, called ”tolerance”, which defines the maximum distance between the original curve and constructed curve. There is no direct conversion between tolerance and the number of selected keyframes; therefore we have modified this approach to continue until the desired number of keyframes are acquired. The output of each algorithm is an interpolated motion sequence, with a rate of 120 frames/sec.
Naturally, due to interpolation for in-between frames, the method might not be able to reconstruct a motion exactly as its original on a per frame basis, even if optimum keyframes were selected. Therefore, we compute the mean squared error rate of the techniques using Equation 4.1:
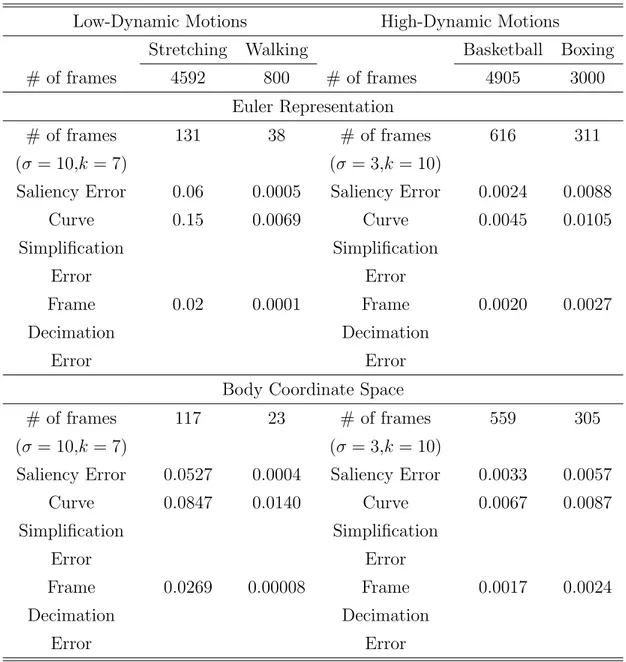
E = " P i( P k|Fio(k) − Fir(k)|2) n × j # (4.1) where Fio(k) and Fir(k) are the (x, y, z) body coordinate values of kth joint of the ith frame in the original and reconstructed motions respectively, n is the number of frames, and j is the number of dimensions in the skeleton (62 for our motions). Table 4.1 shows the comparison of mean squared error for Frame Decimation, Curve Simplification, and our approach. In this comparison, the length of the femur bone of the skeleton was 3.21.
The table illustrates that our algorithm creates an error rate higher than of Frame Decimation [28], as expected, as Frame Decimation applies a brute-force approach that creates near-optimal keyframes. However, our approach is asymptotically more efficient than Frame Decimation with increasing number of frames, since the complexity of our algorithm is linear compared to O(n2)
CHAPTER 4. RESULTS AND EVALUATION 22
complexity of Frame Decimation. Our algorithm performs better in terms of error rate compared to the Curve Simplification Algorithm [19], which has Ω(nlogn) complexity. Table 4.1 also shows that body coordinate representation yields equal performance against Euler angle representation.
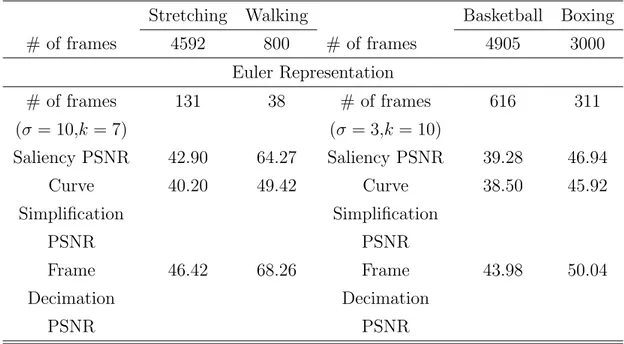
To be able to compare the error rates among different motions, we have also calculated the PSNR (peak signal-to-noise ratio) using the formula below for Euler angle representation:
P SN R = 20 × log10 M AX√ E
!
(4.2) where MAX is the greatest value which a joint angle can take (i.e. 360 degrees). In the body coordinate system, each joint has different bounds for its allowed positions, thus a PSNR value cannot be determined for the constructed motions with body coordinate representation.Table 4.2 shows the PSNR values of the three approaches. As illustrated in Table 4.2, for low-dynamic motions, all the three keyframe extraction methods provide higher signal-to-noise ratio thus, a better reconstruction of the motion than high-dynamic motions.
CHAPTER 4. RESULTS AND EVALUATION 23
Table 4.1: Comparison of keyframe extraction algorithms in the Euler angle space and body coordinate space.
Low-Dynamic Motions High-Dynamic Motions
Stretching Walking Basketball Boxing # of frames 4592 800 # of frames 4905 3000 Euler Representation # of frames (σ = 10,k = 7) 131 38 # of frames (σ = 3,k = 10) 616 311
Saliency Error 0.06 0.0005 Saliency Error 0.0024 0.0088 Curve Simplification Error 0.15 0.0069 Curve Simplification Error 0.0045 0.0105 Frame Decimation Error 0.02 0.0001 Frame Decimation Error 0.0020 0.0027
Body Coordinate Space # of frames
(σ = 10,k = 7)
117 23 # of frames (σ = 3,k = 10)
559 305
Saliency Error 0.0527 0.0004 Saliency Error 0.0033 0.0057 Curve Simplification Error 0.0847 0.0140 Curve Simplification Error 0.0067 0.0087 Frame Decimation Error 0.0269 0.00008 Frame Decimation Error 0.0017 0.0024
CHAPTER 4. RESULTS AND EVALUATION 24
Table 4.2: Peak Signal-to-Noise Ratio values for reconstructed motions in Euler angle space.
Stretching Walking Basketball Boxing # of frames 4592 800 # of frames 4905 3000 Euler Representation # of frames (σ = 10,k = 7) 131 38 # of frames (σ = 3,k = 10) 616 311 Saliency PSNR 42.90 64.27 Saliency PSNR 39.28 46.94 Curve Simplification PSNR 40.20 49.42 Curve Simplification PSNR 38.50 45.92 Frame Decimation PSNR 46.42 68.26 Frame Decimation PSNR 43.98 50.04
4.2
Extraction Parameters
Unlike prior approaches for keyframe extraction, our method has two parameters that can be used to control the extraction process. As discussed, prior solutions assign fixed weights to bones or joints of the skeleton, with limited control of the extraction results. In our approach, we have investigated the effect of the two parameters on the resulting choice of keyframes.
The first parameter k, which is used in the Dimension Reduction step, de-scribes the number of dimensions desired to express the high-dimensional motion capture data. Increasing k increases the number of clusters; as a result, the number of total keyframes will increase in the corresponding motion. The value of k is important to capture sufficient significant information from the original data: high dynamic motions need a greater number of dimensions, not to miss
CHAPTER 4. RESULTS AND EVALUATION 25
important changes in various joints of the skeleton. As shown in Figure 4.1a and Figure 4.1b, there is a significant decline in error during the reconstruction of motions when k > 7. Even for a low-dynamic and slowly changing type of motion as walking, there is a great quality loss when k is low and σ is high. The result of our empirical tests shows that k ∈ [7, 10] ensures a satisfactory visual quality. The second parameter, σ, is used to describe the number of neighbouring frames to be taken into consideration during filtering and clustering steps. In-creasing smoothens the Gaussian filter and thus creates larger clusters, resulting in a smaller number of keyframes for the motion. For better accuracy in the constructed motion, a smaller σ value must be used. We have tested a different σ range for high- and low-dynamic motions. Low-dynamic motions can have a greater value of σ, since there is no rapid change in the motion. Our tests show that σ ∈ [7, 10] give satisfactory signal-to-noise ratios, between 35 - 55 dB, for low-dynamic motions. As shown in Figure 4.1c and Figure 4.1d, for values of σ greater than 3, the error in reconstructed motion increases significantly, resulting in the loss of fast changes in the motion. Thus, high-dynamic motions become very unnatural and foot-skating problems start to appear. We recommend using σ ≤ 3 for high-dynamic motions to ensure satisfactory visual quality.
CHAPTER 4. RESULTS AND EVALUATION 26
(a) (b)
(c) (d)
Figure 4.1: a-b. Effect of dimension reduction (k) on the overall error, for high-dynamic and low-high-dynamic motions.
c-d. Effect of parameter σ on the overall error, for high-dynamic and low-dynamic motions.
4.3
Motion Curve Representation
We have also compared our algorithms with the two prior approaches, when the body coordinate space is used, instead of Euler angles.Table 4.1 shows the results when the three approaches are used. In the body coordinate space, each joint is represented by 3 DOFs, yielding a total of 90 DOFs. In the Euler angle space, a
CHAPTER 4. RESULTS AND EVALUATION 27
DOF is present only if the human body is capable of rotating that joint in that dimension, with a total of 62 DOFs. Because of the greater DOFs used in body coordinate space, better error rate is observed with this representation.
4.4
Performance
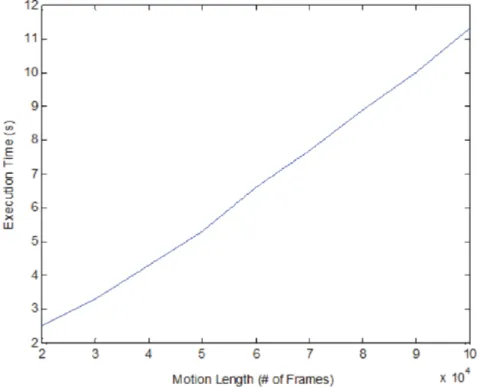
Figure 4.2 includes the running times for different size of motions. As shown in Figure 4.2, for a motion of 100 000 frame motions, with 120 captured frames/second, the process takes close to 11 seconds in MATLAB, using a In-tel Core2 Quad 2.4 Ghz processor. Figure 4.2 shows that the running time of the method increases linearly with respect to the number of frames, and the method can be used effectively with a window of less than 20 000 frames. Thus, we can conclude that the method can also be used effectively in real-time solutions.
Figure 4.2: Keyframe extraction execution time of our method for different size of motions
CHAPTER 4. RESULTS AND EVALUATION 28
4.5
Applications
Our proposed solution can be used in the scope of a variety of applications. One of the most suitable applications is as a tool for motion editing: our solution will allow the user to manually edit the motion by automatically selecting relevant keyframes. Kwon and Lee use keyframes of motion capture data to incorporate rubber-like exaggeration to motion capture sequences [16]. Witkin and Popovic use keyframes of motion sequences data together with given constraints, to warp the original animation [30]. Boulic et al. use lowpass and bandpass pyramids to blend motion capture sequences using their keyframes [13]. Our solution can thus be used as a tool to improve these solutions by detecting keyframes in a motion automatically.
The second application of our approach is as a tool in motion capture data compression. Motion capture compression methods require a means of detecting the importance of frames in a motion capture sequence, to correctly capture the significant parts of the motion and compress the rest of the information with a lossy compression scheme [10] [3]. Such a metric to capture the significance in motion can be constructed using our method.
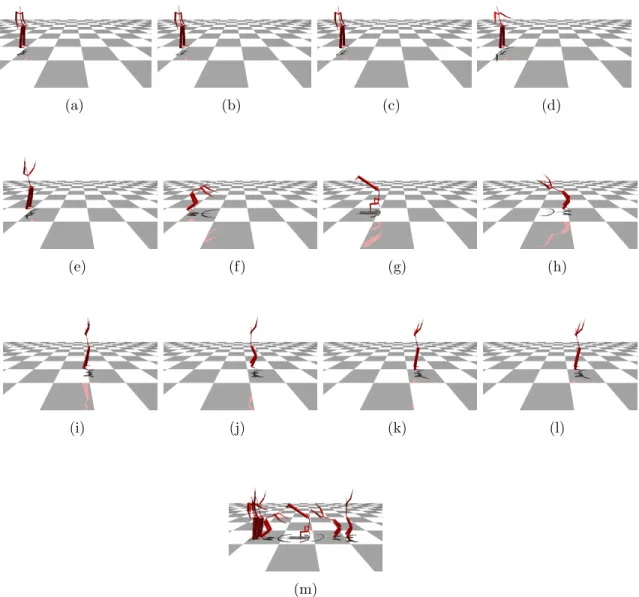
Another possible application of our method is a tool for thumbnail generation of motion capture sequences. In a motion capture database with a large number of motions, a desired task would be to have previews of motions available as thumbnails. These thumbnails can be used by database queries, or for browsing with a quick preview of motion capture sequences. In Figure 4.3, we provide keyframes and the generated thumbnail for a flip motion, based on extraction of 12 keyframes from the original motion and concatenation of these into a single thumbnail image.
CHAPTER 4. RESULTS AND EVALUATION 29
(a) (b) (c) (d)
(e) (f) (g) (h)
(i) (j) (k) (l)
(m)
Figure 4.3: Keyframes of a flip motion(a-l) and the thumbnail(m) generated from the set of keyframes
Chapter 5
User Tests and Experiments
Evaluation of keyframe extraction results is difficult. In order to evaluate our results, we have used a number of techniques in chapter 4 such as calculating mean squared error and PSNR. Although these values quantify our results and allow us to make comparisons, the comparison for ”quality” cannot be based solely on these numbers.
We believe that output of motion capture data is used by both expert and novice users. Expert users like animators may use them in motion editing or re-targetting, whereas a novice user may inadvertently play with a motion capture sequence in computer games. Conducting a user test will allow us to include opinions of users from different kinds of backgrounds during the evaluation pro-cess.
We have listed some empirical values for extraction parameters (σ and k) in section 4.2. Selection of these values and comparison against other known methods were based on the numerical analyses by Halit et. al. [11]. Extra handling of contact points were introduced in section 3.3. This also requires a number of tests, in order to prove that this new method works as expected.
We would like to go beyond numerical analysis to show the quality of our results, so we have conducted a number of user tests. After coupling the results of
CHAPTER 5. USER TESTS AND EXPERIMENTS 31
user tests together with our mathematical comparisons, we may be more confident on the efficiency and quality of our method.
We have devised three different test cases. First user test will be to eval-uate our novel keyframe extraction method against other well known keyframe extraction methods. Second test case will evaluate our selection keyframe extrac-tion parameters. Third test case will evaluate the quality of our contact point handling method.
Each test case will include three different motions. Both low-dynamic and high-dynamic motions were selected for each case to ensure the testing of every possible motion type. We will evalute the output of the user tests through a well-known method called paired two-sampled t test. Screenshot summaries of motions used in the user test can be found in Appendix A.
For every test there were 20 participants, 13 of the participants were male. The average age of the users was 23. 15 of the participants had an expert computer background and the rest of them were novice users.
We have developed a system where users can see each group of motions to-gether side by side, and then rate the quality of each motion from 1 to 10, 10 being the best avaliable quality.
5.1
Test Cases
5.1.1
Test Case 1: Different Extraction Methods
The purpose of this test is to evaluate different keyframe extraction methods with each other. We would like to know how close we can generate a motion to its original.
Test Procedure
CHAPTER 5. USER TESTS AND EXPERIMENTS 32
and walking. For each motion we have applied three different keyframe extraction methods. Frame decimation and curve simplification were selected as the other two methods. We requested the user to rate four motions: the original motion from the motion capture database, motion generated by keyframes extracted by our method, decimation and simplification. We have selected motions which were compared in Table 4.1. We forced every method to select the same number of keyframes, and then generated the motions from these sets of keyframes.
Test Hypotheses:
1. Quality of the original motion will be greater than or equal to any generated motion.
2. Quality of the motion generated by decimation will be greater than or equal to motion generated by our method and simplification. This is because deci-mation traverses through all combinations to find the best possible keyframe set.
3. Quality of the motion generated by our method should be greater than or equal to motion generated by simplification method.
Test Results:
Response of each user for the basketball motion is given in Figure 5.1. Mean difference between average quality and p-test analysis is given in Table 5.1. Each of the methods used 559 keyframes out of a total 4905 frames to construct the original motion. Playing basketball was selected as a high-dynamic motion.
CHAPTER 5. USER TESTS AND EXPERIMENTS 33
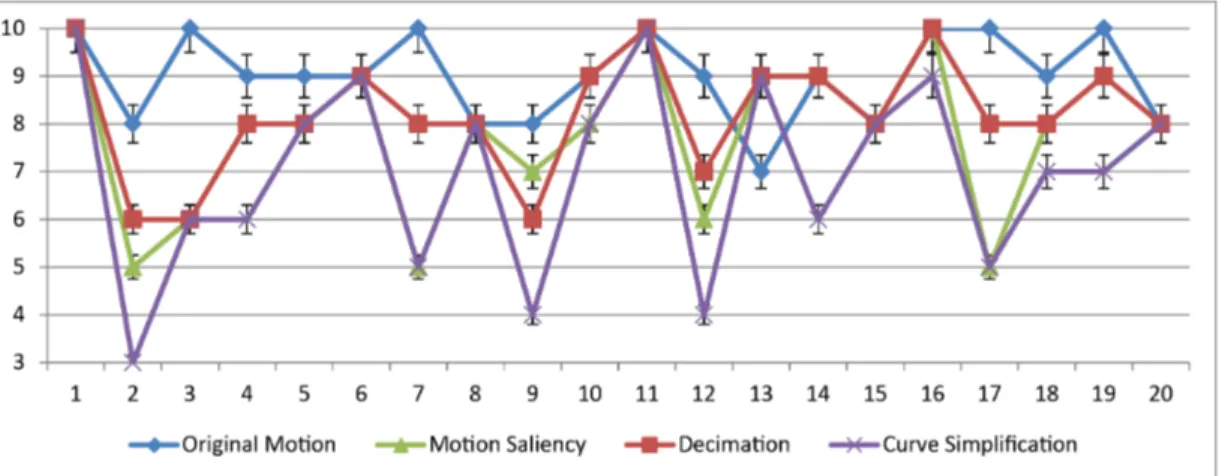
Figure 5.1: Method comparison user test on playing basketball motion.
Table 5.1: Statistical Results of testing different methods on playing basketball motion.
Mean Diff./p-value Saliency Decimation Simplification Original 1.2/0.004 0.8/0.005 2/0.0002 Saliency - -0.4/0.044 0.8/0.002 Decimation - - 1.2/0.0002
For the basketball motion, all hypotheses were valid. Every generated motion is significantly different and worse in quality than the original motion according to Table 5.1. Motion generated by the decimation algorithm is significantly better (p = 0.04) than the motion generated by our method. Lastly, motion from our method is significantly better (p = 0.002) than the motion of the simplification method.
Response of each user for the boxing motion is given in Figure 5.2. Mean difference between average quality and p-test analysis is given in Table 5.2. Each of the methods used 305 keyframes out of a total 3000 frames to construct the original motion. Boxing was selected as a high-dynamic motion.
CHAPTER 5. USER TESTS AND EXPERIMENTS 34
Figure 5.2: Method comparison user test on boxing motion.
Table 5.2: Statistical Results of testing different methods on boxing motion.
Mean Diff./p-value Saliency Decimation Simplification Original 1.2/0.04 1.2/0.02 1.2/0,07 Saliency - 0/0.5 0/0.5 Decimation - - 0/0.5
In case of boxing motion, first hypothesis is clearly valid, since the original motion is significantly better than every other motion (Table 5.2). Other hy-potheses cannot proved directly from the p-test analysis. But from Table 5.2, it can be seen that average quality of every generated motion is the same. So, we may conclude that none of the algorithms is significantly better than any other algorithm for this motion and hypotheses 2 and 3 can be considered as true.
Response of each user for the walking motion is given in Figure 5.3. Mean difference between average quality and p-test analysis is given in Table 5.3. Each of the methods used 23 keyframes out of a total 800 frames to construct the original motion. Walking was selected as a low-dynamic motion.
CHAPTER 5. USER TESTS AND EXPERIMENTS 35
Figure 5.3: Method comparison user test on walking motion.
Table 5.3: Statistical Results of testing different methods on walking motion.
Mean Diff./p-value Saliency Decimation Simplification Original 0/0.5 0/0.5 0/0.5 Saliency - 0/0.5 0/0.5 Decimation - - 0/0.5
Walking motion had one of the most unexpected results. Average quality reported by the users were exactly the same for all four motions, hence all hy-pothesis are considered true. We have expected that the original motion from the motion capture database to be better in quality, than any of the constructed motions. We believe the reason of the this unique result is because walking mo-tion is very low-dynamic and very cyclic in nature that, if the correct keyframes are selected, constructed motion can be as good as the original motion.
Final Result:
We have tested our method against known keyframe extraction methods for both low-dynamic and high-dynamic motions. Overall, our method was either better than or equal in quality to curve simplification method. Against frame
CHAPTER 5. USER TESTS AND EXPERIMENTS 36
decimation, our method was equal in quality or worse in some cases, which is ac-ceptable considering the heavy computational complexity of the frame decimation algorithm.
5.1.2
Test Case 2: Different Extraction Parameters
The purpose of this test is to evaluate effect of extraction parameters. We would like to know if the suggested values for σ and k given in chapter 4 are valid from the user’s point of view.
Test Procedure
For the second test case, we have selected three motions: playing basketball, walking and performing a flip. For each motion, we have generated motions from two sets of keyframes: one set was extracted using our suggested values and other set was extracted using values outside of our suggested boundaries. We requested the user to rate three motions: the original motion from the motion capture database and the two motions generated using keyframes calculated by our algorithm, but with different extraction parameter values.
Test Hypotheses:
1. Quality of the original motion will be greater than or equal to any generated motion.
2. Quality of the motion generated by keyframes which were selected using our suggested values will be greater than the same motion but with looser extraction parameters.
• High-dynamic motions:
– Suggested values: σ ≤ 3 and 7 ≤ k ≤ 10 – Not Suggested values: σ > 3 and k < 7 • Low-dynamic motions:
CHAPTER 5. USER TESTS AND EXPERIMENTS 37
– Not Suggested values: σ > 10 and k < 7
Test Results:
Response of each user for the basketball motion is given in Figure 5.4. Mean difference between average quality and p-test analysis is given in Table 5.4. Here, we have selected both σ and k outside of our boundaries.
Figure 5.4: Parameter comparison user test on playing basketball motion.
Table 5.4: Statistical Results of testing varying parameters on playing basketball motion.
Mean Diff./p-value Suggested Parameters Not Suggested Parameters Original 0.45/0.22 1.25/0.005
Suggested Parameters - 0.8/0.03
For the basketball motion, we were not able to find a statiscally significant difference between the original motion and the motion with suggested parameters, but original motion was found to be better in terms of average quality. However, the motion with not suggested parameters was significantly worse than both the original motion and the motion with suggested parameters. We may conclude that our hypotheses are true for this motion.
CHAPTER 5. USER TESTS AND EXPERIMENTS 38
Response of each user for the flip motion is given in Figure 5.5. Mean difference between average quality and p-test analysis is given in Table 5.5. Performing a flip was selected as a high-dynamic motion. Here, we have selected only the σ parameter outside of our boundaries.
Figure 5.5: Parameter comparison user test on flip motion.
Table 5.5: Statistical Results of testing varying parameters on flip motion.
Mean Diff./p-value Suggested Parameters Not Suggested Parameters Original 1.4/0.008 2.2/0.00007
Suggested Parameters - 0.8/0.001
According to Table 5.5, original flip motion significantly better than both gen-erated motions, and motion with suggested parameters is still significantly better than the motion generated by ”not suggested” parameters, hence our hypotheses are also valid for this motion.
Response of each user for the walking motion is given in Figure 5.6. Mean difference between average quality and p-test analysis is given in Table 5.6 Here, we have selected both σ and k outside of our boundaries.
CHAPTER 5. USER TESTS AND EXPERIMENTS 39
Figure 5.6: Parameter comparison user test on walking motion.
Table 5.6: Statistical Results of testing varying parameters on walking motion.
Mean Diff./p-value Suggested Parameters Not Suggested Parameters Original 1.0/0.04 1.75/0.004
Suggested Parameters - 0.75/0.03
Results of walking motion is exactly same as the flip motion: both generated motions are significantly worse than the original motion, motion extracted using suggested parameters is significantly better than the motion which does not follow this suggestion.
Final Result:
We have tested low-dynamic and high-dynamic motions to see if the suggested values in chapter 4 were assuring quality in the motions. Users have found motions using our suggested parameters better in quality than the motions generated by parameters outside of these boundaries. We may conclude that our heuristic for the parameters are valid both mathematically and from a user’s point of view.
CHAPTER 5. USER TESTS AND EXPERIMENTS 40
5.1.3
Test Case 3: Contact Point Handling Tests
The purpose of this test is to evaluate our new method of handling contact points. Tests will focus on contacts between the floor and the feet of the subject. We would like to know if the extra handling of contact points actually increase the quality of the generated motion.
Test Procedure
In this last test case, we have selected three motions: playing basketball, walking and dancing. For each motion, we have generated motions from two sets of keyframes: one set was extracted using our contact point handling method and other set was extracted using the regular motion saliency method. We requested the user to rate three motions: the original motion from the motion capture database and two motions generated using keyframes calculated by our algorithm, but one of them employing contact point handling steps mentioned in section 3.3. Using the contact handling method, we were able to produce the same mean squared error with less number of keyframes.
Test Hypotheses:
1. Quality of the original motion will be greater than or equal to any generated motion.
2. Quality of the motion generated by keyframes which were selected using contact point handling method will be better than a motion generated by keyframes which were select using the regular motion saliency method.
Test Results:
Response of each user for the basketball motion is given in Figure 5.7. Mean difference between average quality and p-test analysis is given in Table 5.7. Mo-tion with contact point handling have selected 300 keyframes and had a mean squared error of 0.0128 compared to the original motion. Motion generated by regular saliency had 390 keyframes with a mean squared error of 0.0129.
CHAPTER 5. USER TESTS AND EXPERIMENTS 41
Figure 5.7: Contact Handling comparison user test on playing basketball motion.
Table 5.7: Statistical Results of testing contact handling on playing basketball motion.
Mean Diff./p-value Contact Handling Regular Saliency Original 0.6/0.21 1.55/0.004 Contact Handling - 0.95/0.043
We were not able to find a significant difference between the original and the contact handling motion, however both of these motions were significantly better than the motion which employs regular saliency. Our hypotheses were valid for this test motion.
Response of each user for the dancing motion is given in Figure 5.8. Mean difference between average quality and p-test analysis is given in Table 5.8. Danc-ing was selected as a high-dynamic motion. Motion with contact point handlDanc-ing have selected 126 keyframes and had a mean squared error of 0.0092 compared to the original motion. Motion generated by regular saliency had 143 keyframes with a mean squared error of 0.00926.
CHAPTER 5. USER TESTS AND EXPERIMENTS 42
Figure 5.8: Contact Handling comparison user test on dancing motion.
Table 5.8: Statistical Results of testing contact handling on dancing motion.
Mean Diff./p-value Contact Handling Regular Saliency Original 0.5/0.22 1.45/0.007 Contact Handling - 0.95/0.013
Results of basketball motion can also be derived for the dancing motion in light of the information in Table 5.8. We conclude that the hypotheses were true for this motion.
Response of each user for the walking motion is given in Figure 5.9. Mean difference between average quality and p-test analysis is given in Table 5.9. Both generated motions had 23 keyframes. Mean squared error for the contact point handling enabled motion was 0.0015 and the other motion’s error was 0.0001.
CHAPTER 5. USER TESTS AND EXPERIMENTS 43
Figure 5.9: Contact Handling comparison user test on walking motion.
Table 5.9: Statistical Results of testing contact handling on walking motion.
Mean Diff./p-value Contact Handling Regular Saliency Original 0.9/0.000001 1.65/0.008 Contact Handling - 0.75/0.039
Different from previous two motions, both generated motions were signifi-cantly worse than the original motion. Motion with contact handling is still significantly better motion with regular saliency, despite the fact the mathemat-ically, motion generated by regular saliency is better. Hence for the last motion, our hypotheses hold accurately.
Final Result:
We have tested low-dynamic and high-dynamic motions to see if the our novel method of handling contact points in chapter 4 was increasing the quality in generated motions. Users have answered this positively through three different motions, all of which resulted in significantly higher average quality, when our new method is applied. We have also come up with a new result from the walking motion that, that mathematical comparison cannot always be directly correlated with user’s opinion of quality, which is the most important reason for conducting
CHAPTER 5. USER TESTS AND EXPERIMENTS 44
user tests.
5.2
Overall Evaluation of User Tests
We have designed three test cases to test different aspects of our method. We have developed an application system which allowed users to rate motions from 1 to 10. We have listed a number hypotheses for each test case, we were able to justify them all through our results in user tests.
After the user tests, we were able to compare our method against well known keyframe extraction methods and found that our method performs just as good as these methods. There were a few exceptions where the Frame Decimation algorithm was better compared to our algorithm, however this was expected con-sidering the computational complexity of the Decimation method.
The suggested values of parameters in chapter 4 and by Halit et. al. [11], were also found to be assuring quality in the generated motions. We have found that both of the parameters play a siginificant role in the extraction algorithm and if these parameters are selected incorrectly, we might not achieve expected results.
Our novel method of contact point handling was found successful by the users. All of the motions in the test performed better with less number of keyframes compared to the regular saliency method.
As a whole, we are more confident to say that we have devised a method that is on par in terms of quality with other keyframe extraction methods, still having a complexity of O(n) after addition of handling contact points.