GENE EXPRESSION PROFILING OF HEDGEHOG PATHWAY
GENES IN EPITHELIAL CANCERS
A THESIS SUBMITTED TO
THE DEPARTMENT OF MOLECULAR BIOLOGY AND GENETICS AND THE INSTITUTE OF ENGINEERING AND SCIENCE OF
BILKENT UNIVERSITY
IN PARTIAL FULFILLMENT OF THE REQUIREMENTS FOR THE DEGREE OF MASTER OF SCIENCE
BY
ÖZLEM AKILLI ÖZTÜRK SEPTEMBER 2006
ii
I certify that I have read this thesis and that in my opinion it is fully adequate, in scope and in quality, as a thesis for the degree of Master of Science.
Assoc. Prof. Işık G. YULUĞ
I certify that I have read this thesis and that in my opinion it is fully adequate, in scope and in quality, as a thesis for the degree of Master of Science.
Asst. Prof. Özlen KONU
I certify that I have read this thesis and that in my opinion it is fully adequate, in scope and in quality, as a thesis for the degree of Master of Science.
Assoc. Prof. Hilal ÖZDAĞ
Approved for the Institute of Engineering and Science
Prof. Dr. Mehmet Baray Director of Institute of Engineering and Science
ABSTRACT
GENE EXPRESSION PROFILING OF HEDGEHOG PATHWAY GENES IN EPITHELIAL CANCERS
ÖZLEM AKILLI ÖZTÜRK M. Sc. in Molecular Biology and Genetics
Supervisor: Assoc. Prof. Işık G. Yuluğ September 2006, 127 Pages
The Hedgehog (Hh) signaling pathway has been investigated in many cancer types and shown to have important effects, but not effectively studied in breast, colon and liver cancers. In this study, gene expression profile of BCL2, SHH, SMO, IHH, PTCH1, GLI1, GLI2 and GLI3 were analyzed in 15 breast, 14 colon, and 15 hepatocellular carcinoma (HCC) cell lines and 29 primary breast tumor samples and three matched normal tissue sample pools by quantitative real-time RT-PCR. Breast cell lines have different levels of target gene expression in the Hh pathway, such that this pathway is activated only in some of the breast carcinoma cell lines possibly through a ligand-independent pathway. In all the breast cancer cell lines studied, PTCH1, SMO, GLI3 and BCl2 had high expression. Expression profiles of the target genes predicted the estrogen receptor status correctly in 93% of the breast cell lines studied. In HCC cell lines, Hh pathway gene expression profile differentiates the poorly differentiated HCC cell lines from well differentiated ones in Discriminant Function Analysis (DFA) perfectly. High SMO and IHH expressions have been found to be markers for aberrant Hh pathway activity in the well differentiated HCC cell lines. In colon cancer cell lines deregulated expression profile among the genes were observed. In primary breast tumor samples, there was a very strong prediction for ER status of the samples with the expression of the genes included in this study.
This is the first comprehensive study that shows the transcriptional gene expression profiles of the main target genes of the Hh pathway in cancer cell lines and breast cancer tissue samples
iv
ÖZET
EPİTEL KANSERLERDE HEDGEHOG YOLAĞI GENLERİNİN GEN İFADE
PROFİLİ
ÖZLEM AKILLI ÖZTÜRK
Master Tezi, Moleküler Biyoloji ve Genetik Bölümü Doç. Dr. Işık G.Yuluğ
Eylül 2006, 127 Sayfa
Hedgehog (Hh) sinyal yolu birçok kanser tipinde incelenmiş ve önemli etkileri olduğu gösterilmiştir ama meme, kolon ve karaciğer kanserlerinde kapsamlı olarak çalışılmamıştır. Bu çalışmada BCL2, SHH, SMO, IHH, PTCH1, GLI1, GLI2 ve GLI3 gen ifadesi profili 15 meme, 14 kolon ve 15 hepatoselüler karsinom (HSK) hücre hattında, 29 primer meme tümörü örneğinde ve 3 eşleştirilmiş normal doku örneği havuzunda nicel gerçek zamanlı RT-PCR ile analiz edilmiştir. Meme hücresi hatlarının Hh yolundaki hedef gen ifadesi düzeyi farklıdır ve bu yol sadece bazı meme karsinomu hücre hatlarında muhtemelen liganddan bağımsız bir yolla aktive edilir. Çalışılan tüm meme kanseri hatlarında PTCH1, SMO, GLI3 ve BCL2 ifadesi yüksek bulunmuştur. Hedef genlerin ifade profilleri çalışılan meme hücresi hatlarının %93’ünde estrojen reseptörü durumunu doğru tahmin etmiştir. HSK hücre hatlarında Hh yolu gen ifadesi profili iyi farklılaşmamış HSK hücre hatlarını iyi farklılaşmış olanlardan Ayırdedici Fonksiyon Analizi (DFA) kullanıldığında kusursuz olarak ayırmıştır. Yüksek SMO ve IHH ifadelerinin iyi farklılaşmış HSK hücre hatlarında normal dışı Hh yolu aktivitesi için belirteçler olduğu bulunmuştur. Kolon kanseri hücre hatlarında bazı genler için düzenlemesi bozulmuş ifade profili gözlenmiştir. Primer meme tümörü örneklerinde örneklerin ER durumunun öngörülmesi ile bu çalışmaya dahil edilen genlerin ifadesi arasında çok kuvvetli bir ilişki bulunmuştur.
Bu çalışma kanser hücre hatları ve meme kanseri doku örneklerinde Hh yolunun ana hedef genlerinin transkripsiyonel gen ifadesi profillerini gösteren ilk kapsamlı çalışmadır.
vi
ACKNOWLEDGEMENTS
First of all, I would like to thank Assoc. Prof. Işık G. YULUĞ for her valuable supervision during my study. She supported me both theoretically and morally during my studies in MBG Department of Bilkent University.
I would like to thank Asst. Prof. Özlen Konu for her instructive comments in statistical analysis, and supporting me during graduate life at Bilkent.
I would like to thank deeply to Bâlâ for sharing her experience and knowledge regarding Real-Time RT-PCR and her valuable friendship.
I would like to thank Murat and İsmail for sharing their valuable senior project study with me, and for helping me in primer design.
I would like to express my special thanks to the Scientific and Technical Research Council of Turkey and the Turkish Association for Cancer Research and Control, Terry Fox Programme for their financial support.
I would like to thank deeply to my friends, Fatma, Bahar, and Aslı for sharing their valuable time, and encouraging me and I wish them best luck and happiness in their lives. I also would like to thank all members of the MBG Department of Bilkent University.
I would like to thank deeply to efulim, and to dost for their support in every step of my life.
Of course, my deepest gratitudes go to my family, who have been far away from me for 7 years, but I always felt that they were near me. I thank them for their love and support.
TABLE OF CONTENTS
SIGNATURE PAGE
ii
ABSTRACT
iii
ÖZET
iv
ACKNOWLEDGEMENTS
vi
TABLE OF CONTENTS
vii
LIST OF FIGURES
xii
LIST OF TABLE
xiv
ABBREVIATIONS
xv
CHAPTER 1. INTRODUCTION
1
1.1. EPITHELIAL CANCERS 1
1.1.1. BREAST CANCER 2
1.1.1.1. Pathology of Breast Cancer 3
1.1.1.1.1. Ductal Carcinoma In Situ 4
1.1.1.1.2. Lobular Carcinoma In Situ 4
1.1.1.1.3. Infiltrating Ductal Carcinoma 5
1.1.1.1.4. Infiltrating Lobular Carcinoma 6
1.1.1.1.5. Invasion and Metastasis 6
1.1.1.2. Genetics of Breast Cancer 7
1.1.1.3. Signaling Pathways in Breast Cancer 9
1.1.2. HEPATOCELLULAR CARCINOMA 10
1.1.2.1. Pathology of Hepatocellular Carcinoma 10 1.1.2.2. Genetics of Hepatocellular Carcinoma 11 1.1.2.3. Signaling Pathways in Hepatocellular Carcinoma 13
viii
1.1.3. COLORECTAL CANCER 13
1.1.3.1. Genetics of Colorectal Cancer 13
1.1.3.2. Signaling Pathways in Colorectal Cancer 15
1.2. HEDGEHOG SIGNALING PATHWAY 17
1.2.1. Hedgehog Signaling Pathway and the Genes 17
1.2.2. Hedgehog Signaling in Development 21
1.2.3. Hedgehog Signaling in Mammary Gland Development 24
1.2.4. Hedgehog Signaling and Cancer 26
1.2.5. Hedgehog Signaling and Breast Cancer 30
1.3. MEASUREMENT OF GENE EXPRESSION WITH
QUANTITATIVE REAL TIME RT-PCR 31
1.3.1. Detection Chemistries 33
1.3.2. Quantification Strategies 34
1.3.3. Normalization 36
1.3.4. Melt Curve Analysis 36
1.4. AIM AND STRATEGY 37
CHAPTER 2. MATERIALS AND METHODS
39
2.1. TISSUE CULTURE 39
2.1.1. Cryopreservation of Cell Lines 41
2.1.2. Cell Line Culturing 41
2.1.3. Subculturing the Cells 42
2.1.4. Preparation of Cell Pellets 42
2.1.5. Tumor Samples 42
2.3. cDNA PREPARATION 44
2.4. OLIGONUCLEOTIDES 45
2.5. REVERSE TRANSCRIPTION POLYMERASE
CHAIN REACTION (RT-PCR) 46
2.6. QUANTITATIVE REAL TIME RT-PCR 46
2.7. AGAROSE GEL ELECTROPHORESIS 48
2.8. SOLUTIONS AND BUFFERS 49
2.9. STATISTICAL ANALYSIS 49
2.9.1. Cluster Analysis 50
2.9.2. Pearson Correlation 50
2.9.3. Multidimensional Scaling (MDS) 50
2.9.4. Discriminant Function Analysis 51
2.9.5. Mann Whitney Test 51
CHAPTER 3. RESULTS
52
3.1. RNA INTEGRITY 52
3.2. FIRST STRAND cDNA SYNTHESIS 52
3.3. MELT CURVE ANALYSIS 53
3.4. STANDARD CURVES AND AMPLIFICATION EFFICIENCIES 55
x
3.6. BREAST CARCINOMA CELL LINES 62
3.6.1. Expression Status of the Hh Pathway Target Genes 63
3.6.2. Hierarchical Cluster Analysis 64
3.6.3. Pearson Correlation Analysis 65
3.6.4. Multidimensional Scaling (MDS) 66
3.6.5. Discriminant Function Analysis 68
3.7. HEPATOCELLULAR CARCINOMA CELL LINES 69
3.7.1. Expression Status of the Hh Pathway Target Genes 70
3.7.2. Hierarchical Cluster Analysis 71
3.7.3. Pearson Correlation Analysis 72
3.7.4. Multidimensional Scaling (MDS) 73
3.7.5. Discriminant Function Analysis 75
3.8.COLON CARCINOMA CELL LINES 76
3.8.1. Expression Status of the Hh Pathway Target Genes 76
3.8.2. Hierarchical Cluster Analysis 77
3.8.3. Pearson Correlation Analysis 78
3.8.4. Multidimensional Scaling (MDS) 79
3.9. PRIMARY BREAST TUMOR SAMPLES 81
3.9.1. Expression Status of the Hh Pathway Target Genes 82
3.9.2. Hierarchical Cluster Analysis 83
3.9.3. Pearson Correlation Analysis 83
3.9.4. Multidimensional Scaling (MDS) 84
3.9.5. Discriminant Function Analysis 86
3.9.6. Mann Whitney Test 87
4.1 EXPRESSION ANALYSIS IN BREAST CARCINOMA CELL LINES 89
4.2 EXPRESSION ANALYSIS IN HEPATOCELLULAR
CARCINOMA CELL LINES 93
4.3 EXPRESSION ANALYSIS IN COLON CARCINOMA CELL LINES 96
4.4 EXPRESSION ANALYSIS IN PRIMARY BREAST
TUMOR SAMPLES 99
CHAPTER 5. FUTURE PERSPECTIVES
105
REFERENCES
109
APPENDICES
123
APPENDIX A Quantitative Real Time RT-PCR Ct Values
for Breast Carcinoma Cell Lines 123
APPENDIX B Quantitative Real Time RT-PCR Ct Values
for Hepatocellular Carcinoma Cell Lines 124
APPENDIX C Quantitative Real Time RT-PCR Ct Values
for Colon Carcinoma Cell Lines 125
APPENDIX D Quantitative Real Time RT-PCR Ct Values
xii
LIST OF FIGURES
Figure 1.1 Anatomy of the breast 2
Figure 1.2 Major hepatocarcinogenesis pathways defined by genetics
alterations with clinical parameters 12 Figure 1.3 Adeno-carcinoma sequence for colorectal cancer 15 Figure 1.4 Schematic representation of a colon crypt and proposed model
for polyp formation 16
Figure 1.5 Hedgehog Signaling Pathway 18
Figure 1.6 Synthesis of Hedgehog ligands in the signaling cells 19 Figure 1.7 Upstream regulation of the Gli transcription factors and their
individual and combined roles in regulating Hh target
gene expression 20
Figure 1.8 Hedgehog network model in virgin mice duct and
alveolar development in pregnancy and lactation 25
Figure 1.9 Amplification Curve 32
Figure 2.1 pUC Mix Marker, 8 48
Figure 3.1 GAPDH amplified cDNA samples 53
Figure 3.2 Melt curve graph 54
Figure 3.3 Amplification efficiency graphs of the gene specific primers 56 Figure 3.4 q-rt-RT-PCR amplification graph and the melt curve 61 Figure 3.5 Selected q-rt-RT-PCR agarose gel electrophoresis photograph 62 Figure 3.6 Expression profile of the Hedgehog pathway target genes
in human breast carcinoma cell lines 64 Figure 3.7 Two-dimensional Cluster Analysis of genes in human
breast carcinoma cell lines 65
Figure 3.8 Gene-based MDS Analysis for breast carcinoma cell lines 67 Figure 3.9 Cell-line based MDS Analysis for breast carcinoma cell lines 68 Figure 3.10 Expression profile of the Hedgehog pathway target genes
Figure 3.11 Two-dimensional Cluster Analysis of genes in human
HCC cell lines 72
Figure 3.12 Gene-based MDS Analysis for HCC cell lines 74 Figure 3.13 Cell-line based MDS Analysis for HCC cell lines 74 Figure 3.14 Expression profile of the Hedgehog pathway target genes
in human colon carcinoma cell lines 77
Figure 3.15 Two-dimensional Cluster Analysis of genes in human
colon carcinoma cell lines 78
Figure 3.16 Gene-based MDS Analysis for colon cancer cell lines 80 Figure 3.17 Cell-line based MDS Analysis for colon cancer cell lines 80 Figure 3.18 Expression profile of the Hedgehog pathway target genes
in primary breast tumor samples 82
Figure 3.19 Two-dimensional Cluster Analysis of genes in
primary breast tumor tissues 83
Figure 3.20 Gene-based MDS Analysis for primary breast tumor tissues 85 Figure 3.21 Cell-line based MDS Analysis for primary breast tumor tissues 85
xiv
LIST OF TABLES
Table 1.1 Genes involved in breast carcinogenesis 9
Table 1.2 Vertebrate Hedgehog Functions 23
Table 1.3 Animal models of Hedgehog-dependent tumors 27
Table 1.4 Mutations in the PTCH1 gene 28
Table 1.5 Hedgehog-dependent primary human tumors 29 Table 2.1 Breast carcinoma cell line information 40 Table 2.2 Hepatocellular carcinoma cell line information 40 Table 2.3 Colon carcinoma cell line information 41 Table 2.4 Primary breast tumor sample information 43
Table 2.5 Oligonucleotide sequences 45
Table 2.6 Breast normal sample pool information 47 Table 3.1 Amplification efficiencies of the gene specific primers 60 Table 3.2 Fold expression values of the Hh pathway genes in breast
carcinoma cell lines 63
Table 3.3 Pearson Correlation for human breast carcinoma cell lines 66 Table 3.4 DFA of human breast carcinoma cell lines based on ER status 69 Table 3.5 Fold expression values of the Hh pathway genes in HCC cell lines 70 Table 3.6 Pearson Correlation for human HCC cell lines 73 Table 3.7 DFA of human HCC cell lines based on their differentiation status 75 Table 3.8 Fold expression values of Hh pathway genes in colon
carcinoma cell lines 76
Table 3.9 Pearson Correlation for human colon carcinoma cell lines 79 Table 3.10 Fold expression values of the Hh pathway genes in primary
breast tumor samples 81
Table 3.11 Pearson Correlation for primary breast tumor tissues 84 Table 3.12 DFA of primary breast tumor tissues based on their ER status 86 Table 3.13 DFA of primary breast tumor tissues based on their grade status 87 Table 3.14 Mann-Whitney test for primary breast tumor tissues
ABBREVIATIONS
ACTB Actin, beta
APC Adenomatosis Polyposis Coli
A.T. Annealing Temperature
bp Base Pairs
BCC Basal Cell Carcinoma
BCL2 B-cell CLL/lymphoma 2
BFB Bromophenol Blue BRCA Breast Cancer
BMP Bone Morphogenetic Protein
BWS Beckwith-Wiedemann Syndrome
cDNA Complementary DNA
CHEK CHK checkpoint homolog (S. pompe)
Ci Cubitus Interruptus
CNS Central Nervous System
COS2 Kinesin-related protein Costal 2
CP Crossing Point
Ct Cycle Threshold ddH2O Double distilled water DCIS Ductal Carcinoma In Situ
DEPC Diethylpyrocarbonate
DFA Discriminant Function Analysis
DHH Desert Hedgehog (Drosophila)
DISP Dispatched (Drosophila)
DMEM Dulbecco’s Modified Eagle’s Medium
DMSO Dimethyl Sulfoxide
DNA Deoxyribonucleic Acid
dNTP Deoxyribonucleotide triphosphate
dsDNA double-stranded DNA
xvi
EDTA Diaminoethane Tetra-acetic Acid
EGF Epidermal Growth Factor
ERBB2 v-erb-b2 Erythroblastic Leukemia Viral Oncogene homolog 2, neuro/glioblastoma derived oncogene homolog (avian)
ER Estrogen Receptor
EtBr Ethidium Bromide
EXT Exostoses Protein Family
FAM 6-carboxyfluorescein
FAP Familial Adenomatous Polyposis
FBS Fetal Bovine Serum
FGF Fibroblast Growth Factor
FRET Fluorescent Resonance Energy Transfer
Fu Serine/Threonine Kinase Fused
GAPDH Glyceraldehyde-3-Phosphate Dehydrogenase GLI1 Glioma-Associated Oncogene homolog 1
GLI2 Gli-Kruppel Family Member GLI2
GLI3 Gli-Kruppel Family Member GLI3
HCC Hepatocellular Carcinoma
HBS Hepes Buffered Saline
HBV Hepatis B Virus
HCV Hepatis C Virus
HER2 ERBB2
HGF Hepatocyte Growth Factor
Hh Hedgehog
HIP1 Hedgehog Interacting Protein 1
HMBS Hydroxymethylbilane Synthase
HNF Hepatic Nuclear Factor
HNPCC Hereditary Nonpolyposis Colorectal Cancer
HPE Holoprosencephaly
HSPG Heparin Sulfate Proteoglycan IDC Infiltrating Ductal Carcinoma
IHH Indian Hedgehog homolog (Drosophila)
IGF Insulin-like Growth Factor
ILC Infiltrating Lobular Carcinoma
LA Lobulo-Alveolar
LCIS Lobular Carcinoma In Situ
LOF Loss of Function
LOH Loss of Heterozygosity
MDS Multidimensional Scaling
MIN Microsatellite Instability
MMP Matrix Metallopeptidase MMR Mismatch Repair µg Microgram mg Miligram min Minute µl Microliter ml Mililiter µm Micrometer mm Milimeter µM Micromolar mM Milimolar
MPF Mitosis Promoting Factor
mRNA Messenger RNA
MYC Myelocytomatosis Viral Oncogene homolog (avian) NBCCS Naevoid Basal Cell Carcinoma Syndrome
NOS No Special Type
Oligo(dT) Oligodeoxythymidylic acid
P21/CIP1 Cyclin-dependent Kinase Inhibitor 1A
PBS Phosphate Buffered Saline
xviii
Pg Progesterone
pmol Picomole
PR Progesterone Receptor
Prl Prolactin
PTCH Patched homolog (Drosophila)
PTEN Phosphatase and Tensin homolog PTHrP Parathyroid Hormone-Related Protein q-rt-RT-PCR Quantitative real time RT-PCR
RB1 Retinoblastoma 1
RFU Relative Fluorescence Unit
Rpm Revolutions Per Minute
RT PCR Reverse Transcription PCR
RTK Receptor Tyrosine Kinase
SCLC Small Cell Lung Cancer
SDHA Succinate Dehydrogenase Complex, Subunit A, flavoprotein (Fp)
Sec Second
SHH Sonic Hedgehog homolog (Drosophila)
SMO Smoothened homolog (Drosophila)
SUFU Suppressor of Fused homolog (Drosophila)
TAE Tris-Acetate-EDTA buffer
TBP TATA Box Binding Protein
TDLU Terminal Duct Lobular Unit
TGF-β Transforming Growth Factor-β
Tm Melting Temperature
TP53 Tumor protein p53
Tris Tris (Hydroxymethyl)- Methylamine
TTV Tout-Velu
UV Ultraviolet
VEGF Vascular Endothelial Growth Factor
w/v weight/volume
Wnt Wingless
XC Xylene Cyanol
YO Oxazole Yellow
CHAPTER 1
INTRODUCTION
Cancer is abnormal proliferation of the cells that loss control over the cell growth. Cancers that arise from epithelial surfaces are called carcinoma. If the surface is glandular type of surface then it is called adenocarcinoma. Carcinomas and adenocarcinomas are the most common types of the cancer. They include breast, lung, prostate, intestinal, skin, ovary, kidney, and liver. Cancer develops as a result of loss of control over the mechanisms regulating the normal organ functioning. Signaling pathways are one side of these mechanisms. Hedgehog signaling pathway is one of the developmentally most important pathways with a role in many cancer types. It is important to identify the role of Hedgehog signaling in epithelial cancer progression. Studies up to now have shown that Hh pathway induce cell proliferation in carcinomas. In the future, studying the global gene expression of different types of tumors will allow the identification of expression profiles unique for the epithelial cancers, their stage, and grade, leading to the finding of new targets for the treatment of these cancers.
1.1. EPITHELIAL CANCERS
Carcinoma is the general name given to epithelial cancers. Carcinomas invade surrounding tissues and organs, and may spread to lymph nodes and distal sites of the body. When the carcinoma is not invasive it is called Carcinoma in situ. Carcinomas may have the name of the organ of the origin (pancreas, breast) or the putative cell of the origin (hepatocellular carcinoma).
1.1.1. Breast Cancer
A woman's breast is made up of glands that make breast milk (lobules), ducts (small tubes that connect lobules to the nipple), fatty and connective tissue, blood vessels, and lymph vessels (Figure1.1).
Figure 1.1: Anatomy of the breast. Woman breast is formed by ducts, lobules, fatty and connective tissues [http://www.cancer.org].
Breast cancer is one of the major cancer types women suffer from in the Unites States and Western Europe. After lung cancer, it is the second leading cause of cancer death in women. Nearly 212,920 women in the United States will be found to have invasive breast cancer in 2006 and about 40,970 of them will die from the disease. Right now there are slightly over 2 million women living in the United States who have been treated for breast cancer.
The chance of a woman having invasive breast cancer some time during her life is about 1 in 8. The chance of dying from breast cancer is about 1 in 33. Breast cancer death rates are going down. This decline is probably due to earlier diagnosis and improved treatment of the disease.
Risk factors for breast cancer are age, genetic background, reproductive history, radiation, socio-economic status, place of residence, and ethnicity [Medina, 2005; http://www.cancer.org]. Reproductive history has an important impact on the onset of breast cancer. Early menarche, late menopause, and late age of first pregnancy increase the risk of getting breast cancer [Medina, 2005].
It is thought that breast cancer is a heterogeneous group of diseases with each subtype having its own stable phenotype maintained during tumor progression rather than a single disease with a single tumorigenesis pathway [Mallon et al., 2000; Polyak, 2006]. The most important determinants of these subtypes found are estrogen receptor (ER) and progesterone receptor (PR) status of tumor cells, the amplification and overexpression of the HER2 oncogene, and histologic grade. Considering these features, breast tumors are divided into luminal A, B, and C, HER2 (+), and basal subtypes. Tumor subtypes may reflect the cell of origin of the tumor with ER (-) and ER (+) tumors initiating from the earliest progenitors and more committed transit amplifying cells (cells with more limited proliferative capacity), respectively. In accordance with the proposed existence of subtype specific tumor progression pathways, it is increasingly evident that risk factors are also different for each tumor type [http://www.cancer.org].
1.1.1.1. Pathology of Breast Cancer
Most breast lumps, areas of thickening, are benign; that is, they are not cancer. Benign breast tumors are abnormal growths, but they do not spread outside of the breast and they are not life-threatening. Some benign breast lumps can increase a woman's risk of getting breast cancer. Lumps are formed by fibrocystic changes in most cases. These changes include stromal fibrosis, cyst formation, and adenosis.
Adenomas are also common benign lesions characterized by well-circumscribed benign epithelial elements with a variable amount of stroma.
Epithelial hyperplasia may be one of the initiating steps of breast carcinoma. Atypical hyperplasia is an epithelial proliferation in which some features of ductal carcinoma are seen in epithelial tissues [Beckmann et al., 1997; Mallon et al., 2000].
1.1.1.1.1. Ductal Carcinoma in Situ (DCIS)
It is the most common type of noninvasive breast cancer. Nearly all women with cancer at this stage can be cured. DCIS is a morphologically identifiable, preinvasive malignant proliferation of the breast epithelial cells [Mallon et al., 2000; http://www.cancer.org]. The abnormal cells are contained within the mammary epithelial structures. No invasion of the basement membrane and no infiltration of the breast stroma are apparent. With a true in situ carcinoma, malignant epithelial cells do not have access to the lymphatic or vascular channels present within the breast stroma. Classifications are performed according to the degree of nuclear pleomorphism (often graded on a scale of 1–3), the presence or absence of necrosis, and the mitotic activity. The most characteristic feature of DCIS is that the cells composing the intraluminal proliferation are morphologically similar to each other, but have nuclear abnormalities associated with malignancy.
1.1.1.1.2. Lobular Carcinoma in Situ (LCIS)
LCIS is a neoplastic proliferation of epithelial cells in the terminal duct lobular unit with specific morphological features and therapeutic implications [Beckmann et al., 1997; Mallon et al., 2000]. LCIS is a proliferation of neoplastic, epithelial cells which expand the individual acini of the lobular units involving more than 50% of the acini in a lobular unit. Both LCIS and DCIS are observed more in premenopausal women, suggesting that these lesions regress after menopause and that they are hormone dependent. This idea is supported by the ER positivity of these lesions.
1.1.1.1.3. Infiltrating Ductal Carcinoma (IDC)
IDC is the most common type of breast cancer. It accounts for about 80% of invasive breast cancers [http://www.cancer.org]. If a tumor does not show the morphological features of a special type of invasive carcinoma or the characteristics of invasive lobular carcinoma, it is an IDC. Therefore, it is also called carcinoma of no special type (NOS) [Mallon et al., 2000]. This group of tumors is morphologically heterogeneous. IDC tumors have very variable growth patterns and stromal responses. They are often hard and fibrous. The pattern of infiltration of the edge of the tumor is variable. In some instances these tumors have a well-circumscribed pushing margin which abuts on and distorts the surrounding normal stroma, resulting in a smooth, rounded interface between the tumor and the surrounding tissue. In these instances there is often an associated dense lymphatic infiltrate at the margin. In other cases, the tumor infiltrates the surrounding tissue diffusely enveloping preexisting normal structures in its path, resulting in an irregular infiltrative margin.
The stage is determined by spread of the tumor to the body. However, grade is determined by how the tumor cells appear under the microscope, growth rate of the tumor cells, and the tendency of tumor to spread other parts of the body. There are four stages of breast cancer [http://www.cancer.gov]. If the tumor size is less than 2 centimeters and there is no metastasis, it is a stage I tumor. As it progresses to stage IV, tumor size and metastasis levels increase. In stage IIIB and IV, the metastasis spreads to other parts of the body rather than lymph nodes. As the stage increases, the severity of the disease increases, as well. It is possible to separate IDC into three grades based on the degree of tubule formation, nuclear pleomorphism, and mitotic activity. Each of the three parameters is given a score of 1–3 and the individual scores are then added together. A score of 3–5 indicates Grade 1, 6–7 indicates Grade 2, and 8–9 indicates Grade 3. The first parameter, tubule formation, is assessed on the basis of percentage of the tumor showing distinct tubules: a score of 1 is assigned if 75% or more, a score of 2 if 10–75%, and a score of 3 if less than 10%. Nuclear pleomorphism is the second component. If the nuclei are small, with regular outlines, uniform chromatin, and little variation in size, they are assigned a
score of 1. The cytoplasm of the tumor cells may also show considerable variation, with some cells having little cytoplasm and others having abundant cytoplasm that can be eosinophilic and granular, or foamy and basophilic, or midway between the two. The third parameter is an assessment of the proliferation rate determined by counting the number of mitoses in 10 high-power fields at the periphery of the tumor. The method is standardized for each microscope objective and the tumor scored on a scale of 1–3.
1.1.1.1.3. Infiltrating Lobular Carcinoma (ILC)
ILC is the second most common type of invasive breast carcinoma and accounts for approximately 10% of all invasive breast malignancies [Mallon et al., 2000; http://www.cancer.org]. The cellular morphology of the tumor and the pattern of infiltration are very important in diagnosis. The tumor cells of lobular carcinoma are found in association with foci of typical LCIS and infiltrate in a very characteristic way with one cell behind the other in a defined pattern called the Indian filing pattern. They often form concentric rings around blood vessels and lobules producing a targetoid pattern. In classical lobular carcinoma, the tumor cells are relatively small. They have regular rounded nuclei with dense, evenly staining chromatin. Nucleoli are not prominent. ILC has a higher incidence of multicentricity and bilaterality than IDC and a slightly better overall survival rate than tumors in the NOS category. There are also several other less common types of breast cancer including tubular, mucinous, medullary, papillary, invasive cribriform, and secretory carcinoma.
1.1.1.1.4. Invasion and Metastasis
Breast carcinoma metastasizes more widely and more frequently than other malignant tumors [Mallon et al., 2000]. When this occurs, 95% of the patients so affected die of metastatic disease. Breast carcinoma metastasizes to distant sites by way of the angiolymphatic system. The first lymph nodes to be seeded with tumor
nodes. Distant sites of metastases include the opposite breast, skeletal system, lungs and pleurae, liver, ovaries, adrenal glands, and central nervous system including the leptomeninges and eyes. Lymphovascular channel invasion is used as a pathological prognostic indicator.
1.1.1.2. Genetics of Breast Cancer
Cancer is a genetic disease and breast cancer has all the hallmarks of multistep genetic disease. Progression of breast cancer occurs through the accumulation of various genetic alterations [Beckmann et al., 1997] (Table 1.1). A normal epithelial cell develops into a premalignant atypical cell and after clonal expansion becomes a premalignant lesion called carcinoma in situ. As cells detach from the basement membrane and invade the stroma, the carcinoma becomes invasive [Kenemans et al., 2004]. Gain of function genetic events develop in oncogenes by DNA mutations, rearrangements or amplifications, and loss-of-function mutations in tumor suppressor genes are important molecular events. Mutations in tumors suppressor genes mostly occur in inherited cancers while mutations of oncogenes are mostly observed in sporadic cancer development.
Hereditary breast cancer forms nearly half of familial breast cancer cases [Kenemans et al., 2004]. Most inherited cases of breast cancer have been associated with two genes: BRCA1, which stands for BReast CAncer gene one, and BRCA2, or BReast CAncer gene two [Futreal et al., 1994; Miki et al., 1994; Shattuck et al., 1995; Wooster et al., 1994; Wooster et al., 1995]. The function of these genes is to keep breast cells growing normally and to prevent any cancer cell growth. But when these genes contain abnormalities, or mutations, they are associated with an increased breast cancer risk. Abnormal BRCA1 and BRCA2 genes may account for up to 2-3% of all breast cancers. Women diagnosed with breast cancer that have an abnormal BRCA1 or BRCA2 gene often have a family history of breast cancer, ovarian cancer, or both. Mutations in the cell cycle check point kinase gene (CHEK2) are observed in approximately 5% of all familial breast cancer cases [Kenemans et al., 2004].
However, it is also important to remember that most women with breast cancer have no family history of the disease.
Only 4-10% of breast cancers have a germ line mutation that predispose to breast cancer [Lerebours et al., 2002]. The remaining part is somatic breast cancers resulting from the genetic alterations. 70% of breast cancers are aneuploid, with DNA amplifications in oncogenes or chromosomal deletions in tumor suppressor genes. The consistently mutated tumor suppressor gene in sporadic breast cancer is TP53 with point mutations in approximately 22-34% of the cases. TP53 mutations are observed mostly in ductal carcinoma [Beckmann et al., 1997]. Point mutations are the common form of mutation for the TP53 leading to proteins defective for sequence-specific DNA binding and activation of target genes. TP53 mutation is a rare event in the progress of breast cancer, and it is rarely observed in hereditary breast cancer [Kenemans et al., 2004]. MYC is also altered in the breast cancer. It is amplified and thus overexpressed in approximately 15-20% of breast tumors. MYC may be involved in the early stages of cancer progression since it is a key transcription factor having role in cell growth, differentiation, and apoptosis [Lerebours et al., 2002]. In addition, down regulation of the expression of the RB1 tumor suppressor gene is frequent in breast cancer. Deletions of the chromosomal region containing the RB1 gene, 13q14.1, are found in 25-35% of breast cancers [Lerebours et al., 2002]. Although BRCA1 and BRCA2 mutations are rare in sporadic breast cancers, the down regulation of BRCA1 expression by hyper-methylation is observed [Lerebours et al., 2002]. The respective locus at 17q22 is frequently deleted in sporadic breast cancers. P21 has a role in the regulation of DNA methylation. In the normal cells it prevents DNA methylation. In the cancer cells it loses its control and the level of DNA methylation decreases overall, although at some major genes there is dense methylation [Salisbury, 2001]. P21 itself is under epigenetic control in the breast cancer by histone deacetylation. Beside these, there are many genes that are deregulated in breast cancer. Microarray technology will allow more progress in the understanding of the genetics of breast cancer.
Table 1.1: Genes involved in breast carcinogenesis [Kenemans et al., 2004]
1.1.1.3. Signaling Pathways in Breast Cancer
There is a hypothesis about the cellular origin of cancer in which stem cells are thought to be responsible for cancer progression, since they are quiescent over long periods of time, and could accumulate mutations, and thus when stimulated to proliferate enrich abnormal cell growth [Li et al., 2005; Liu et al., 2005; Woodward et al., 2005]. Normal stem cells and cancer stem cells share some properties that prove this hypothesis, in which self-renewal, the ability to differentiate, active telomerase and anti-apoptotic pathways, anchorage independence and, ability to migrate and form metastasis are important ones. Mammary gland stem cells function in tissue remodeling during cycles of pregnancy, which make them good candidate for the transfer of the mutations to the remodeled tissues. Understanding the signaling pathways involved in the self-renewal of both normal and cancer stem cells is important for anti-cancer therapies [Woodward et al., 2005]. There are several key signaling pathways governing this process in stem cells. These are Wnt/β-catenin, Hedgehog (Hh), transforming growth factor (TGF)-β, PTEN and Bmi signaling
pathways. Deregulation of these pathways is shown to cause mammary tumors in transgenic mice [Li et al., 2005; Liu et al., 2005].
1.1.2. Hepatocellular Carcinoma
The liver plays a central role in the metabolism of an organism. In this organ, several highly-specialized cell types interact by taking over complex and life-essential metabolic functions such as glucose and protein metabolism. Since the liver is made up of different types of cells, different types of tumors can form in the liver [http://www.cancer.org]. Some of these are cancerous and some are benign, and they treated differently. While there are other types of liver cancers, the most common form in adults is called hepatocellular carcinoma (HCC). It begins in the hepatocytes, the main type of liver cell. About 3 out of 4 primary liver cancers are HCC. Hepatocellular carcinoma (HCC) is one of the most common malignant tumors in some areas of the world with an extremely poor prognosis. The major etiologic risk factors for HCC development include toxins (alcohol, aflatoxin B1), androgens and estrogens, hepatitis B virus (HBV) and hepatitis C virus (HCV) infection as well as various inherited metabolic disorders, such as alpha-1-antitrypsin deficiency and hemochromatosis [Blum, 2005].
18,510 new cases of primary liver cancer and bile duct cancer are estimated to be diagnosed in the United States during 2006. It is about twice as common in men as in women. About 16,200 people will die of liver cancer in the United States during 2006. This cancer is many times more common in developing countries in Africa, and East Asia than in the United States. In many of these countries it is the most common type of cancer [http://www.cancer.org].
1.1.2.1. Pathology of Hepatocellular Carcinoma
Hepatocellular carcinoma is heterogeneous both phenotypically and genetically. Assessment of the differentiation grade of hepatocellular carcinomas (HCCs) is important for evaluation of the pathological diagnosis, prognosis and therapeutic
treatment [Ishiyama et al., 2003]. Early well-differentiated tumors are highly proliferative and become less differentiated when they reach 1-1.5 cm. At this stage, HCC cells start to acquire the abilities of angiogenesis, tissue invasion and metastasis. Later on, they become undifferentiated and are able to invade vessels and form extra-hepatic metastases [Bruix et. al., 2004]. This dedifferentiation process is associated with a progressive accumulation of genomic changes including chromosomal gains and losses, as well as p53 mutations [Thorgeirsson et al., 2002]. The comprehensive expression of HNF-3β, HNF-4α, HNF-1α, and C/EBPα corresponds well with differentiated functions and morphology of HCC. Expressions of HNF-4α and HNF-1α among these four transcription factors showed synchronism and had a close relationship with HCC differentiation. HNF-4α and HNF-1α are useful markers to evaluate differentiation of HCC [Ishiyama et al., 2003].
Malignant transformation occurs through a pathway of increased liver cell turnover, induced by chronic liver injury and regeneration in a context of inflammation, immune response, and oxidative DNA damage which cause mutations of various genes and a genetic instability [Blum, 2005].
1.1.2.2. Genetics of Hepatocellular Carcinoma
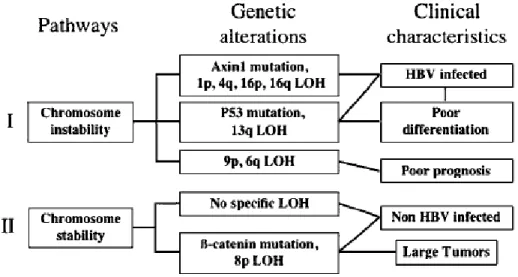
Numerous genetic alterations are accumulated during the progression of HCC. There are mainly two types of genetic alterations of which the first one is genetic alterations specific of hepatocellular tumor risk factors as shown in Figure 1.2 [Laurent-Puig et al., 2006]. It includes integration of hepatitis B virus (HBV) DNA, R249S TP53 mutation in aflatoxin B1-exposed patients, KRAS mutations related to vinyl chloride exposure, hepatocyte nuclear factor 1a, HNF1a, mutations associated to hepatocellular adenomas and adenomatosis polyposis coli, APC, germline mutations predisposing to hepatoblastomas. The second type of genetic alterations are etiological nonspecific, it includes recurrent gains and losses of chromosomes, alteration of TP53 gene, activation of WNT/β-catenin pathway through CTNNB1/β-catenin and axis inhibition protein, AXIN, mutations, inactivation of retinoblastoma and insulin-like growth factor 2 receptor, IGF2R, pathways through inactivation of
RB1, P16 and IGF2R. Based on the presence or the absence of chromosomal instability two pathways of hepatocarcinogenesis have been found as shown in Figure 1.2. Hepatitis B virus and poorly differentiated tumors are related to chromosome instable tumors associated with frequent TP53 mutations, whereas non-HBV and well-differentiated tumors are related to chromosomal stable samples that are frequently β-catenin activated.
Figure 1.2: Major hepatocarcinogenesis pathways defined by genetic alterations with clinical parameters. Lines joining boxes indicate significant correlations [Laurent-Puig et al., 2006].
Beckwith–Wiedemann syndrome (BWS) or in the familial adenomatous polyposis (FAP) are two cancer predispositions leading to hereditary HCC [Laurent-Puig et al., 2006]. FAP is owing to APC germline mutation. Nuclear/cytoplasmic accumulation of the catenin is observed in most hepatoblastomas and sequence analysis of the β-catenin N-terminal domain has revealed interstitial deletions or missense mutations in the GSK3β phosphorylation motif in 48–67% of sporadic hepatoblastoma tumors. Activation of the WNT/β-catenin pathway may be related to axis inhibition protein 2, AXIN2, mutations in other familial cases.
1.1.2.3. Signaling Pathways in Hepatocellular Carcinoma
Dysregulation of growth factors, receptors and their downstream signaling pathway components represent a central pro-tumorigenic principle in human hepatocarcinogenesis. Especially the insulin-like growth factor/IGF-1 receptor (IGF/IGF-1R), hepatocyte growth factor (HGF/MET), wingless (Wnt/β-catenin/FZD), transforming growth factor alpha/epidermal growth factor receptor (TGFα/EGFR) and Transforming Growth Factor β (TGF-β/TGF-β Receptor) pathways contribute to proliferation, anti-apoptosis and invasive behavior of tumor cells.
1.1.3. Colorectal Cancer
Colorectal cancer is the third most common cancer found in men and women in this United States other than skin cancer [http://www.cancer.org]. It is estimated that there will be about 106,680 new cases of colon cancer and 41,930 new cases of rectal cancer in 2006 in the United States. Combined, they will cause about 55,170 deaths.
The death rate from colorectal cancer has been decreasing for the past 15 years. One reason is that there are fewer cases. Thanks to colorectal cancer screening, polyps can be found and removed before they turn into cancer [http://www.cancer.org].
1.1.3.1. Genetics of Colorectal Cancer
Hereditary nonpolyposis colorectal cancer (HNPCC) and familial adenomatous polyposis (FAP) are inherited cancer syndromes that account for approximately five percent of all colon cancers [http://www.cancer.org]. In HNPCC, families typically have at least three members with a history of colorectal cancer, and patients commonly develop cancers at an early age. Patients with FAP also have a strong family history of colon cancer and develop multiple polyps at a young age, some of which ultimately turn malignant if preventive measures are not taken. FAP is caused
by mutations in the APC gene, whereas HNPCC is caused by muttaions in several genes, including MSH2, MLH1, PMS1, PMS2, MSH6, TGFBR2, and MLH3 [http://www.cancer.org].
Due to the accumulation of mutations in a number of oncogenes and tumor suppressor genes transformation of colorectal epithelial cells into the cancer cells occur as shown in Figure 1.3 [Wang et al., 2006]. Approximately 15% of sporadic colorectal cancers are caused by somatic inactivation of mismatch repair (MMR) genes, which leads to a microsatellite instability (MIN) phenotype. Interestingly, a much higher incidence (~85%) of MIN has been found in colorectal cancer patients with HNPCC tumors. The predominant mechanism responsible for the inactivation of MMR in these tumors is epigenetic silencing through promoter methylation with the additional involvement of somatic mutations [Wang et al., 2006].
The tumor suppressor APC was first identified by genetic analysis in patients with FAP. Adenomatous polyposis coli, which is encoded by the FAP locus on chromosome 5, is mutated in most sporadic forms of colon cancer as well. This invariably leads to hyperproliferation of colon crypt cells and to the formation of polyps. K-ras is the well known oncogene functioning in 47-50% of colorectal cancers. When mutated it stimulates the Wnt signaling through suppression of GSK-3β [Wang et al., 2006]. Matrix metalloproteinases have an important role in colon cancer progression. Increased levels of MMP-1, -2, -3, -7, -9, and -13 are found in the colon cancer samples as compared to normal mucosa. MMP may function in the tumor progression not only through ECM degradation but also through liberating growth factors and/or cytokines, suppressing the immune response, and modulating the angiogenesis. In addition, MMP-7 may have a role in EGF receptor activation in colon cancer cells.
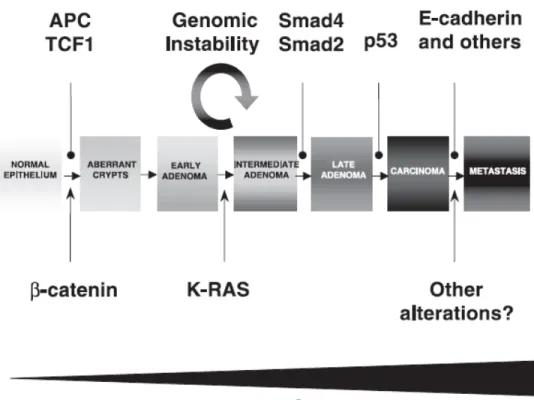
Figure 1.3: The adenoma-carcinoma sequence for colorectal cancer. A mutation in APC or β-catenin results in the activation of the Wnt signaling pathway, triggering tumor formation. Subsequent progression towards malignancy is accompanied by sequential mutations in k-RAS, deletion of chromosome 18q affecting genes encoding SMAD2 and SMAD4, p53, and genes involved in tumor invasiveness such as E-cadherin. Tumor suppressor proteins are represented above the adenoma-carcinoma sequence, whereas oncogenes are depicted below. Increasing levels of nuclear β-catenin accompany tumor progression [Giles et al., 2003].
1.1.3.2. Signaling Pathways in Colorectal Cancer
Stem cells residing in the crypt base of the colon have been thought to be responsible for colon cancer progression since they are the cells providing the balance between asymmetrical cell division and cell proliferation which can be disrupted by several genetic and/or epigenetic alterations (Figure 1.4) [Wang et al., 2006]. Activating
mutations of the Wnt pathway causes 90% of the colorectal cancer [Giles et al., 2003]
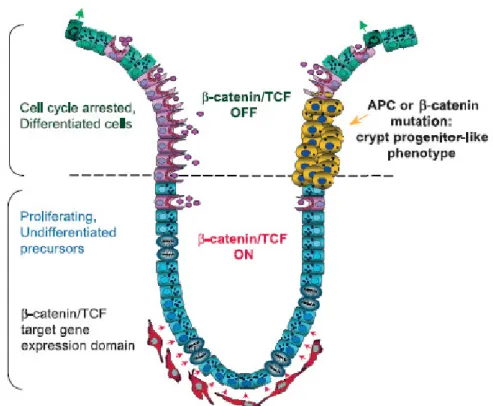
Figure 1.4: Schematic representation of a colon crypt and proposed model for polyp formation. At the bottom third of the crypt, the progenitor proliferating cells accumulate nuclear β-catenin. Consequently, they express β-catenin/TCF target genes. An uncharacterized source of WNT factors likely resides in the mesenchymal cells surrounding the bottom of the crypt, depicted in red. As the cells reach the mid-crypt region, β-catenin/TCF activity is downregulated and this results in cell cycle arrest and differentiation. Cells undergoing mutation in APC or β-catenin become independent of the physiological signals controlling β-catenin/TCF activity. As a consequence, they continue to behave as crypt progenitor cells in the surface epithelium giving rise to aberrant crypt foci [Giles et al., 2003].
1.2. HEDGEHOG SIGNALING PATHWAY
Hedgehogs (Hh) comprise a family of secreted signaling molecules that direct numerous developmental and patterning events in mammalian tissues [Ingham et al., 2001; Taipale et al., 2001]. Both the distribution of Hh molecules and the cellular response to Hh are tightly regulated. Research over the past years has shed light on the complex Hh signaling pathway.
1.2.1. Hedgehog Signaling Pathway and the Genes
The Hh protein family includes Sonic (SHH), Indian (IHH), and Desert (DHH) hedgehogs [Ingham et al., 2001]. The Hh signaling pathway starts with expression of one of these proteins (Figure 1.5). SHH is the predominant signaling molecule in lung, brain and limb development and is the most extensively studied Hh protein in vertebrates. The receptor that SHH binds is called patched (PTCH). PTCH is a 12- pass transmembrane protein. In quiescent cells PTCH catalytically acts on Smoothened (SMO) to inhibit it. In this form a cytoplasmic complex made up from atypical kinesin costal2, Ser/Thr kinase fused, and suppressor of fused (SUFU) favors the repressor form of the GLI transcription factors. Binding of SHH to PTCH inactivates it so that SMO is relieved and COS2/FU/SUFU cannot process the GLI transcription factor family of proteins. SUFU has a role in subcellular localization of GLI proteins. Mutations of SUFU results in a truncated form which is unable to transport GLI proteins, leading to constitutively active Hh pathway [Wetmore, 2003]. Processed GLI proteins result in N-terminal truncated activator and C-terminal truncated repressor fragments [Magliano et al., 2003]. Active GLI transcription factor family proteins translocate to nucleus, bind to Hh target gene promoters and induce their expression [Watkins et al., 2004]. In vertebrates there are three GLI transcription factor family proteins. Glioma-associated oncogene (GLI1) is an onco-protein and positive regulator of the pathway. It is target of itself in the Hh signaling and thought not to be regulated by processing. GLI-Kruppel family member Gli2 (GLI2) and GLI-Kruppel family member Gli3 (GLI3) contain potent repressor
domains and behave both as activators and repressors [Toftgard, 2000]. GLI1 is thought to be the main transcription factor activating the pathway in both development and disease. GLI2 has a role in ectopic expression of the pathway [Wetmore, 2003].
Figure 1.5: Hedgehog Signaling Pathway. [Biljsma et al., 2004]
The active SHH signaling peptide is formed by an autoprocessing reaction that converts a 45 kDa precursor into a 20 kDa signaling peptide that is doubly lipid modified, with palmitate and cholesterol residues at the N and C termini, respectively (Figure 1.6). The 25kDa C-terminal part has the autoproteolytic activity, and the N-terminal domain has the signaling activity. Transport of the ligand requires transmembrane protein Dispatched (DISP) [Ma et al., 2002], which is a 12-pass transmembrane protein with sequence similarity to PTCH. DISP makes Hh ligand available for long range signaling by releasing it from the plasma membrane [Cohen, 2003]. The movement of processed ligand to the responding cell occurs by help of tout-velu (TTV) protein. It belongs to the EXT protein family functioning in heparin sulfate proteoglycan (HSPG) biosynthesis. HSPG may function in the carriage of ligand to the PTCH receptor or moving of it from cell to cell [Cohen, 2003].
SHH is the most broadly expressed hedgehog gene and responsible for the major effects on the development of the brain, spinal cord, axial skeleton, and limbs. IHH is found to be functioning in regulation of cartilage differentiation in the long bones. DHH is expressed mainly in developing germ line and Schwann cells of the peripheral nervous system [Bale, 2003].
Figure 1.6: Synthesis of Hedgehog ligand in the signaling cells [Watkins et al., 2004]. Hedgehog signaling protein is formed by autoprocessing reaction in which Hh precursor protein is converted to dual lipid modified active protein.
Gli transcription factor family is composed of three GLI proteins in vertebrates (GLI1, GLI2, and GLI3). These proteins have several regions with sequence homology, including a centrally located DNA-binding domain with five C2-H2 zinc fingers and a C-terminal transcription activation domain [Ruiz i Altaba, 1999]. These proteins have distinct activities and are not functionally equivalent. Nevertheless, their partial redundancy and often overlapping domains of expression has made it difficult to define precisely their individual features and functions.
GLI3 is the transcription factor that most resembles the Ci transcription factor of Drosophila. Like Ci, it is proteolytically cleaved to form a repressor form in the absence of the ligand. Hh stimulation prevents the cleavage; the repressor effect of GLI3 is relieved [Ruiz i Altaba, 1999], and contributes to target gene activation at least by a direct derepression and possibly by direct transcriptional activation. Hh ligand binding is thought to induce activation of GLI2 mediated transcriptional activity. GLI1 is primary target of the pathway and its expression is regulated by both GLI2 and GLI3. In the absence of GLI2 and GLI3, it can mediate the target gene activation, however in the absence of GLI2 and GLI3 there is no GLI1 expression in the cell [Lipinski et al., 2006] (Figure 1.7).
Figure 1.7: Upstream regulation of the Gli transcription factors and their individual and combined roles in regulating Hh target gene expression [Lipinski et al., 2006]. In the absence of the signal, Gli3 functions as a repressor of the Hh signaling pathway. When there is signaling, repression of Gli3 is relieved, and activator form of the Gli2 becomes active and induces target gene activation.
Several antagonists of Hh signaling have been determined that regulate the Hh pathway during development of certain organs. The most important one of these is hedgehog interacting protein 1 (HIP1). It is also a target gene of the pathway, and
functions in feedback inhibition [Toftgard, 2000]. HIP1 binds to all Hh ligands with high affinity and sequesters them in the target cell membrane, thus preventing the signaling. HIP1 modulates the Hh signaling in vertabrates. Its binding to the ligand attenuates the signal, and allows differential responses to be generated [Chuang et al., 1999]. Ectopic expression of HIP prevents the Hh signaling [Kayed et al., 2005].
1.2.2. Hedgehog Signaling in Development
Cell-cell signaling is a crucial aspect of development and yet just five signal transduction pathways mediate the early development of most animals. These intercellular signaling pathways consist of the Wnt, TGF-β, Notch, RTK (receptor tyrosine kinase) and Hedgehog pathways. The most common target of signaling in development is transcription. Different pathways activate or repress different genes at distinct times and places in the embryo. Signaling pathways have important roles in determining embryonic patterning and cell fate decisions. Analysis of Drosophila development has been vital in elucidating the components and functions of these signaling pathways. Research in vertebrates revealed that vertebrates not only have the same signaling components as Drosophila, but also often the developmental roles of these signaling components are similar to those in Drosophila. Hedgehog signaling was first identified in Drosophila embryo development with a role in segmental patterning.
The three mammalian Hh genes are broadly expressed throughout embryonic development with Shh showing the widest range of expression [Bitgood et al., 1995]. Hedgehog signaling pathway has many crucial functions in the growth, patterning, and morphogenesis of many regions in the vertebrates and insects as shown in Table 1.2. It can act both as a morphogen to induce different cell fates and as a mitogen to regulate cell proliferation. Signaling can be short- and long-range, direct and indirect, and importantly, concentration-dependent, evoking distinct molecular responses at discrete concentration thresholds. It functions in the segmental patterning in the fruit fly embryo, digit patterning in the chick limb bud, and left-right asymmetry of vertebrate embryos. In addition it is crucial in the maintenance of tissue patterns in
adults [Bijlsma et al., 2004; Harfe et al., 2004]. Hh signaling functions in limb and forebrain development by regulating organ size and cell proliferation [Watkins et al., 2004]. Shh is involved in development of CNS [Dahmane et.al, 2001]. Shh acts as a morphogen throughout the dorso-ventral axis of the embryo along the ventral neural tube and induces expression of homeobox genes [Ruizi i Altaba et al., 2004]. It is required for differentiation of floor plate cells and ventral neurons in the early neural tube. In addition Hh signaling regulates stem cell fate in the cerebellum [Dahmane et al., 2001; Ruizi i Altaba et al., 2004; Watkins et al., 2004]. In the limb, Shh is expressed from the cells found in the zone of polarizing activity (ZPA) and specifies the digit identity in the anterior-posterior axis. If the temporal gradient of Shh changes, digit identity also changes [Chuang et al., 2000; Harfe et al., 2004].
In studies of mouse embryo it has been shown that Hh signaling is required for foregut development. Experiments performed in both wild-type and Shh-/- mutant mice embryos show that Shh-/- mutant embryos have abnormal foregut and lung development. These results show that Shh is required for normal development of oesophagus and trachea and mutations of SHH and/or its signaling components may contribute to foregut defects in humans [Litingtung et al., 1998].
Shh and Ihh mutant mice embryos show defects in gastrointestinal organogenesis [Ramalho-Santos et al., 2000]. Hh signaling is important for anterior-posterior patterning, radial patterning, and epithelial stem cell differentiation and proliferation in gastrointestinal development. Radial axis patterning in the developing intestine is governed by the ratio of lamina propria and submucosa to smooth muscle and enteric neuronal cell neurons which is determined by Shh and Ihh expression [Watkins et al., 2004]. In the developing mouse pancreas, increased Hh signaling prevents the organogenesis [Kawahira et al., 2003]. Hh signaling regulates organ size, morphogenesis, and function of the pancreas.
Table 1.2: Vertebrate Hedgehog Functions [Ingham et al., 2001]. Tissue/cell type/organ Ligand Nature of role
Angiogenesis/vasculogenesis Ihh Stimulates endothelial cell production in yolk sac
Shh Induces angiogenesis
Blood cells Shh
Proliferation of stem cells, modulation hematopoietic and thymocyte differentiation Bone and cartilage Shh
Induction of early chondrogenic factors in somite proliferation/survival axial chondrogenic precursors
Ihh
Coordination of proliferation/ differentiation in endochondral skeleton
Cerebellum Shh
Proliferation of granule cell precursors, differentiation of Bergmann glia
Eye
Shh (Ihh, Dhh, twhh)
Stimulates and inhibits retinal neurogenesis astrocyte proliferation in optical nerve, retinal precursor proliferation
Shh and/or twhh Induction of proximal fates in the eye fields
Gut Shh
Separation of trachea and esophagus, A-P patterning gut tube
Ihh and/or Shh
Proliferation and inhibition of mesenchyme differentiation, radial patterning of gut tube
Gonads/external genitalia Dhh
Peritubular cell development, maturation of testes, Sertoli Leydig cell interactions, male germ line development, masculinization
Hair/feather Shh
Follice/feather morphogenesis, polarity of feather, Telogen to anogen switch in hair follicle
Heart Shh or Ihh Cardiac morphogenesis
Lateral Asymmetry Shh, Shh or Ihh Regulation of L/R asymmetry (left pathway) Limbs Shh A-P patterning of skeleton, outgrowth of limb-bud
Lung Shh
Branching epithelium, proliferation/ survival of mesenchyme
Muscle Shh
Induction/proliferation/survival of epaxial muscle precursors, fiber-type identity, regulation of smooth muscle differentiation
Neural Crest Shh
Survival of cranial neural crest, cranial facial morphogenesis, proliferation/ differentiation of sympathetic cells
Neurons Shh
Induction of specific ventral neural cell types, proliferation/survival/death neural precursors Olfactory Shh Olfactory pathway formation
Oligodendrocytes Shh Proliferation/differentiation/survival of precursors
Pancreas Shh
Inhibition of pancreatic anlagen formation, insulin production
Specification of pancreas anlagen (in fish) Peripheral nerves Dhh Formation of peripheral nerve sheath
Pituitary Shh
Inhibits transdifferentiation to lens, proliferation/cell type determination
Prostate Shh Growth and ductal morphogenesis Tooth Shh Growth, polarity and morphogenesis
1.2.3. Hedgehog Signaling in the Mammary Gland Development
In mouse mammary gland development, both Shh and Ihh can be detected in the mammary epithelium in E12. After placode formation, Ptch1 expression can be observed in both ectodermal and mesenchymal tissues. Gli1 expression cannot be observed in early development. Only after E13.5 it is expression is detectable in the epithelium. Gli2 and Gli3 expressions can be seen after placode formation at E11.5-E12.5 in epithelial tissues [Lewis et al., 2004; Michno et al., 2003]. Gli3 is shown to be important for mammary placode formation although detectable expression is seen only after placode formation. In ductal development, Ptch1 and Gli2 genes have been shown to be important [Lewis et al., 2004].
During the pregnancy and lactation periods Ptch is highly expressed. Haploinsufficiency of Ptch1 causes severe histological defects in ductal structure, and small morphological changes in terminal end buds in virgin mice [Lewis et al., 2004; Michno et al., 2003]. Gli2 is thought to be the main Hh signaling transcription factor in the mammary gland development. Gli2 null phenotype mice had misshapen ducts showing hyperplasia similar to human micropapillary ductal hyperplasia. While it is expressed in the stroma during mammary gland development, it is expressed in both stroma and epithelial tissues during pregnancy and lactation [Gallego et al., 2002]. Single gene loss of function mutation studies in mice for Shh, Ihh, Gli1, and Gli3 showed that these genes are not required for ductal development individually. Shh and Ihh may have redundancy in ductal development in virgin mice. Indeed, high expression of Ihh is observed in the Shh deficient mice. Loss of Shh expression does not have any effect on the expression profile of cyclin D1, a target of the pathway [Michno et al., 2003].
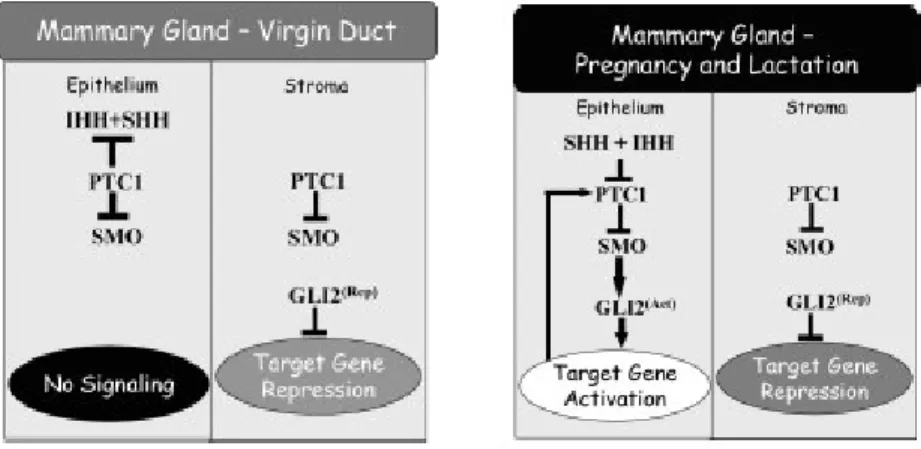
The working model for the role of Hh signaling in ductal development is that in the ducts of the virgin mice Ptch1 inhibits the Smo in the presence of low levels of Ihh in the epithelium [Lewis et al., 2004] (Figure 1.8). Thus, Gli2 cannot be expressed in that part of the mammary gland. However, in the stroma Ptch activates the pathway,
ligand away from the cells to prevent respond to stimulus. Loss of Ptch1 allows Hh ligand to signal to the stroma which is not exposed to high levels of ligand. In the absence of the Hh ligand Ptch1 can initiate apoptosis. If loss of Ptch1 occurs, it may lead to a failure in the apoptotic program, and cells accumulate in the duct.
Figure 1.8: Hedgehog network model in virgin mice duct and alveolar development in pregnancy and lactation. Hypothesized functional relationships among network components are shown for both the stroma and the epithelium [Lewis et al., 2004].
There is also a revised model for ductal development in which ductal development is ligand independent [Lewis et al., 2004]. Pcth1 is expressed in both epithelium and stroma to prevent signaling in the presence of low level of ligand expression by Smo inhibition, sequestration of the ligand, and induction of apoptosis, or combination of these. In this case Gli2 activity should be regulated by other pathways like Wnt. If this is the case, then Gli2 should act as a transcriptional repressor.
Ihh expression seems to be hormonally regulated because expression increases dramatically in the pregnancy, and becomes maximal during the lactation [Walterhouse et al., 2003]. Expressional regulation of Shh is not clear yet [Lewis et al., 2004]. That is why Ihh is the primary active Hh ligand in mammary development. All three Hh ligand expression are observed in postnatal mice
mammary gland by RT-PCR, whereas in the in situ hybridization experiments only Ihh expression is detected, which proves the importance of the Ihh in the mammary development [Michno et al., 2003]. In the alveolar epithelium Ptch1 mRNA expression increases with the pregnancy, but stays same in the stroma. Gli2 expression becomes both stromal and epithelial in the pregnancy and lactation. Increased expression of Ihh in the pregnancy may inhibit the Ptch1 and activate the downstream pathway. As a result Gli2 expression may be induced in the epithelium and acts as transcriptional activator for the target genes.
Effects of Hh signaling on the proliferation and differentiation of the mammary mesenchyme have not been described.
1.2.4. Hedgehog Signaling and Cancer
Distinct tissues require specific levels of Hh signaling for proper functioning. Any increase or decrease in the signaling activity results in severe defects. Although Hh signaling is one developmental pathway, it is expressed in some mature cell types and its deregulation leads to tumor progression in these tissues.
Table 1.3, Table 1.4 and Table 1.5 shows the Hh pathway with relation to cancer. The importance of hedgehog signaling in carcinogenesis has been demonstrated by the fact that many of the genes involving Hh signaling are known oncogenes, including SMO, SHH, GLI1, and GLI2, or that PTCH1 can function as a tumor suppressor. Mutations in these genes causes to the development of many common cancers, which are shown to be dependent on activated Hh signaling. These mutations both include inactivating mutations in the PTCH and activating mutations in SHH and SMO.
GLI1 is first identified as an amplified gene in malignant glioma cells. Overexpression of the Gli1 in mouse skin results in rapid and spontaneous development of basal cell carcinoma (BCC), cylindromas, and trichoblastomas
![Figure 1.1: Anatomy of the breast. Woman breast is formed by ducts, lobules, fatty and connective tissues [http://www.cancer.org]](https://thumb-eu.123doks.com/thumbv2/9libnet/5763232.116652/21.918.214.606.346.699/figure-anatomy-breast-woman-breast-lobules-connective-tissues.webp)
![Table 1.1: Genes involved in breast carcinogenesis [Kenemans et al., 2004]](https://thumb-eu.123doks.com/thumbv2/9libnet/5763232.116652/28.918.200.799.162.499/table-genes-involved-in-breast-carcinogenesis-kenemans-et.webp)
![Figure 1.5: Hedgehog Signaling Pathway. [Biljsma et al., 2004]](https://thumb-eu.123doks.com/thumbv2/9libnet/5763232.116652/37.918.243.728.255.550/figure-hedgehog-signaling-pathway-biljsma-al.webp)
![Figure 1.6: Synthesis of Hedgehog ligand in the signaling cells [Watkins et al., 2004]](https://thumb-eu.123doks.com/thumbv2/9libnet/5763232.116652/38.918.250.682.310.658/figure-synthesis-hedgehog-ligand-signaling-cells-watkins-et.webp)
![Figure 1.7: Upstream regulation of the Gli transcription factors and their individual and combined roles in regulating Hh target gene expression [Lipinski et al., 2006]](https://thumb-eu.123doks.com/thumbv2/9libnet/5763232.116652/39.918.306.670.455.734/upstream-regulation-transcription-individual-combined-regulating-expression-lipinski.webp)
![Table 1.3: Animal models of Hedgehog-dependent tumors [Magliano et al., 2003]](https://thumb-eu.123doks.com/thumbv2/9libnet/5763232.116652/46.918.257.724.390.717/table-animal-models-of-hedgehog-dependent-tumors-magliano.webp)
