Τ /(
^ e 2 i
'МРМОШЛ:ОШі
OPTiCÄL PARAÍ^ETR^C
: Ä - ^ ; ; ^ , , : : ; O S C i L l Ä t ® Ш ■ ' Q E W i E Ä A T K ' ' e y e-
s a f e r ä d«
a t s oI'J
■,
т а г г т а т а т а э т а г т а т а i z s í k^ d£ J , £і щ “зсзоззоіпоз 3i:3i';ss2ï!iï3·
■¿ 'î i таз Еівззта-зз оз ш-илтзлвЕта таш гзтаіозз
Zil - -r·} r ,'T' ■'-:i .·τρNANOSECOND OPTICAL PARAMETRIC
OSCILLATORS GENERATING EYE-SAFE RADIATION
A THESIS
SUBMITTED TO THE DEPARTMENT OF ELECTRICAL AND ELECTRONICS ENGINEERING
AND THE INSTITUTE OF ENGINEERING AND SCIENCES OF BILKENT UNIVERSITY
IN PARTIAL FULFILLMENT OF THE REQUIREMENTS FOR THE DEGREE OF
MASTER OF SCIENCE
By
Liitfiye Durak
October 1998
ß
τ κ 789-İ2. ■07· ■йя?-Λ ' ^I certify th at I have read this thesis and that in rny opinion it is fully adequate, in scope and in quality, as a thesis for the degree of Master of Science.
Assoc. Prof. Dr. Orhan Aytiir (Supervisor)
I certify that I have read this thesis and that in my opinion it is fully adequate, in scope and in quality, as a thesis for the degree of Master of Science.
Assoc. Prof. Dr İrşadi Tmsun
I certify that I have read this thesis and that in my opinion it is fully adequate, in scope and in quality, as a thesis for the degree of Master of Science.
Approved for the Institute of Engineering and Sciences:
Prof. Dr. Mehmet Ba;:
ABSTRACT
NANOSECOND OPTICAL PARAMETRIC
OSCILLATORS GENERATING EYE-SAFE RADIATION
Liitfiye Durak
M.S. in Electrical and Electronics Engineering
Supervisor: Assoc. Prof. Dr. Orhan Aytiir
October 1998
In this thesis, construction and characterization of nanosecond optical para metric oscillators (OPO’s) generating eye-safe radiation are presented. These OPO’s convert the output of an Nd:YAG laser at 1.06 μ,\ι\ wavelength to 1.57 μη\ wavelength which is in the eye-safe band of the spectrum. A potassium titanyl phosphate (KTP) crystal is employed in these OPO’s. In the experiments, output signal energies, pulse durations, spectral characteristics, and divergence angles of the OPO outputs have been measured. We have obtained 35% conversion effi ciency by using pump pulses having 15 rnJ energy and 7 ns pulse duration. These low energy O PO ’s can be used in range finders. We have also constructed OPO’s that are pumped by 100 mJ pulses of 15 ns pulse duration, and 38% conversion efficiency was achieved. These high energy OPO’s can be used in target designa tors. The divergence angles of the low energy and the high energy OPO’s hav(' been measured as 4 rnrad and 3 mrad, respectively. A numerical model which takes into account the temporal and spatial beam profiles, diffraction, and absorp tions in the crystal has been constructed. The model is in qualitative agreement with the experimental results.
Keywords: optical parametric oscillation, nonlinear crystals, KTP, nanosecond lasers, Nd:YAG.
ÖZET
GÖZE ZARARSIZ IŞIN ÜRETEN NANOSANIYE OPTİK
PARAMETRİK OSİLATÖRLER
Lütfiye Durak
Elektrik ve Elektronik Mühendisliği Bölümü Yüksek Lisans
Tez Yöneticisi: Doç. Dr. Orhan Aytür
Ekim 1998
Bu tezde göze zararsız ışın üreten nanosaniye optik parametrik osilatörlerin (OPO’lar) oluşturulıııası ve değerlendirilmesi sunulmaktadır. Bu OPO’lar 1.06 μιη dalgaboyu olan Nd:YAG laser çıkışını spektrumda göze zararsız aralıkta yer alan 1.57 //m ’ye dönüştürmektedir. Bu OPO’larda potasyum titanil fosfat (KTP) kristali kullanılmıştır. Deneylerde çıkış sinyal enerjileri, darbe uzunlukları, spek- trum ve OPO çıkışı ayrılma açıları ölçülmüştür. OPO’lar 15 mJ enerjisi ve 7 ns darbe uzunluğu olan darbelerle pompalandığında, %-35 dönüşüm verimi elde edilmiştir. Bu düşük enerjili OPO’lar mesafe ölçüm uygulamalarında kul lanılabilir. Ayrıca, 100 mJ enerjili, 15 ns uzunluğu olan darbelerle pompalanmış OPO’lar kurulmuş ve %38 dönüşüm verimi elde edilmiştir. Bu yüksek enerji li OPO’lar ise hedef işaretleme uygulamalarında kullanılabilir. Ayrılma açıları düşük enerjili OPO’larda 4 mrad, yüksek enerjili OPO’larda 3 mrad olarak öl çülmüştür. Aynı zamanda, zamansal ve uzaysal ışın profillerini, kırınımı ve kristaldeki emilimi hesaba katan bir model oluşturulmuştur. Bu model, deneysel sonuçlarla uyum göstermektedir.
Anahtar kelimeler, optik parametrik osilasyon, doğrusal olmayan kristaller, KTP, nanosaniye lazerler, Nd:YAG.
ACKNOWLEDGMENTS
I would like to express my sincere gratitude to Dr. Orhan Aytür for his super vision, guidance, suggestions, and encouragement throughout the development of this thesis. I would like to thank the members of my committee, Dr. İrşadi Aksun and Dr. Ali Serpengiizel, for their valuable comments on the thesis.
I would also likt' to extend my thanks to ASELSAN for their support of this work, and to Dr. Şefik Süzer for his help in taking some measurements in the laboratories of the Chemistry Department. I am grateful to Mürüvet Parlakay, isrnail Kir, Ersin Başar, Ergün Hırlakoğlu for all their help.
I would like to thank Tolga Kartaloğlu for his help in the optics laboratory besides his friendship. I am indebted to Güçlü Köprülü not only for his help during the development of this thesis, but also for his support and friendship.
I am grateful to my friends Yamaç Dikmelik, Gülbin Akgüıı, Deniz Başkent, Meliha Aksoy, Sevgi Babacan, Birsel Ayrulu, Bahar Deler, Özer Akdemir and Deniz Gürkan for their friendship, encouragement and support whenever I needed.
Special thanks go to Tolga Ekmekçi for his lasting friendship, patience, and all his support on both academic and personal issues. I am grateful to Ayten Türkcan for all her help, too. I feel extremely fortunate to have known her. I would also like to thank Sevgi Recberoğlu. I greatly appreciate her friendship.
I am deeply indebted to Nedret Öztan for her patience, understanding, en couragement, and especially her trust.
I would also like to thank Gülçin, Serna and Yasemin for the love and support they have provided me.
Finally, I would like to thank my parents, Sevirn and Tank Durak for their endless love, trust, support and encouragement throughout my life.
C ontents
1 Introduction 1
2 T heory o f O ptical Param etric O scillation 4
2.1 Nonlinear M aterials... 4
2.2 The Driven Wave Equation 5 2.3 Phase M atch in g ... 7
2.4 Optical Parametric A m plification... 8
2.5 Optical Parametric O scillation... 10
3 H istorical R eview o f Nanosecond OPO E xperim ents 14 3.1 Nanosecond OPO’s in Visible and Near-IR... 15
3.1.1 LiNbOa OPO’s 15 3.1.2 KNbOa OPO’s 16 3.1.3 KTP OPO’s ... 17
3.2 Nanosecond OPO’s in Near-UV and Visible 19 3.2.1 Urea OPO’s ... 19
3.2.2 BBO OPO’s ... 19
3.2.3 LBO OPO’s ... 21
3.3 Nanosecond OPO’s in M id - I R ... 22
4 OPO Experim ents 24 4.1 Experimental S e tu p ... 24 4.1.1 Pump L a s e r ... 24 4.1.2 C ry sta l... 25 4.1.3 Cavity Configurations 26 4.1.4 Characterization 28 4.2 Experimental R e su lts... 29 4.2.1 Summary of the R e s u l ts ... 29
4.2.2 OPO’s Pumped up to 20-28 mJ 32 4.2.3 OPO’s Pumped up to 15-20 n ij 42
4.2.4 OPO’s Pumped up to 100 rnJ 51
5 Sim ulations of OPO Experim ents 58
5.1 M o d e l ... 59 5.2 Analysis of the Coupled Mode E q u a tio n s... 62
5.3 Simulation Results 65
5.3.1 Simulations of the Low Energy OPO’s 65 5.3.2 Simulations of the High Energy OPO’s ... 70
5.4 Discussions 71
List of Tables
2.1 Phase matching types for possible polarizations of the interacting fields... 8 4.1 Sellmeier coefficients of hydrothermally grown KTP crystals 26 4.2 The computed refractive indices that pump, signal and idler expe
rience in NCPM type-II interaction... 26 4..3 Threshold energies of the single-pass and double-pass OPO’s with
different output couplers... 33 4.4 Maximum conversion efficiency and maximum pump depletion data
of the single-pass OPO’s... 34 4.5 The maximum conversion efficiency data of the double-pass OPO’s 36 4.6 Pulse durations of both single-pass and double-pass OPO’s with
different output couplers... 39 4.7 Signal divergence data of various double-pass OPO cavities. 41 4.8 Threshold energies of the single-pass and double-pass OPO’s with
different output couplers... 43 4.9 Maximum conversion efficiency and maximum pump depletion data
of the single-pass OPO’s... 44 4.10 Maximum conversion efficiency data of the double-pass OPO’s. . . 46 4.11 Pulse durations of both single-pass and double-pass OPO’s with
different output couplers... 49 4.12 Signal divergence data for various double-pass OPO cavities. . . . 51 4.13 Threshold energies of the single-pass OPO’s with different output
couplers... 52 4.14 Maximum conversion efficiency and maximum pump depletion data
of the single-pass OPO’s... 53 5.1 Values of the physical parameters used in the model. 61
List of Figures
2.1 Simple schematic of optical parametric amplification process. . . . 8 2.2 Evolution of photon flux densities in an optical parametric ampli
fication process... 10 2.3 A simple OPO schematic... 11 2.4 Photon conversion efficiency vs. pump intensity values that are
normalized with respect to the threshold pump intensity... 12
4.1 Single-pass OPO configuration. 27
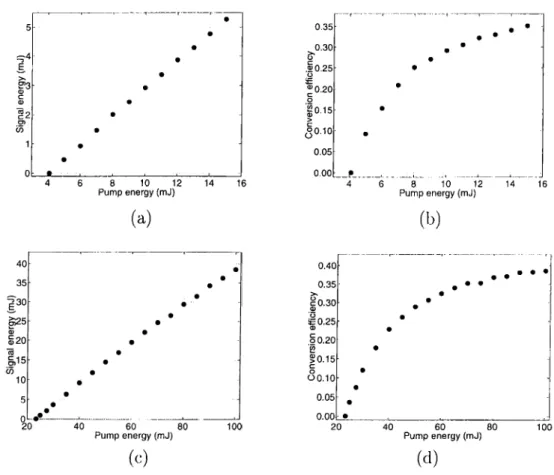
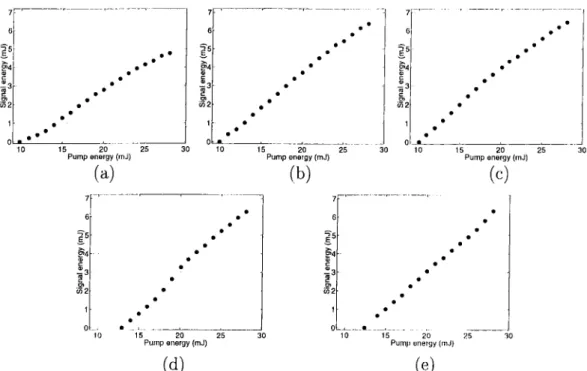
4.2 Double-pass OPO configuration... 27 4.3 Signal energy vs. pump energy and conversion efficiency vs. pump
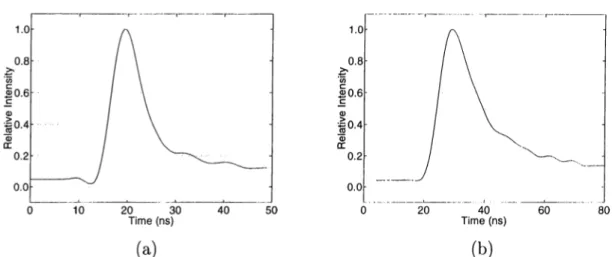
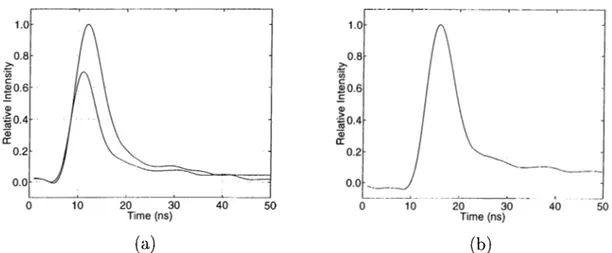
energy plots of the low energy and high energy experiments. 30 4.4 Oscilloscope traces of the signal of (a) the low energy OPO and
(b) the high energy OPO... 31 4.5 Spectrum of the signal of (a) the low energy OPO and (b) the high
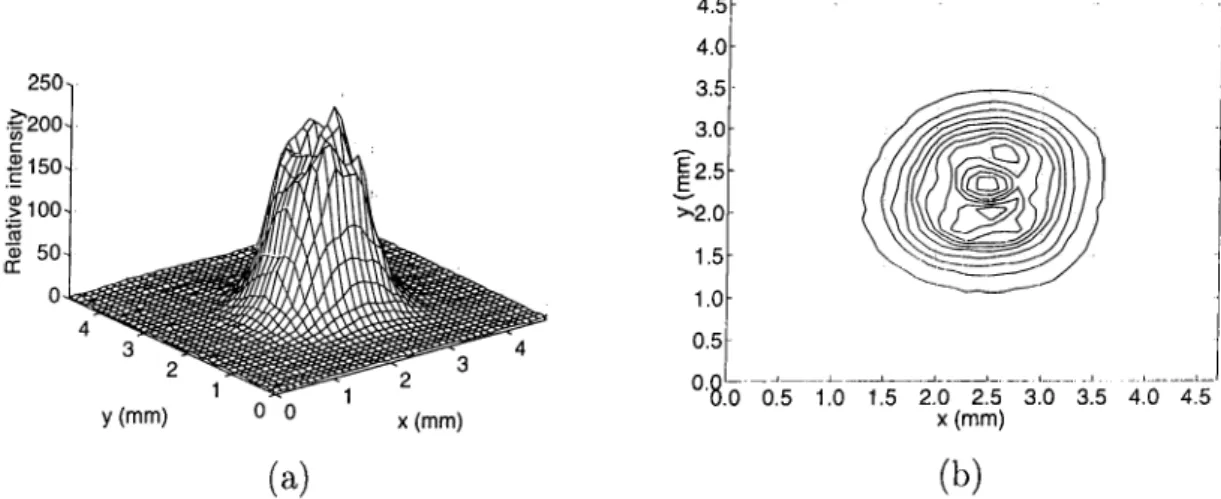
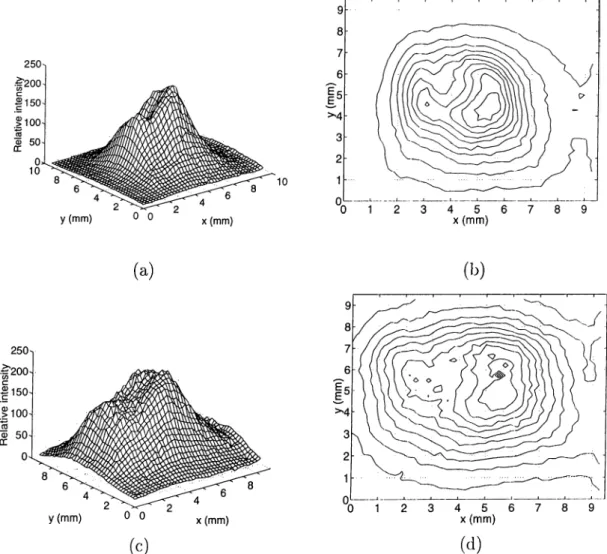
energy OPO... 31 4.6 The signal profile at 30 cm away from (a) the low energy OPO and
(b) the high energy OPO... 31 4.7 Telescope constructed for the first OPO experiment set with focal
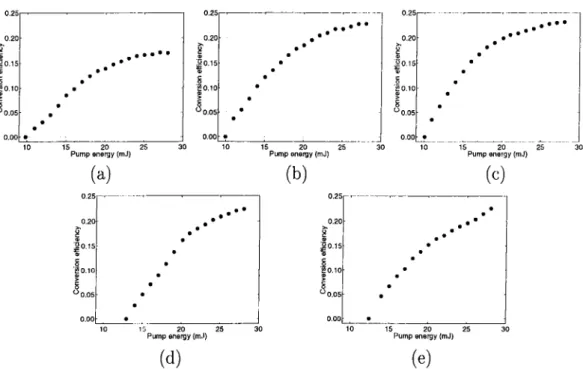
length values of 127.1 mm and —50.9 mm at 1064 nni. 32 4.8 Pump profile on the KTP crystal... 32 4.9 Signal energy vs. pump energy plots of the single-pass OPO’s. . . 34 4.10 Conversion efficiency vs. pump energy plots of the single-pass OPO’s. 35 4.11 Pump depletion vs. pump energy plots of the single-pass OPO’s. . 35 4.12 Signal energy vs. pump energy plots of the double-pass OPO’s. . . 36 4.13 Conversion efficiency vs. pump energy plots of the double-pass
OPO’s... 37 4.14 Signal energy and conversion efficiency vs. pump energy plots of
4.15 Conversion efficiency vs. pump energy plots with different cavity lengths... 38 4.16 Oscilloscope traces of the pump, the depleted pump, and the signal
of a single-pass OPO... 39 4.17 Oscilloscope trace of the signal of the double-pass OPO with R =
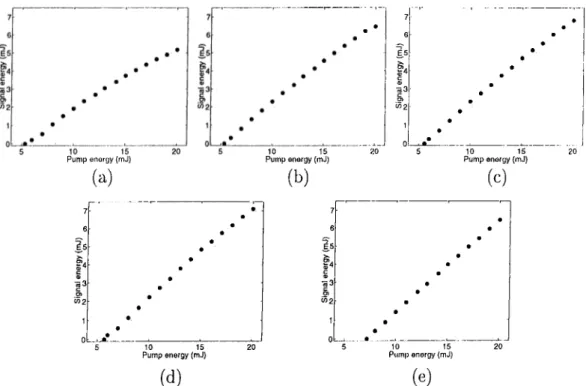
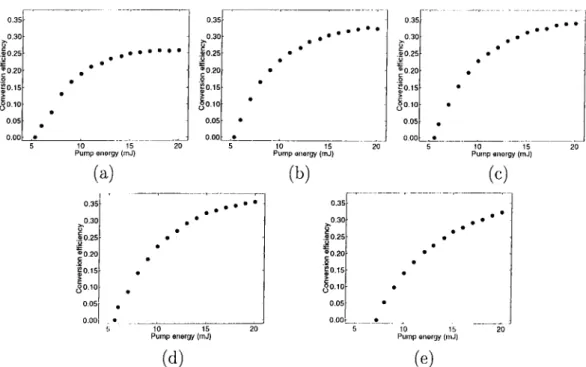
70% output co u p le r... 39 4.18 Spectrum of the signal... 40 4.19 Signal profiles of double-pass OPO’s. 41 4.20 Pump profile on the KTP crystal... 42 4.21 Signal energy vs. pump energy plots of the single-pass OPO’s. . . 44 4.22 Conversion efficiency vs. pump energy plots of the single-pass OPO’s. 45 4.23 Pump depletion vs. pump energy plots of the single-pass OPO’s. . 45 4.24 Signal energy vs. pump energy plots of the double-pass OPO’s. . . 46 4.25 Conversion efficiency vs. pump energy plots of the double-pass
OPO’s... 47 4.26 Signal energy and conversion efficiency vs. pump energy plots of
the double-pass OPO with R — 70% output coupler... 47 4.27 Conversion efficiency vs. pump energy plots with different cavity
lengths... 48 4.28 Oscilloscope traces of the pump, the depleted pump, and the signal
of a single-pass OPO... 48 4.29 Oscilloscope trace of the signal of the double-pass OPO with jR = 70%
output coupler... 49 4.30 Signal profiles of the double-pass OPO’s. 50 4.31 Pump profile on the KTP crystal... 51 4.32 Signal energy vs. pump energy plots of the single-pass OPO’s. 53 4.33 Conversion efficiency vs. pump energy plots of the single-pass OPO’s. 53 4.34 Pump depletion vs. pump energy plots of the single-pass OPO’s. . 53 4.35 Pump energy vs. signal energy and conversion efficiency plots. 54 4.36 Signal energy and conversion efficiency vs. pump energy plots with
R = 70% output coupler... 54 4.37 Oscilloscope traces of the pump and the signal of the double-pass
OPO... 55 4.38 Spectrum of the signal... 55 4.39 Signal profiles of the double-pass OPO’s. 56
5.1 A simple sketch of the discretization of a pump pulse... 59 5.2 Optical parametric oscillation in a single-pass OPO cavity. 60 5.3 Optical parametric oscillation in a double-pass OPO cavity... 61 5.4 Signal energy vs. pump energy data of the single-pass OPO with
R = 80% output coupler... 66 5.5 Simulation and experimental results of the conversion efficiency
and pump depletion vs. pump energy data of the single-pass OPO with R — 90% output coupler... 66 5.6 Simulation and experimental results of the signal energy vs. pump
energy data of the double-pass OPO with R = 80% output coupler. 67 5.7 Simulation and experimental results of the conversion efficiency
vs. pump energy data of the double-pass OPO with R = 80% output coupler... 67 5.8 Simulations and experimental measurements of the time traces of
the pump, the depleted pump, and the signal of a single-pass OPO. 68 5.9 Conversion efficiency plots with different cavity lengths... 69 5.10 Simulation and experimental results of the conversion efficiency
vs. pump energy data of the single-pass OPO with R = 70% output coupler... 69 5.11 Simulation and experimental results of the signal energy and con
version efficiency v.s. pump energy data of the double-pass OPO with R = 60% output coupler... 70 5.12 Simulations and experimental measurements of the time traces of
Chapter 1
Introduction
Optical parametric oscillators (OPO’s) are optical devices that convert the wave length of lasers to different wavelengths where laser sources are unavailable. OPO’s are constructed by inserting a nonlinear crystal into an optical cavity which provides optical feedback.
Frequency conversion of lasers can be achieved by using nonlinear optical materials. In nonlinear materials, the polarization density has a nonlinear depen dence on the electric field which can be expressed in a power series form. When the quadratic nonlinear dependence is dominant, three fields at different optical frequencies interact by exchanging their energies.
Various frequency mixing processes can be achieved by nonlinear interactions. Second order nonlinear interactions lead three wave mixing, and they are the most frequently used ones. These interactions are sum frequency generation (SFG), second harmonic generation (SHG), difference frequency generation (DFG), and optical parametric amplification. In SFG, two beams at different frequencies are used to generate the sum frequency of these beams. SHG is a special case of SFG. With SHG, the output frequency of a laser is doubled. In DFG process, difference frequency of two input beams is obtained. At the same time, the input beam at the lower frequency is amplified by the process of DFG. Therefore, DFG proc(!ss is also used for amplification which is called optical parametric amplification. In optical parametric amplification, the two input optical fields are a strong field at a higher frequency (pump), and a weak field at a lower frequency (signal). Through the process, lower frequency field is amplified, and a third field at the difference frequency (idler) is also generated.
in an optical cavity. Unlike OPA’s, OPO’s require only one input beam: the pump. The oscillation starts by the spontaneous decay of the pump photons to signal and idler photons, and the interaction evolves efficiently if the momentum conservation (phase matching) condition is satisfied. Therefore, frequency tuning is possible in OPO’s. The frequency tuning is achieved either by varying the direction of propagation of the fields in the nonlinear crystal (angular tuning), or by changing the temperature which results a change in the refractive indices of the crystal (temperature tuning), or by using a tunable pump source. The continuous tunability of OPO’s is an advantage over lasers. Lasers usually generate light at specific wavelengths, because laser radiation is obtained by stimulated emission between fixed energy levels of a gain medium. There are some exceptional cases where a limited tunability is possible such as dye lasers or Ti:sapphire lasers which have broad energy bands. However, they have much less tuning range than what an OPO can provide.
The temporal profiles of the OPO outputs depend on the temporal nature of the pump lasers. There are continuous wave (cw) OPO’s or pulsed OPO’s with pulse durations on the order of nanoseconds, picoseconds or femtoseconds. In cw and nanosecond OPO’s, the signal makes many round trips in the cavity as the pump passes through the cavity. In nanosecond OPO’s, in order to increase the number of round trips that the signal makes during the pump pulse duration, it is advantageous to choose the cavity length as small as possible .
The first OPO, constructed in 1965 [1], was a nanosecond OPO employing a LiNbOa crystal. As new crystals and pump lasers appeared on the scene, many other nanosecond OPO experiments have been reported. These OPO’s operate at spectral ranges from near ultraviolet (UV) to middle infrared (IR).
In the optical spectrum, the band of 1.54-1.60 μπι is accepted as eye-safe. According to the eye-safety criterion of the American National Standard Institute (ANSI), “at 1.54 μιη a single exposure of 1 J/cm^ is 400,000 times more eye-safe than a corresponding exposure at 1.06 /xm” [2]. Wavelengths in the eye-safe region are mostly absorbed in the aqueous humor portion of the eye which is filled by the ocular fluid next to the cornea. Therefore absorptions on the retina and cornea surfaces are much less than the absorption in aqueous humor, and such a volume absorption is much less harmful than the surface absorptions [3].
In this thesis, nanosecond KTP OPO’s generating eye-safe radiation were designed and demonstrated. These OPO’s convert the output of an Nd:YAG
laser at 1064 nm wavelength to 1571 nm wavelength which is in the eye-safe band of the spectrum. Eye-safe lasers are preferred for some military applications such as range finding, target designation, and laser radar. The OPO’s were constructed to operate either at low energy levels (~15 rriJ) for range finding applications or at high energy levels (~100 mJ) for target designation applications.
Two different types of OPO cavities were constructed. The pump beam is either passed through the KTP crystal once (singhi-pass OPO), or the depleted pump is reflected back to the crystal providing a second pass of the pump for each round trip (double-pass OPO). Each OPO is characterized by measuring output signal energies, temporal profiles, spectrum, and divergence of the signal.
The experiments were also modeled numerically. In the model, time is dis cretized by cavity round trip times for each pump puls(î. At each time point, the interaction in the nonlinear crystal is handled by finite difference methods. The model takes into account the temporal and spatial beam profiles, diffraction, and absorption in the crystal.
The thesis is structured as follows: Theoretical background information for optical parametric oscillation is provided in Chapter 2. Chapter 3 presents a historical overview of nanosecond OPO experiments from their invention in 1965 up to the present. The setups and the results of the experiments are presented in Chapter 4. Next, the numerical modeling of the OPO’s in comparison with the measured results are discussed in Chapter 5. Finally, the conclusions with future directions are given in Chapter 6.
Chapter 2
Theory of Optical Param etric
O scillation
This chapter presents the theory of optical parametric oscillation. The chapter starts with the interaction of light beams with different frequencies in a second order nonlinear material. The evolution of the fields in such a medium is descril)ed by using classical electromagnetic theory. Next, the phase matching condition which provides efficient OPO operation is stated. Finally, after explaining optical parametric amplification process, the optical parametric oscillation is discussed.
2.1
N onlinear M aterials
In a nonlinear material, the response of the medium to the applied optical field depends on the field nonlinearly. The relationship between the electric field (E) and the polarization density (P) can be expressed in a power series form as
= + E · χ(2) . E + E · (E · χ(·*) · E) + ...] = P^^^ + + P^'^^ + . . .
(2.1)
(2.2)
where Cq is the permittivity of the free space, x^^^ is the linear susceptibility tensor, and x^^^ is the second order nonlinear susceptibility tensor. The higher order nonlinear susceptibilities (x^”\ n>3) are usually negligible compared to the second order term unless x^^^ is zero, x^^^ vanishes in centrosyrnmetric materi als which have inversion symmetry, and when this is the case, the third order nonlinearity is dominant.
2.2
T he D riven W ave Equation
The evolution of the fields in a second order nonlinear medium are described by the driven wave equation. The source-free Maxwell’s equations
8H V x E = - ^ 0^ (2.3) r9D v x H = V dt (2.4) V - D = 0 (2.5) V - B = 0 (2.6) relations D = eoE -1- P (2.7) B = //qH (2.8)
describing the effects of electromagnetic fields in a nonmagnetic medium are used to form the driven wave equation [4]
(2.9)
where n is the refractive index of the medium. In the derivation of Equation (2.9), the first approximation is [4]
V - E - O . (2.10)
If the fields are plane waves, then V · E is exactly zero [5]. If the fields are not plane waves, but have slowly varying amplitudes, this is a valid approximation [4]. Moreover, as a second approximation
~ 1 -I- X(1) (2.11)
is used. For isotropic materials, n? is exactly equal to 1 -I- For anisotropic materials, if D and E vectors are parallel then this is a valid approximation. However, if the direction of propagation is not along one of the principal axes of the anisotropic crystal, there is an angle between D and E vectors which is called the walkoff effect [4]. This approximation fails unless walkoff is small.
In a second order nonlinear medium, in the most general situation, three optical fields satisfying the frequency relation of
interact. One can choose three monochromatic plane waves propagating along the z-axis such as
E,:(r, t) = i = 1,2,3 (2.13)
with nonlinear polarization densities
PS‘^^(r, t) = Re[Pf^(;j)e^‘"-‘] i = l, 2 ,3. (2.14) By inserting the expressions of E i(r,i) and P f^ (r, i) into Equation (2.9),
2 2 nro;, is obtained. If we substitute Ei{z) = Ei{z)a.i (2.15) (2.16)
and assume that the change of the field amplitudes in one wavelength distance is much smaller than the field amplitude itself (slowly varying amplitude approxi mation) as
(E d
— E i ^ k i — Ei '¿ = 1,2,3 (2.17)
which is valid for waves at optical frequencies. Equation (2.15) becomes
j-Ei{z)e-^>^'^ = ■ Pf^(.2). (2.18)
For the field at frequency oii, ai · P ^ i\z ) is
ai · P f \ z ) = ai · eo{Es{z)e-^'^^^ ■ ■ E*{z)e^’^ n
= eoE,(z)E*{z)e-^^'^^-'^'^^^{a, ■ (a^ · · a.3)) (2.19)
where ai · {a.2 ■ - as) is the element of the tensor corresponding to this polarization geometry, and usually the following notation
(2.20)
is used. In a similar way, one can express Equation (2.15) for each field as (2.21) d, = . (a.2. . a.,) dz n\C i E , ( z ) = - j '^ E ; ( z ) E z { z ) e - ^ ’^'“ dz U2C d .u^zdi - E , { z ) = - j ^ E , { z ) E 2{z) dz nzc (2.22) (2.23)
where A k = ks — ki — k2 is the phase-mismatch term. If the nonlinear medium is lossless,
di = (¿2 = da = de (2.24) and dg is called the effective second order nonlinear coefficient. The equations (2.21)- (2.2.3) are called coupled mode equations. As seen in the equations, two fields together behave as a source term of the remaining third field.
The type of the nonlinear interaction of these three waves depends on the initial conditions of the fields. For example, DFG is a second order nonlinear process, where two input fields at frequencies ui and W3 are combined to form a third field at the difference frequency {u>2 = — wi ).
2.3
P hase M atching
In the coupled mode equations (Equations (2.21)-(2.23)), the phase mismatch factor (Ak) should vanish in order to provide efficient interaction of the three coupled fields [4]. The phase matching condition for collinear beams is
A k = kz — k2 — ky — Q (2.25)
and if it holds, the phase velocities of both the fields and the polarization densities at the same frequency remain equal during the interaction. Therefore, in second order interactions besides the energy conservation condition
W3 — LOy -\- LÜ2 Equation (2.25) stating
naUs = nyüJy + Tl2i02
(2.26)
(2.27) should also be satisfied.
However refractive indices of materials usually increase as the frequency of the wave increases (normal dispersion). In other words, for fields at frequencies of > U2 >tOy, the refractive indices are > ri2 > ny. In dispersive materials, it is impossible to satisfy the two conservation conditions simultaneously.
In order to achieve phase-matching, one method is to use the birefringence of anisotropic crystals. In anisotropic crystals, for each propagation direction, there are two eigenpolarizations of a field which experience two different eigenrefracive
Type UJl UJ2 U:i I slow slow fast II fast slow fast III slow fast fast
Table 2.1: Phase matching types for possible polarizations of the interacting fields.
indices. For the phase matching condition to be satisfied, the field at the high est frequency should be polarized in the direction of the lower refractive index (fast axis), and the lower frequency fields should either be polarized both in the direction of the higher refractive index (slow axis) or be polarized perpendicular to each other (one at the fast axis, other at the slow axis). The phase matching schemes that are formed for each possibility of the field polarizations are labeled as type I, type II and type III, and are presented in Table 2.1.
If the phase matching condition is satisfied when the direction of propagation is along one of the optic axes of the crystal, this condition is called noncritical phase matching [6]. In this case there is no walkoff.
Also, in order to achieve phase matching, the interacting waves do not have to be collinear. If the beams propagate noncollinearly, the phase matching condition (noncollinear phase matching) is expressed as
ka - ki - k2 = 0. (2.28)
2.4
O ptical Param etric A m plification
In optical parametric amplification process, a strong pump field at 0^3 is used to amplify a weak signal field at u>i. An idler beam at CO2 — u>z—to i is also generated throughout the interaction. Figure 2.1 presents a simple schematic of the optical parametric amplification process.
pump (cOj)
signal (COj)
second order nonlinear
medium
depleted pump (CO^) amplified signal (COj) idler (CO2)
Figure 2.1: Simple schematic of optical parametric amplification process. The evolution of the fields in an OPA can be calculated by solving the coupled
mode equations (Equations (2.21)-(2.23)). If the phase matching condition is satisfied, the coupled mode equations become
P _ r i i C (2.29) ' ' p - - :j, d c ^ 2 ^ -e ^ e ,e ri2C (2..30) — F . = dz ^ n ^ c (2.31)
The general solutions of the fields are in terms of Jacol)i elliptic functions [7]. We can normalize the complex field amplitudes as
12hu>i
riiceo ( l i t ■¿ = 1,2,3 (2.32)
where a f’s are the photon flux densities.
In the optical parametric amplification process, when a pump photon is used to form a signal photon, an idler photon is generated. So the following quantities are conserved:
Cl = a1{z) + al{z) C2 = 02(2:) + 0,3 (2).
(2..33) (2.34) These conservation relations (Equations (2.21)-(2.23)) are called as Manley-Rowe relations. By using the constants of the Manley-Rowe relations, the solutions for the normalized field amplitudes are
ai(z) = x/cT dn(Z„|m„) (2.35)
a2{z) = s/o¡ Cn{Za\rna) (2..36)
03(2;) = sjol Sn{Za\rna) (2..37) where dn, cn, and sn are the Jacobi elliptic functions, rria = Ci/c2, and Za is
(2.38) Za = K(ma) - de\l ^3
C^€onin2n:i
where K(ma) is the complete elliptic integral of the first kind [8].
Figure 2.2 presents the evolution of photon flux densities in an OPA. (The parameters of the OPA are arbitrarily chosen as: de = 3.6 x 10” a signal beam at 1571 nin, and a pump beam at 1064 run.) The photon flux densities are
Figure 2.2: Evolution of photon flux densities in an optical parametric amplifica tion process. The photon flux densities are normalized by the pump photon flux density.
normalized by the pump photon flux density. The initial signal is chosen as 10% of the initial pump. The signal gets amplified until the pump is fully depleted. Then the interaction gets reversed, where signal and idler photons combine to form pump photons. This is called backconversion.
In OPA’s, parametric gain is defined as a?(0 G =
a'f(O) (2.39)
where I is the interaction length.
Small-signal gain is the gain that the signal experiences when the depletion of the pump is negligible. With constant input pump assumption, the coupled mode equations can be simplified, and they lead to an approximate solution for the small-signal gain as
Go = cosh'^ d. / 2iTlLOiU>2ljO^
“Ύ c^eo?rin2n,30,‘i{())z (2.40)
2.5
O ptical Param etric O scillation
An OPO is constructed by inserting an OPA into an optical cavity which provides feedback for the signal. OPO’s require only one input beam: the pump. The initial signal field is obtained by the spontaneous decay of the pump photons into the signal and idler photons, a process known as parametric fluorescence. Initially, signal experiences small signal gain. When this unsaturated gain compensates for the total loss in the cavity, oscillation starts. In an OPO, signal is coupled
pump second order nonlinear medium signal idler
Figure 2.3: A simple OPO schematic. The nonlinear crystal is inserted in a cavity which provides feedback to the parametric amplification process.
out of the cavity by a partially transmitting mirror at the signal wavelength. As the signal intensity in the cavity increases, gain saturates. OPO’s operate at steady state as long as this saturated gain compensates for the total loss exactly. Figure 2.3 presents a simple OPO schematic.
There are two types of OPO resonators depending on the resonating fields in the cavity: singly-resonant OPO’s (SROPO’s) and doubly-resonant OPO’s (DROPO’s). In SROPO’s, only the signal field is resonated, and the idler is removed away with each round trip of the signal. In DROPO’s both the sig nal and the idler are resonated. DROPO’s have lower pump threshold intensi ties when compared to SROPO’s, however SROPO’s are mnch more stable than DROPO’s [6].
In an OPO, taking the signal out of the cavity is a useful loss. Useless los.ses are all other losses including reflection losses, absorption, scattering and transmission losses. If the useless losses are denoted as L, then let
R i = 1 — L.
So, when there is no loss = 1, and R is defined as R = RlR-oc
(2.41)
(2.42) where Rqc is the reflectivity of the output coupler. The steady state oscillation condition is
^ 4 ·
(2.43)where G is the saturated signal gain.
In a cw OPO, by using the small signal gain expression (Equation (2.40)), threshold intensity {1t h) is expressed as
1th = eoc'”nin2n3 1
2dluiU'2R cosh^(Y^l/l — R)
Pump flux density/Threshold pump flux density
Figure 2.4: Photon conversion efficiency vs. pump intensity values that are nor malized with respect to the threshold pump intensity.
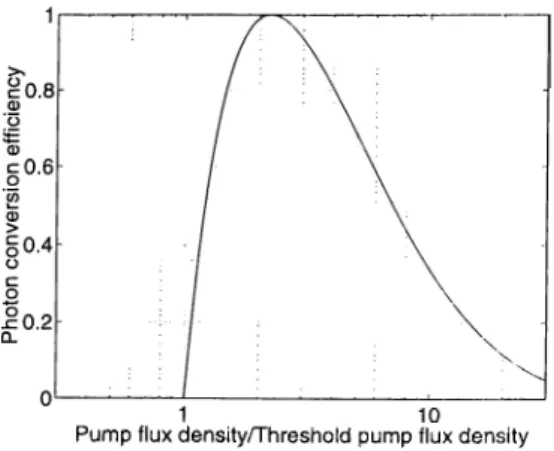
As the loss in tlu' cavity increases, the threshold intensity increases as well. An important measure of performance of an OPO is the conversion efficiency. The photon conversi(ui efficiency of OPO’s is defined as
a\{l)
Π — ~ R oc) (2.45)
oi(0)·
Figure 2.4 presents the photon conversion efficiency vs. pump intensity values of an OPO. The parameters of the OPO are arbitrarily chosen as: A 2 mm long nonlinear crystal with dg = 3.6 x a signal beam at 1571 nrn, and a pump beam at 1064 nrn. Rqc is chosen as 50%, and there are no useless lo.sses. The pump intensity values are normalized with respect to the threshold pump intensity of the OPO. As seen in Figure 2.4, the photon conversion efficiency increases to 100%. At this point, the pump is totally depleted. If we increase the pump intensity further, the efficiency drops because of backconversion. For a specific pump intensity value, a loss value can always be found which maximizes the conversion efficiency value. Therefore, output coupler reflectivity is an important design parameter for OPO’s, given the pump intensity.
Power conversion efficiency is the ratio of the output signal power and the in put pump power and the relationship between the photon conversion efficiency (r/) and the power conversion efficiency is
dpower — 'Π
a<3
(2.46)We can also investigate the OPO’s according to their temporal behavior. In cw and nanosecond OPO’s, pump pulse lengths are usually longer than cavity lengths, so signal makes many round trips as the pump passes through the cavity.
In ultrafast OPO’s, the pulse lengths are almost always shorter than the cavity lengths, so the OPO cavity length should be adjusted such that each pump pulse meets the resonant signal in the cavity. After several round trips of the signal, OPO reaches a steady state.
These analytical solutions explain the behavior of cw OPO’s operating with plane waves. Analytical solutions which take into account the temporal and spatial beam profiles of the fields do not exist. Therefore, such physical effects can be handled by numerical models.
Chapter 3
Historical R eview of Nanosecond
OPO Experim ents
OPO’s, as efficient and widely tunable coherent light sources, have attracted the attention of many researchers since their first demonstration in 1965 [1]. This chapter establishes a perspective on the progress of nanosecond OPO’s from their invention up to the present. We classify the experiments according to the spectral range they cover, such as near-UV and visible, visible and near-IR, and mid-IR, and for each range we investigate the OPO experiments according to the crystals they employ.
An OPO crystal should satisfy some properties in order to achieve oscilla tion [9]. First of all, OPO crystals must have high nonlinearity in order to provide sufficient gain. Secondly, the birefringence of the crystals should be adequate for phase matching within their transparency ranges. As the third requirement, the crystals should have high optical damage threshold, since large pump intensities are required for the oscillation to start. They must also have high optical quality and be long enough. Most of the crystals employed in optical parametric pro cesses are LiNbO;i, LilOa, ККЬОз, KTi0 P04 (KTP) and its isomorphs, such as KTA, СТА, RTA, RTP for the visible, and near IR; /if-BaB20,i (BBO), Р1Вз05 (LBO), and urea for the visible, and near UV; chalcopyrites (AgGaS2, AgGaSe2, ZnGeP2, and CdGaAs2), Т1зАз8ез, and GaSe for the mid-IR [9], [10], [6]. Pump lasers employed in the nanosecond OPO experiments are generally the; fundamen tal, and the harmonics of Nd:YAG lasers, Nd:YLF lasers, Ti:sapphire lasers, and excimer lasers.
this subject. In this chapter, we emphasized on the experiments conducted after 1980’s, but also included the milestone works of 1960’s, and 1970’s as well.
3.1
N anosecond O P O ’s in V isible and N ear-IR
3.1.1 LiNbOg OPO’s
Until 1980’s OPO’s generally employed LiNbOa (lithium niobate) crystals which have damage threshold intensity on the order of 100 MW/cm^, and transparency range from 0.8 μιη to 3.5 μη\ [6]. As other crystals appeared, the popularity of LiNbOa substantially decreased in the eighties and nineties, except the growing interest in periodic-ally poled LiNbOa (PPLN) crystals in late-nineties [11], [12], [13].
I ’he first OPO was a nanosecond doubly resonant OPO, and it was demon strated by Giordmaine and Miller [1] in 1965. They obtained less than 1% con version efficiency, with a tuning range from 0.97 μχί\ to 1.15 μ\χ\ by tempera,ture tuning. Later Bjorkholm [14] performed the first singly resonant OPO experiment with a 0.94 cm long LiNbOa crystal in 1968. Bjorkholm reported 22% conversion from pump power to signal power in a doubly resonant configuration and 6% conversion in a singly resonant configuration.
Harris [15] reviewed the studies on OPO’s up to 1969 with a detailed theoreti cal analysis. In those years other than the LiNbOa crystal, KDP and Ba-aNaNbsOir, crystals were used in the OPO experiments.
By the end of 1972, LiNbOa crystals up to 5 cm were available [9]. The highest conversion efficiency up to that time was reached by Wallace [16] in 1970. They achieved approximately 67% pump depletion, and 46% conversion to both signal and idler in the spectral range from 0.54 ^m to 3.65 μια.. Tuning of the OPO was achieved by using different transitions of the pump laser and temperature tuning of the LiNbOa crystal.
In another experiment, Herbst et al. [17] demonstrated a singly-resonant angle-tuned OPO and obtained 15% conversion efficiency. Pump threshold inten sity was approximately 30 MW/cm^. The oscillator covered the entire 1.4-4 μ,ιη spectral range.
In 1979, Brosnan and Byer [18] described a theoretical model for time depen dent OPO threshold pump powers, and also they built Nd;YAG laser pumped SROPO’s with LiNbO.3 crystals. They both computed numerically and observed
experimentally ΟΡΟ threshold intensities by varying the cavity length, crystal length, signal reflectance of the output coupler, pump spot size, and pump pulse width parameters separately. The pump threshold values varied from 0.2 .J/crn^ to 0.5 J/cm^. They obtained 18% conversion to signal and idler. Their model was in agreement with the demonstrated results.
In a recent experiment in 1996, an intracavity optical parametric oscillation configuration was implemented. By inserting a LiNbO.j OPO into a pump laser (a diode pumped NchYAG laser) cavity, Lavi et al. [19] utilized two advantages. The first advantage is that intensity inside the cavity is always larger than the intensity coupled to the outside. As the second advantage, effective length of the interaction increased due to the many round trips of the pump beam. In the experiment, threshold pump intensity was about 9 MW/cnP, and they obtained 1.8% conversion efficicaicy from diode energy inside the cavity to idler at 3.7 μηι. By angle tuning they obtained outputs from 3.3 μηι to 4.15 μηι.
3.1.2 KNbOs OPO’s
KNbO;j (potassium niobate) crystal is a biaxial crystal which operates in the near-IR region of the spectrum. It has large effective nonlinear coefficient, large transmission range (400-4500 nm) and high damage threshold. KNbO,·} OPO’s are usually pumped by the fundamental or the second harmonic of Nd:YAG lasers [20], [21], [22], or Tirsapphire lasers [23].
In 1982, Kato [20] accomplished parametric oscillation in a Type I noncrit- ically phase matched (NCPM) crystal KNbO.j which was tunable over 0.88 1.35 μm region by temperature tuning. He obtained 32% conversion from pump power to signal and idler powers and threshold pump intensity was measured as 3.5 MW/cm%
Another type I phase matched KNbOa OPO was reported by Urschel et al. [21] in 1995. They achieved a tuning range of 1.45-2.01 μm for signal and 2.27 4.0 μηι for idler. Threshold intensity was 65 MW/crn^ and when pumped twice the threshold, 14% conversion efficiency was achieved.
Type II phase matched KNbOa OPO’s were first demonstrated by Bosenberg et al. [22] in 1993. These OPO’s were operating at 1.87 μηι signal and 2.47 μηι idler wavelength with 240 MW/cm^ threshold intensity. In a similar configuration but a cavity employing a type I phase-matched KNbOs crystal at the same sig nal wavelength, threshold intensity was 145 MW/cm'-^. Since effective nonlinear
coefficient of type II phase matching is less than type I phase matching.
By using a tunable Ti:sapphire laser as the pump source, Rambaldi et al. [23] constructed a KNbOa OPO, and obtained tuning ranges of 908 nrn to 1402 nrri for the signal, and 2103 nm to 3803 nrn for the idler. Oscillation threshold was 15 MW/crn^. Maximum signal output they had obtained was 3 rriJ at 70 m.J pump energy where this value is limited by the low damage threshold of the OPO mirror coatings.
3.1.3 KTP OPO’s
KTP is a biaxial crystal operating in the near-IR range. KTP crystals are grown by either hydrothermal or flux methods. KTP crystal has many advantages over the other crystals in the same spectral range. The damage threshold of the KTP (~1 GW/cm^) crystal is much higher than LiNbO.i (~140MW/cm^) crystal. It has a broad transparency range (0.35 μνα to 4.3 //m). However, efficiency of the OPO outputs between 3-4 μνα is lower because of the weak multiphonon absorption at ~3.5 μηι [6]. KTP OPO’s are usually pumped by the fundamental and the second harmonic of NdrYAG lasers, Nd:YLF lasers, or Ti:sapphire lasers.
In 1989, Burnham et al. [24] demonstrated the first KTP OPO with a 6 mm long flux grown KTP crystal. The OPO was pumped by an Nd:YAG laser. They achieved optical parametric oscillation near degeneracy at 2.12 μπι with a threshold intensity of 40 MW/cm^. Soon after, Lin et al. [25] reported a tunable KTP OPO (between 1.8-2.4 μνη) pumped by an Nd:YAG laser, and achieved approximately 2.4% conversion efficiency.
Tunable IR generation around 3.2 μιη from a KTP OPO was experimentally demonstrated in 1991. Kato [26] achieved 35% pump depletion and 18% conver sion to 1579 nm, and 5% conversion to 3264 nm with a pump threshold intensity of 80 MW/cm^.
Between 1991 1993, Marshall et al. [27], [28], [29] carried out eye-safe OPO experiments. In these experiments, the OPO’s were pumped by Nd:YAG lasers, and flux-grown KTP crystals were used. In the first experiment, Marshall et al. [27] reported threshold intensity as approximately 100 MW/crn^, and conver sion efficiency as 25% to the eye-safe signal at 1.61 //m with a 15 mm long crystal. Soon after in 1991, Marshall et al. [28] obtained 35% conversion efficiency from 1.064 μιη pump to 1.61 μτη signal in a confocal cavity. In 1993, Marshall and Kaz [29] reported 47% conversion efficiency with a 20 mm long flux grown KTP
crystal. The threshold intensity for the oscillation was about 38 MW/crn^. OPO’s generating narrow linewidth outputs are necessary in some applica tions, such as high resolution spectroscopy. For this reason, KTP OPO’s with narrow linewidths were constructed either by injection seeding the OPO’s [30], or by inserting some étalons [31], gratings [32] to the OPO cavities. In these experiments linewidths less than 500 MHz were obtained.
KTP OPO’s pumped by tunable lasers are demonstrated in 1992 by Jani et al. [33] where the pump laser was a tunable alexandrite laser (720 800 nm range). Their OPO was doubly-resonant. They obtained 2.25% total conversion efficiency to both signal (1527 -1540 nm) and idler (1399-1616 nm). In a coasecutive study, with the same pump source, Jani et al. [34] achieved the first optical parametric oscillation in KTA crystal. The tuning range for both the idler and the signal was 1400-1700 nm. With a 7 mm KTA crystal, they obtained approximately %0.4 total conversion efficicmcy.
Another tunable laser pumped KTP OPO was constructed by Zenzie et al. [35] in 1994, with a Tiisapphire laser. By using a NCPM 15 rnm long flux grown KTP crystal, they achieved signal and idler outputs in the spectral range of 1030- 1280 nm and 2180-3030 nm, respectivelj^ They achieved %45 total conversion efficiency. They also reported degenerate OPO operation with a type I phase matched KNbOs crystal, and measured 44% conversion efficiency.
In two studies, Nd:YLF pumped KTP OPO’s with low pump threshold ener gies are reported by Terry et al. [36] in 1994, and Tang et al. [37] in 1997. Terry
et al. [36] measured threshold energies less than 0.5 rnJ. In their experiment, con version efficiency was 20%, whereas the pump depletion was 50%. The OPO was employing a flux grown, 20 mm long KTP crystal in a NCPM geometry, where the signal and idler wavelengths were 1.54 μηι and 3.28 μιη, respectively. They also developed a model for computing the threshold energies which takes into account unequal absorption coefficients of the beams in a nonlinear crystal.
A numerical model of nanosecond OPO’s was developed by Smith et al. [38] at Sandia National Laboratories, and they obtained experimental results that are in agreement with the model. In the experiments, they constructed an injection seeded ring OPO cavity employing a 10 mm KTP crystal, and pumped the OPO with the second harmonic of an injection seeded Nd:YAG laser. They measured 0.7 J/crn^ threshold energy fluence, and achieved 29% conversion to signal at 780 nm. In a later study in 1997, the same group of researchers experimentally
demonstrated and numerically modeled parametric amplification and oscillation processes with walkoff compensating crystals in a similar manner (Armstrong et al. [39]).
3.2
N anosecond O P O ’s in N ear-U V and V isible
3.2.1 Urea OPO’s
The studies on urea OPO’s began in 1984 [40] and continued until early nineties. Unlike the OPO’s built up to that time, urea OPO’s exhibit tunability from blue- green up to near-IR. However, urea crystal has significant disadvantages. One of the disadvantages is its low damage threshold (~180 MW/cnU) [10]. Moreover, in order to obtain a usable sized crystal, a long time period (on the order of one year) is required. Urea OPO’s are generally pumped by the third harmonic of Nd:YAG lasers at 355 nni [40], [41], [42], [43] or excimer lasers at 308 nni [44], [45], [46].
In the first urea OPO experiment, Donaldson et al. [40] achieved 6% conversion efficiency from pump at 355 nm to idler at 1.22 μ,ιη with a 13 mm long crystal. Soon after, with the same OPO configuration Rosker et al. [41] demonstrated 8.5% conversion to signal between 498-640 nm with a 23 nirri crystal.
Excimer laser pumped urea OPO experiments were carried out in the .]. F. Allen Physics Research Laboratories between 1988 and 1990. In the first experi ment, Ebrahimzadeh et al. [44] reported 2.5% conversion efficiency with an 8 mm long crystal. Later by employing a 15 mm long urea crystal and double-passing the pump beam through the OPO cavity, they reached 37% conversion efficiency from pump to both idler at 670 nm and signal at 570 nm [45]. Oscillation thresh old intensities were about 16-20 MW/crn^. In the third experiment, Henderson et al. [46] obtained OPO outputs from 537 run to 720 nm by angle tuning. In this case the urea crystal was 25 mm long, and the oscillation threshold intensity was 2.3 MW/cm^. They obtained approximately 26% efficiency from pump to signal at 570 nm.
3.2.2 BBO OPO’s
BBO (^-barium borate) crystal was introduced in 1986. BBO crystals have significant superiority over the urea crystals operating in similar spectral ranges. They have higher damage threshold (~10 GW/cm'^ for BBO vs. ~180 MW/crn^
for urea) and larger transparency range (0.2-3.3 μ,ιη for BBO vs. 230-1020 nrn for urea). They are mechanically robust, chemically stable, and can be grown easier than urea crystals [10]. However, BBO crystals are hygroscopic. BBO OPO’s are generally pumped by the second, third and fourth harmonics of NdiYAG lasers or excimer lasers. In optical spectroscopic applications (such as photoacustic absorption, optical double resonance, and coherent Raman spectroscopy) BBO OPO’s are used. [47], [48].
Earlier BBO OPO’s suffered from lower efficiencies because of the low dam age threshold of OPO mirrors, poorer quality of the crystals, and large walkoff imposed by the phase matching geometries. In the first BBO OPO experiment. Fan et al. [49] obtained 10% conversion efficiency in a tuning range of 0.94 μη\ to 1.22 μτα by pumping the OPO with the second harmonic of an Nd:YAG laser. In 1988, Cheng et al. [oO] reported 9.4% conversion efficiency by pumping their BBO OPO with the third harmonic of an NdiYAG laser. In another study. Fan et al. [51] accomplished 13% conversion to signal at 532 nm, and 11% conversion to idler at 1064 nm.
In three consecutive studies of Bosenberg et al., a novel cavity design for BBO OPO’s was presented [52], [53], [54] in 1989, and 1990. They inserted a pair of pump reflecting mirrors at Brewster angle with respect to the cavity axis, just after the OPO cavity mirrors. Therefore, pump transmission condition of the cavity mirrors had been abolished. In the first experiment [52], the pump source was the fourth harmonic of an Nd:YAG laser at 266 urn. By rotating the crystal, the OPO outputs were tuned from 0.33 μπι to 1.37 μ,ηι. In order to minimize walkoff effects, in the second experiment, Bosenberg et al. [53] used two BBO crystals in a proper orientation such that walkoff created by the first crystal is eliminated by the second one. They accomplished 32% total conversion efficiency throughout the 0.42-2.3 μιη spectral range. Walkoff compensation provided a remarkable increase in the efficiency when compared to the other designs.
In 1988, Komino [55] constructed an XeGl excinier laser pumped BBO OPO, and measured 10% conversion efficiency. The tuning range was between 422- 477 nm for the signal. Other excimer laser pumped BBO OPO studies were performed by Ebrahimzadeh et al. [56] in 1990. They achieved more than 10% conversion efficiency in the 354-2370 nrn spectral range. The pump threshold intensities were between 12.5 28 MW/cm^ throughout the tuning range.
Highly efficient BBO OPO’s are obtained by double-pass OPO cavity config urations [57], [58]. In 1991, Wang et al. [57] achieved 41% conversion efficiency in such a configuration. This OPO was tunable over the 415 2411 urn spectral range.
Although noncollinear phase matching of a LiNbOu OPO was first demon strated in 1969, little work was carried out on noncolliiKiar i)hase matching until 1994. Gloster et al. [59], [60] demonstrated nanosecond noncollinearly phase- matched BBO OPO’s. They pumped these OPO’s by the second or the third harmonic of an Nd:YAG laser, and achieved maximum .31% conversion efficiency. Another noncolliiK'.arly phase matched BBO OPO experinieni, was reported by Lee eJ, al. [61] in 1997. Their pump was the second harmonic of an Nd:YAG laser. In a double-pass pump configuration, they achieved 23% conversion efficiency.
In BBO OPO’s, effective nonlinear coefficient for type I interactions is larger than type II. So a few type II phase matched BBO OPO experiments were per formed [54], [62]. The maximum conversion efficiency obtained in type II OPO’s is 25% by Wu et al. [62] in 1997.
3.2.3 LBO OPO’s
BBO and LBO (lithium triborate) crystals have similar growth techniques. Ef fective nonlinear coefficient of LBO crystal is less than BBO, and LBO has a smaller tuning range. However, this new crystal offered some advantages over BBO for OPO applications in the UV spectral range. Among these advantages are the higher damage threshold, possibility of noncritical phase matching, smaller walkoff, and outputs with narrower linewidths because of smaller birefringence [6].
The first LBO OPO was reported by Kato in 1990 [63]. By pumping tlu' OPO with the second harmonic of an Nd:YAG laser, he achieved a tuning range of 0.95 1.006 μηι and 1.130 1.210 μη\ in a type 11 NCPM configuration. The oscillation threshold intensity was approximately 220 MW/cm'·^. He obtained 1% conversion efficiency with a 5 mm long LBO crystal. Soon after in 1991, Wang et al. [64] accomplished 22% conversion efficiency to visible output at 502.8 nm with a 16 mm long LBO crystal. The pump was the third harmonic of an Nd;YAG laser.
In .1. F. Allen Physics Research Laboratories, a series of nanosecond LBO OPO experiments were performed. In these experiments, pump sources were XeCl excimer lasers [65], [66], [67], fourth harmonic [68] and third harmonic [69], [70]
of Nd:YAG lasers, or second harmonic of Nd:YLF lasers [71]. Two of these experiments employed critically phase matched OPO’s [66], [70], while all the remaining experiments employed NCPM OPO’s. In the NCPM OPO’s conversion efficiencies to signal outputs up to 20% and pumj) depletions up to 40% were obtained. In critically phase matched LBO OPO’s, comparable results to BBO OPO’s were reported for threshold energy fluences (~0.2 J/crti'^ for BBO OPO’s, ~0.3 J/cnP for LBO OPO’s) and pump depletions (50% for BBO OPO’s, 40% for LBO OPO’s). In 1992, Tang et al. [68], demonstrated the hrst LBO OPO pumped by the fourth harmonic of an Nd:YAG laser at 266 nm. Their OPO generated signal output at 314 nm, which is the shortest OPO output obtained up to that date. Threshold pump intensity was 10 MW/cnP, and they obtained 25%i pump depletion and 10% conversion to signal and idler.
In the same laboratories, Cui et al. performed two consecutive LBO OPO ex periments by using the third harmonic of NdiYAG laser as the pump source [69], [70]. In 1992, they constructed a type II NCPM LBO OPO tunable over 481-457 nm and 1355-1590 nm. Threshold energy was 0.4 rnJ. They achieved 50% pump depletion and 27% total conversion efficiency. In 1993, in a type I critically phase matched LBO OPO experiment, they obtained 35% pump depletion and 0.3 mJ threshold energy [70]. The signal and the idler beams were tuned in 455-665 nm and 760-1620 nm spectral ranges, respectively.
In 1994, Schröder et al. [72] reported LBO OPO experiments, and presented the spectral properties of the OPO’s with a numerical model. In the experiments, they pumped the OPO’s by the second, third, or forth harmonic of injection seeded Nd:YAG lasers. They obtained the widest tuning range (from 414 nm to 2.47 μνα) in a type I critically phase matched OPO with the third harmonic of the Nd;YAG laser as the pump source. In this case, total conversion efficiency was approximately 45%.
3.3
N anosecond O P O ’s in M id-IR
Remote chemical sensing in 3-5 μνα and 8-12 μπι spectra is important in some mil itary and civilian applications. OPO’s employing AgGaSe2, AgGaS2, TlsAsSe.·], and CdSe crystals are promising sources in the rnid-IR spectral range [6].
Eckardt, et al. [73] conducted the first AgGaSe2 OPO experiment in 1986. They achieved tuning ranges of 1.6-1.7 μιη and 6.7-6.9 μηι when pumped by
an Nd:YAG laser at 1.34 μιη; and tuning ranges of 2.65-9.02 μ,ιη when pumped by an Ho;YLF laser at 2.05 μηι. In the experiments, they achieved conversion efficiencies up to 18%.
In another experiment, Kirton [74] pumped an AgGaSe2 OPO by the output of a LiNbOa OPO generating 2.54 nm signal. The signal and idler wavelengths of the AgGaSe2 OPO were 4.1 μιη and 6.7 μηι, respectively. They measured the OPO threshold energy as 0.6 m.I, and conversion efficiency as 0.5%.
By constructing two different OPO’s pumped by the same laser, Allik et al. [75] obtained OPO outputs covering the whole 7-12 μιη spectral range. They carried out Cr,Er:YSGG laser pumped (at 2.79 μιη) CdSe OPO experiments generating outputs at 8.5-12.3 μηι spectral range with a 39% total conversion efficiency. They also presented ZnGeP2 OPO experiments pumped by the same laser with a tuning range of 6.9-9.9 μιη, and achieved 29% total conversion efficiency.
In this chapter, nanosecond OPO experiments are reviewed. As a result of advances in nonlinear crystal technology, OPO’s are becoming powerful solid state sources of tunable radiation. In the earlier days, OPO’s were operating in the near-IR (usually LiNbOa OPO’s) where the OPO crystals suffered from low threshold energies. Nowadays, KTP, BBO and LBO are the most widely used nonlinear crystals. In many nanosecond OPO exi)eriments high conversion efficiencies are obtained. Moreover, tunable OPO’s with very large tuning ranges (from 0.4 μm to 2.5 μιη [53], [57]) were reported.
Using OPO’s in frequency conversion has important practical consequences, such as obtaining eye-safe radiation from an OPO. In 1993, Marshall et al. [29] reported 47% power conversion efficiency to eye-safe output with a flux grown KTP crystal, and they pumped the OPO’s up to 20 rnJ at 1.06 μηι. In this thesis, we have constructed OPO’s for obtaining eye-safe radiation. These OPO’s are either pumped at less than 30 mJ (low energy OPO’s) or at 100 rnJ (high energy OPO’s).
Chapter 4
ΟΡΟ Experim ents
The goal of our experiments is to convert the output of Nd:YAG lasers at 1064 urn wav(;length to the eye-safe band of the spectrum (1.54 1.60 μιη) for two different applications. These applications are range finders generating 15 mJ pulses with 7 ns pulse duration, and target designators generating 100 rnJ pulses with 15 ns long pulse duration. For this purpose, we designed, implemented and character ized three different KTP OPO’s in three experimental sets. In the first exper imental set, the OPO’s are pumped up to 20-28 m.J. In the second set, pump beam intensity on the KTP crystal is increased, and the OPO’s are pumped up to 15 20 mJ. Therefore, suitable OPO’s for low energy applications (range finders) that operate at 15 rnJ are provided. In the third set, the OPO’s are pumped by pulses of energy up to 100 mJ and duration of 15 ns for high energy applications (target designators). This chapter presents experimental setups and the results of these experiments.
4.1
E xperim ental Setup
This section presents the properties of the pump laser and the nonlinear crystal (KTP) used in the experiments. After this, cavity configurations are described. Finally, the methods used to characterize the OPO’s are discussed.
4.1.1
Pump Laser
In the OPO experiments, we use a flashlamp pumped Q-switched Nd:YAG laser (Powerlite 6020, by Continuum) at 1064 nm wavelength. This laser is an electro- optically Q-switched laser generating 20 pulses in a second (20 Hz repetition rate).
Q-switching is one of the common methods to obtain nanosecond pulses. In a Q-switched laser, resonator loss is increased periodically. During the high loss period, the inverted population of the laser gain medium increases since there is no oscillation. When the loss is reduced suddenly by the Q-switch, oscillation starts and a pulse is generated.
Q-switch delay is the time delay from the on-tinu; of the flashlamp to the on-time of the Q-switch. The energy and duration of the pulses depend on the Q-switch delay of the laser. In the experiments, pump pulses with two different pulse durations (7 ns and 15 ns) are generated by adjusting the Q-switch delay appropriately.
The laser generates pulses up to -300 ni.J energy. In the hist two experimental sets where the pump eiu'rgy values are less than 30 rn.J, the OPO pump is obtained by the surface rehection of the full energy beam from a glass wedge. In all experiments, variable OPO pump energies are obtained by using a half wave plate and a polarizer.
4.1.2 Crystal
In the experiments, a hydrothermally grown KTP crystal produced by Cleveland Crystals is used. The KTP crystal is 22.4 mm long, with a 6.0 x 6.0 mm cross sec tional area. It has anti-rehectiori coatings for both signal and pump wavelengths with reflectivities of less than 1.0% and 1.5%, respectively.
For KTP OPO/OPA experiments, usually type-II phase matching is used because of the higher effective nonlinear coefficient of type-II interactions. It is also preferable to achieve phase matching along one of the optic axis of the crystal because of zero walkoff angle. In these experiments, the direction of the propagation is along the x axis, so phase matching condition is satisfied at Θ = 90° and Φ ~ 0°. The effective nonlinear coefficient is 3.6 x 10“ ^^ rn/V [76].
When type-II NCPM interaction is employed with 1064 nm pump beam, the signal and idler wavelengths are computed as 1571 nm and 3297 nm, respectively, where the signal wavelength is in the defined eye-safe band. The signal and the pump beams are both p-polarized (fast axes), and the idler is s-polarized (slow axis).
wavelengths (λ) according to the Sellmeier equations [77]
rii — A i + ^2 _ (J2 ~ t = X, y, z (4.1)
where Ai, Bi, Ci, and Di are the Sellmeier coefficients, and A is in //rn’s. Sellmeier coefficients for h3'^drothermally grown KTP crystals are given in Table 4.1 [77].
A B C D
X 2.1146 0.89188 0.20861 0.01320
y 2.1518 0.87862 0.21801 0.01327
z 2.3136 1.00012 0.23831 0.01679
Table 4.1: Sellmeier coefficients of hydrotherrnally grown KTP crystals
Using the Sellmeior equations, the refractive indices of each wave are calcu lated as:
Refractive index pump 1.74754 signal 1.73635 idler 1.77102
Table 4.2: The computed refractive indices that pump, signal and idler experience in NCPM type-II interaction.
In the experiments, the damage threshold of the KTP is an important re striction on the peak pump intensity values. The damage threshold of the KTP crystals are reported as approximately 1 GW /cnP at 1064 nm [6]. In the single pass and double-pass OPO experiments, we applied pulses having peak intensities less than 250 MW/cnU, and 200 MW/cnU, respectively. We estimate the surface' damage threshold of the KTP between 0.5-1 GW/errU.
4.1.3 Cavity Configurations
In the experiments, OPO’s with two different cavity conhgurations have been constructed. In one configuration, the pump beam passes through the cavity once (single-pass OPO). Therefore, depleted pump is coupled out of the OPO cavity besides the signal beam. The signal and the dephited pump are separated