EEG CORRELATES OF AUDIOVISUAL
ASSOCIATIONS IN MOTION PERCEPTION
a thesis submitted to
the graduate school of engineering and science
of bilkent university
in partial fulfillment of the requirements for
the degree of
master of science
in
neuroscience
By
Gaye Benlialper
December 2018
EEG Correlates of Audiovisual Associations in Motion Perception By Gaye Benlialper
December 2018
We certify that we have read this thesis and that in our opinion it is fully adequate, in scope and in quality, as a thesis for the degree of Master of Science.
Hacı Hulusi Kafalıg¨on¨ul(Advisor)
Murat Perit C¸ akır
Burcu Ay¸sen ¨Urgen
Approved for the Graduate School of Engineering and Science:
Ezhan Kara¸san
ABSTRACT
EEG CORRELATES OF AUDIOVISUAL
ASSOCIATIONS IN MOTION PERCEPTION
Gaye Benlialper M.S. in Neuroscience Advisor: Hacı Hulusi Kafalıg¨on¨ul
December 2018
The process of associative learning has been considered to be one of the promis-ing research areas in neuroscience to understand human perception, sensory plas-ticity, and multisensory integration that affects the way of perceiving external environment. Evidence suggests that associative learning causes unexpected low-level sensory plasticity in brain. Yet, how this effect occurs in low-low-level visual motion areas remains unclear. In order to examine the effect of audiovisual as-sociations on visual motion perception, we conducted an experiment in which subjects are exposed to pre association test, associative learning and post asso-ciation test phases. Moreover, EEG was recorded simultaneously to investigate neural mechanisms behind this effect. In associative learning task, a particular sound (low-frequency or high-frequency) was accompanied with a specific direc-tion of random dot modirec-tion (leftward or rightward), and participants were asked to attend both sound and direction. Pre- and post-association tasks in which auditory-only, visual-only, audiovisual trials were presented are identical. During these trials, participants were asked to decide the direction of moving dots with a keypress except in auditory-only trials. We hypothesized that there will be signif-icant differences in responses between pre- and post-association phases in accord with associative pairings that were given in associative learning phase. T-test re-sults validated our hypothesis with a significance level at 0.01 (p-value = 0.008). In terms of neural mechanisms behind this effect, we also hypothesized that this effect originates from feedback mechanisms. ERP results indicated that associa-tive learning influences early temporal processes (100-150 ms) to auditory only condition, and interaction effect occurs late in time after stimulus onset (around 500 ms). In this context, ERP results supports the hypothesis by revealing that modulation in early temporal areas transmits information to high level associa-tion areas that project informaassocia-tion to low level visual areas, thus high latency is observed after stimulus onset.
iv
Keywords: Associative learning, audiovisual integration, motion perception and EEG.
¨
OZET
HAREKET ALGISINDAK˙I G ¨
ORSEL-˙IS
¸ ˙ITSEL
C
¸ A ˘
GRIS
¸IMLARIN EEG KORELATLARI
Gaye Benlialper N¨orobilim, Y¨uksek Lisans
Tez Danı¸smanı: Hacı Hulusi Kafalıg¨on¨ul Aralık 2018
C¸ a˘grı¸sım yoluyla ¨o˘grenme, insan algısı, duyusal plastiklik ve ¸cokduyusal entegrasyon gibi dı¸s ¸cevremizi algılayı¸sımızı etkileyen etmenleri anlamamız i¸cin n¨orobilim alanında gelecek vadeden ara¸stırma alanlarından biri olarak g¨or¨ulmektedir. Bir¸cok bulgu, ¸ca˘grı¸sım yoluyla ¨o˘grenmenin, beyinde beklenmedik erken seviye duyusal plastisiteye neden oldu˘gunu g¨osterse de bu etkinin erken seviye g¨orsel hareket b¨olgelerinde nasıl meydana geldi˘gi belirsizli˘gini korumak-tadır. Bu ¸calı¸smada, g¨orsel-i¸sitsel ¸ca˘grı¸sımların g¨orsel hareket algısı ¨uzerine etkilerini ara¸stırmak i¸cin yapılan deneyde katılımcılar sırasıyla ¨o˘grenme ¨oncesi test fazı, ¨o˘grenme fazı ve ¨o˘grenme sonrası test fazına katılmı¸slardır. Buna ek olarak, bu etkinin arkasındaki sinirsel mekanizmaları ara¸stırmak amacıyla, deney sırasında katılımcıların elektroensefalografi (EEG) aktiviteleri ¨ol¸c¨ulm¨u¸st¨ur.
¨
O˘grenme test fazında, belli bir ses tonuna (d¨u¸s¨uk frekanslı ya da y¨uksek frekanslı), spesifik bir nokta hareketi y¨on¨u (100% sola ya da 100% sa˘ga do˘gru) e¸slik etmi¸stir. Katılımcılardan hem sese hem de hareket y¨on¨une dikkat etmeleri is-tenmi¸stir. Katılımcılara dura˘gan seslere (d¨u¸s¨uk frekanslı ya da y¨uksek frekanslı) e¸slik eden rastgele nokta hareketlerinin (sola ya da sa˘ga do˘gru) g¨osterildi˘gi ve ek olarak sadece g¨orsel ve sadece i¸sitsel uyaranların da g¨osterildi˘gi ¨o˘grenme ¨
oncesi test ve ¨o˘grenme sonrası test fazları ise tamamen aynıdır. Bu fazlarda, katılımcılardan rastgele-nokta hareketlerinin y¨on¨une tu¸sa basarak karar ver-meleri istenmi¸s, sadece i¸sitsel uyaran verildi˘ginde ise tu¸sa basmadan sadece sese dikkat etmeleri istenmi¸stir. Bu ba˘glamda, ¸calı¸smanın hipotezi, ¨o˘grenme ¨
oncesi test fazı ve ¨o˘grenme sonrası test fazı arasında ¨o˘grenme test fazındaki ¸ca˘grı¸sımsal e¸sle¸smelere uygun olarak anlamlı bir de˘gi¸smenin olaca˘gı y¨on¨undedir. ˙Ikili t-test sonu¸cları, hipotemizi desteklemektedir. Bu etkinin arkasındaki sinirsel mekanizmalar a¸cısından, bu ¸calı¸smada bu etkinin geri bildirimsel etkil-erden kaynaklandı˘gı d¨u¸s¨un¨ulmektedir. Olaya ili¸skin potansiyel (ERP) sonu¸cları
vi
¸ca˘grı¸sım y¨on¨uyle ¨o˘grenmenin erken zamanlı temporal s¨ure¸cleri anlamlı olarak etk-iledi˘gini (sadece i¸sitsel uyaranlardaki P1) ve g¨orsel-i¸sitsel entegrasyonun uyaranın ba¸slangıcından 500 ms sonra ger¸cekle¸sti˘gi g¨ozlemlenmi¸stir. Bu ba˘glamda, ERP sonu¸clarının ¸calı¸smanın hipotezini destekledi˘gi s¨oylenebilir. Erken zamanlı tem-poral s¨ure¸clerdeki de˘gi¸sikli˘gin, y¨uksek seviye ¸ca˘grı¸sım b¨olgelerine bilgi ge¸ci¸si sa˘glamı¸s olabilece˘gi ve bu b¨olgelerden erken seviye g¨orsel hareket b¨olgelerine bilgi akı¸sı sonucunda g¨orsel-i¸sitsel entegrasyonun ge¸c g¨ozlemlendi˘gi sonucuna varılabilir.
Anahtar s¨ozc¨ukler : C¸ a˘grı¸sım yoluyla ¨o˘grenme, g¨orsel-i¸sitsel entegrasyon, hareket algısı ve EEG.
Acknowledgement
I would like to express my gratitude to my thesis advisor Assist. Prof. Dr. Hacı Hulusi Kafalıg¨on¨ul for allowing me to be a member of Cortical Dynamics and Perception Lab, encouraging me to be a researcher in the field of Neuroscience and his excellent academic guidance during my study.
I also would like to thank to Assist. Prof. Dr. Murat Perit C¸ akır and Dr. Burcu Ay¸sen ¨Urgen, serving as committee members for their valuable comments and suggestions. I am also very grateful to Dr. Utku Kaya, for his academic support, which was very helpful in order to conduct my experiment.
I am also very thankful to my family and dearest friends Mert ¨Ozkan, Alaz Aydın, Esra Nur C¸ atak, Ay¸senur Karaduman, Sibel Aky¨uz for their moral sup-port. Finally, I am very thankful to Ahmet Benlialper for his friendship and assistance in editing the text.
Contents
1 Introduction 1
1.1 Associative Learning . . . 1 1.2 Neural Substrates of Associative Learning and Associative
Plastic-ity in the Visual Processing Hierarchy . . . 3 1.3 Multisensory Associations and Perception . . . 8 1.4 Contributions of Audiovisual Associations to Visual Motion
Per-ception . . . 10 1.5 Feedback and Feedforward Mechanisms in the Visual Hierarchy,
and Perception . . . 13 1.6 Content and the Specific Aims of the Study . . . 17 2 Behavioral Methods and Results 21 2.1 Methods . . . 21 2.1.1 Participants and Apparatus . . . 21 2.1.2 Stimuli . . . 22
CONTENTS ix
2.1.3 Procedure . . . 22 2.2 Behavioral Results . . . 24 3 EEG Data Acquisition, Analysis and Results 28 3.1 EEG Data Acquisition . . . 28 3.2 EEG Preprocessing and Analysis . . . 29 3.3 Results . . . 30 4 General Discussion 36 4.1 Behavioral Results Discussion . . . 36 4.2 EEG Results Discussion . . . 37 A Behavioral and T-test Results for Catch Trials in Pre- and
List of Figures
1.1 Paired-association task including twelve pairings of fourier descrip-tors in the experiment of Sakai and Miyashita [1]. After train-ing, monkeys were expected to retrieve the paired-associates when one of the pairing (associated cue) was presented by a lever press (Adapted from Sakai and Miyashita [1]). . . 4 1.2 Paired-associate learning task in the experiment conducted by
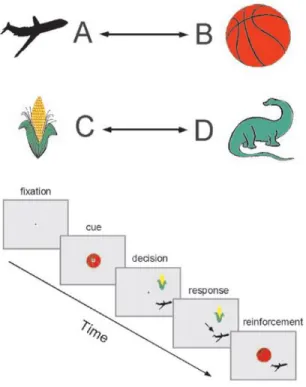
Messinger et al. [2] Paired-associates were composed by select-ing out of four distinct visual images (A, B, C and D), randomly in each learning session. Associated pairs were presented to the monkeys with horizontal arrows; afterwards distractor and one of the paired-associate were presented following the presentation of other associated cue. The monkeys were expected to choose paired associates rather than a distractor by a lever press (Adapted from Messinger et al. [2]). . . 5 1.3 The three sequential cue tasks that were used by Shulman et al. [3].
In directional cue task, static arrowheads were used as a cue of di-rection of motion before the random dot display. Following, moving dots having the same direction with the cue given were presented. In passive and neutral cue tasks, the same procedure was applied except that cross sign and black square were used as a cue. The subjects were asked to detect the presence of coherent dot motion. 6
LIST OF FIGURES xi
1.4 Association task and behavioral design of the experiment from Schlack and Albright [4]. (A) Association task in which monkeys were trained to associate a particular moving dot (upward or down-ward) with a specific static arrow shape (upward or downdown-ward). (B) Behavioral task that is used to examine pairs of associates (Adapted from Schlack and Albright [4]). . . 7 1.5 Behavioral task that participants were asked to discriminate the
size of visual stimuli while the stimuli were in sync with low-frequency tone or high low-frequency tone, adapted from Takeshima and Gyoba [5] . . . 9 1.6 Sound induced flash illusion in Shams et al. [6]. The results of
representation of one of the trials in which 2 flashes are accompa-nied with 3 beeps illustrated that number of flashes was percieved as three rather than two. Adapted from Shams et al. [6]. . . 10 1.7 Visual motion detection task in Meyer and Wuerger [7]. The
ran-dom dot kinematogram at different coherence levels (0%, 50% and 100%) were used as visual stimuli whereas white noise cross-fading between left and right ear of the speaker was used as auditory stimulus. . . 11 1.8 The effect of sound on visual apparent motion: The experimental
design from the study from Teramoto et al. [8]. Participants were exposed to apparent motion in adaptation session in which two white circles were placed side by side and presented to observers in alternation. During the experiment, participants were subjected to high frequency tone (low frequency tone) that was synchronized to the onset of the leftward circle (rightward cirle), whereas low frequency tone (high frequency tone) was synchronized to the onset of the right circle (left circle). In test session, participants were asked to judge the direction of motion when blinking static white circles that were synchronized with high and low frequency tones. 13
LIST OF FIGURES xii
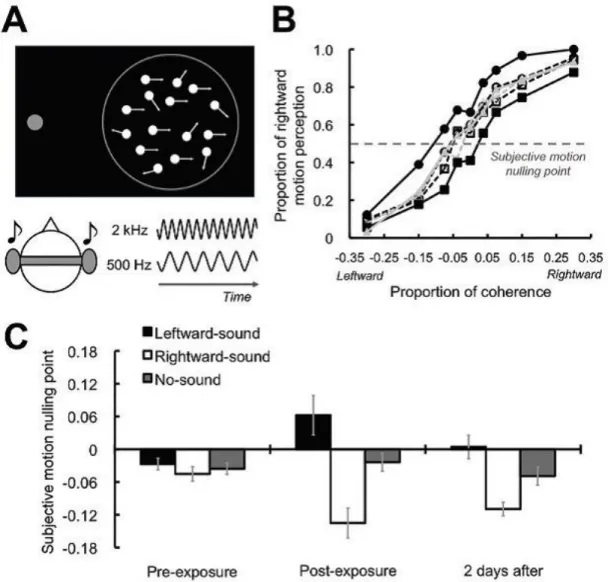
1.9 Sound-contingent visual motion aftereffect: Behavioral and exper-imental results of the experiment conducted by Hidaka et al. [9]. (A) Global motion display at different coherence levels that were accompanied by high or low frequency tone during pre- and post-exposure test phases. (B) Behavioral results showing the effect of sounds on visual motion perception for each condition (rightward sound, leftward sound and no sound conditions were denoted by circle, square and triangle, respectivelty). (C) Subjective motion nulling posint for each condition for pre-exposure session, post-exposure and two days after the experiment. Adapted from Hidaka et al. [9]. . . 19 1.10 Experimental procedure and visual (random motion and
reverse-phi motion) and auditory stimuli (low-frequency and high fre-quency) in association phase in the study of Kafalıg¨on¨ul and Oluk [10] 20 2.1 Experimental procedure illustrating trial sequences. (A) Pre- and
post - association test phases. (B) Association phase. . . 26 2.2 Behavioral results. Group averaged data (n=12) for pre- and
post-association test phases in terms of percentage differences in right press under the condition of rightward and leftward sound. Error bars represent the standard errors of mean (SEM). . . 27 3.1 T -test results on the averaged ERP amplitudes that demonstrate
significant effect in unimodal auditory (a), unimodal visual (b) and audiovisual (c) waveforms before and after association learning phase for different p-values (.001, .01, and .05, from darker to lighter gray shades). . . 31
LIST OF FIGURES xiii
3.2 Scalp topographies (a) Topography of auditory-only condition in frontal electrodes at selected time window [90-150] ms. (b) Topog-raphy of audiovisual condition in occipital electrodes at selected time window [460-490] ms. (c) Topography of audiovisual condi-tion in occipital electrodes at selected time window at [500-520] ms. . . 33 3.3 Averaged ERPs to auditory-only condition at frontal areas (a) and
to audiovisual integration (AV-A-V) at and parieto-occipital and occipital electrodes(b) -(c) at selected time windows. . . 34 3.4 Averaged ERPs to visual-only and audiovisual conditions. . . 35 3.5 Averaged ERP to audiovisual integration (AV-A-V) at
parieto-occipital and parieto-occipital electrodes at selected time windows of interest. 35 4.1 Hypothetical feedback (FB) information processing underlying the
effect of audiovisual associations on low-level visual motion areas. Adapted from Kafaligonul [11] (feedback: FB, feedforward:FF). . 40 A.1 Behavioral findings for pre-association test phase (a), Behavioral
List of Tables
2.1 T-test results . . . 25 A.1 T-test results for findings of catch trials in pre-association test
Chapter 1
Introduction
1.1
Associative Learning
The process of associative learning has been considered to be one of the promising research areas in neuroscience to understand human perception, sensory plasticity, and multisensory integration that affects the way we perceive external environ-ment. This process is one of the fundamental learning mechanisms for predicting upcoming sensory inputs. Classically, associative learning is defined as classical (Pavlovian) conditioning or operant conditioning. In this context, it is defined as a change in behavior as a result of the relationship between stimuli with regard to classical conditioning (as in Pavlov’s Dog example). On the other hand, this change in behavior originates from the relationship between a behavior and a stimuli (reward or punishment) according to operant conditioning [12]. How-ever, contemporary definition of associative learning comprises also short- and long-term memories of relationships among stimuli, behavior or events [13].
Formally speaking, the process depends on encoding the relationships among events, behavior, or sensory stimuli in our memory that provide necessary knowl-edge about statistical regularities in the external environment. Therefore, learned associations in memory regarding sensory domain enable observer to predict and
interpret causal and categorical relationships between events, behavior or sen-sory stimuli [14]. In this vein, associative learning is substantially significant for organisms to adapt their behavior according to the changes in their external en-vironment and to give meaning what is happening in that enen-vironment. Another importance of associative learning that has been emphasized in a vast amount of studies in the literature concerns its impact on perception. The conditioned stimuli through perceptual repetitive associations provide substantial benefit to interpret ambiguous and noisy environments, which in turn, enhance perception to be formed.
In this context, many of the experimental studies illustrate that associative learning has substantial effects on perception. In an experiment on the color per-ception of human subjects, [15] revealed that participants’ previous associative experiences about objects (e.g., banana and tomato) have an effect on their color perception. In other words, subjects reported that yellow is yellower and red is redder when they are asked to match color of the objects given in the experi-ment. The findings of other studies regarding perception of colors [16], [17] are in agreement with these results. In another study, the influence of visual imagery (associated letter images) on visual perception was analyzed by an experiment in which human subjects participated in a two-interval forced-choice detection task [18]. At the beginning of each trial, participants were asked to image one of the letters by the experimenter, H or T. After they image the letter, the square box in which T or H was presented, faintly. At the end of each trial, participants were asked approximately in how many trials they saw the letter vividly. According to the results, subjects had better guesses in trials in which the letter which was asked participants to image and the letter which was presented in a box unclearly were matching. All of these findings emphasize how associations affect perception dramatically and involved in sensory processing.
In the literature, there are many theories propounded by scientists to shed a light on neural underpinnings of associative learning. Although they have intrin-sically different standpoints, all of them agree upon William James’ hypothesis. According to James’ hypothesis [19], behavioral learning of association among stimuli arises when the functional connection between neuronal representations
of stimuli - that are associated with each other – converges. This hypothesis was experimentally tested by different scientists [1], [2] and the neural representa-tions of associative learning were determined especially in inferior temporal area (IT) and middle temporal area (MT) [14]. In what follows, the details of exper-iments and their relationship with associative learning-induced plasticity will be discussed.
1.2
Neural Substrates of Associative Learning
and Associative Plasticity in the Visual
Pro-cessing Hierarchy
William James’ hypothesis was tested first through an experiment conducted by Sakai and Miyashita [1]. In their experiment, two macaque monkeys were trained in a paired- association task in which there were 12 pairs of pictures (Figure 1.1). Monkeys were trained to press a lever when they retrieve one of the paired pictures after the other pair was given as a cue. If the monkeys pressed correctly, fruit juice was given as a reward. The results of the experiment indicated that there are two types of neurons in inferior temporal cortex (IT cortex), which are responsive to pictures and paired-associations at the same time, and only to pictures when the cue was presented. These results suggested that individual neurons in IT cortex can be selectively responsive to paired-associations.
These findings provide evidence for James’ hypothesis asserting that functional convergent connection between neuronal representations of stimuli is required for behavioral learning of association between stimuli to be formed. Another study supporting this hypothesis was conducted by Messinger et al. [2]. In their study, two juvenile male monkeys were trained for a paired-association task in which there were two pairings of pictures (airplane with basketball and corn with dinosaur, Figure 1.2). After the cue (one of the pairing pictures such as basket-ball), the monkeys were expected to select the other pairing matching with the cue given (airplane), when both the correct answer (airplane) and the distractor
Figure 1.1: Paired-association task including twelve pairings of fourier descriptors in the experiment of Sakai and Miyashita [1]. After training, monkeys were expected to retrieve the paired-associates when one of the pairing (associated cue) was presented by a lever press (Adapted from Sakai and Miyashita [1]). (corn) were presented. When the monkeys gave the correct response (airplane), fruit juice was given as a reward. The experimental results indicated that the responses of IT neurons can become more selective to paired stimuli whereas responses of neurons diverged for non-paired stimuli.
In both of these studies, the findings are compatible with each other. The authors of the later experiment interpreted these results meaning that neurons in IT cortex can be responsive to learned associations between stimuli, and this reflects that IT cortex may be the neural correlate of visual associative long-term memory [20].
In the bulk of the early studies, in which the neural basis of associative learn-ing was analyzed in visual system, the IT cortex was chosen to observe neuronal responses, since the temporal lobe was considered as a region where different sensory information was associated with each other. In addition to this, there is plenty of evidence arguing that IT cortex receives convergent projections from low-level visual areas and it has reciprocal connections with MTL (mediotemporal lobe) that is important for memory acquisition. In line with this, the associa-tive learning induced plasticity was thought as a specific feature of the IT cortex
Figure 1.2: Paired-associate learning task in the experiment conducted by Messinger et al. [2] Paired-associates were composed by selecting out of four distinct visual images (A, B, C and D), randomly in each learning session. As-sociated pairs were presented to the monkeys with horizontal arrows; afterwards distractor and one of the paired-associate were presented following the presen-tation of other associated cue. The monkeys were expected to choose paired associates rather than a distractor by a lever press (Adapted from Messinger et al. [2]).
which is a high-level visual area where the information is integrated in terms of visual hierarchy. However, more recent studies compared to latter ones indicate that associative learning plasticity is not limited to IT cortex and it can be a common characteristic in all sensory cortices [14]. In this context, in other ex-periment [21], human subjects were exposed to associative learning task in which the auditory stimulus signaled a visual stimulus. The positron emission tomog-raphy (PET) results showed that left dorsal occipital cortex of participants, who associatively learned, became activated when they were subjected to auditory stimulus in isolation. Similarly, Shulman and his colleagues made an experiment [3] in which human participants were exposed to directional cue task, neutral cue task and passive cue task. In directional cue task, static arrowheads were used as
a cue, before signal dots in which the dots are always moving with the same di-rection of the cue given (leftward, upward, downward, or rightward arrowheads). On the other hand, plus sign and black square were used as a cue in neutral cue task and passive cue task before the same stimuli, respectively (Figure 1.3). The fMRI results of the experiment indicate that motion-sensitive regions; left medial temporal area (MT) and anterior intraparietal sulcus and motion-insensitive re-gions were modulated by directional cue task more than by neutral cue task to the baseline of passive cue task.
Figure 1.3: The three sequential cue tasks that were used by Shulman et al. [3]. In directional cue task, static arrowheads were used as a cue of direction of motion before the random dot display. Following, moving dots having the same direction with the cue given were presented. In passive and neutral cue tasks, the same procedure was applied except that cross sign and black square were used as a cue. The subjects were asked to detect the presence of coherent dot motion.
Based on these studies, Schlack and Albright [4] designed an experiment on rhesus monkeys to elucidate the effect of associative learning on visual motion perception and its neural substrates. In their experiment, monkeys were trained to associate upward and downward static arrows with random dots moving in upward and downward direction with 100% coherence level (Figure 1.4). After the associative learning phase was over, responses of neurons to each stimuli type were recorded from visual area MT. The experimental results revealed that neurons in area MT can become responsive to static arrow images after monkeys learned to associate them to a particular direction. This provides an unprecedented evidence of associative learning induced plasticity in directional selective MT neurons.
Figure 1.4: Association task and behavioral design of the experiment from Schlack and Albright [4]. (A) Association task in which monkeys were trained to associate a particular moving dot (upward or downward) with a specific static arrow shape (upward or downward). (B) Behavioral task that is used to examine pairs of associates (Adapted from Schlack and Albright [4]).
According the findings discussed above, we can articulate that associative learning-induced plasticity may be a common feature that can be observed in sen-sory cortices. Moreover, in their study, Schlack and Albright [4] clearly showed that association-induced plasticity can be observed in low-level cortical areas in the visual hierarchy such as MT.
1.3
Multisensory Associations and Perception
As discussed in Sections 1.1 and 1.2, associative learning plays an important role in perception. However, in most of the previous studies, neural substrates of associations were analyzed in a single modality to comprehend how perception is formed. The main reason behind this originates from the traditional approach viewing perception as a modular function consisting of different and separate modalities. On the other hand, perception is operated by convergent information from multiple sensory processes [22], [23]. For instance, when you go to a picnic with your friends, sit on grass and eat something in a windy day, several sensory systems become activated. Simultaneously, you hear sounds (auditory system); you recognize faces of your friends and objects around you (visual system); you feel the pressure of the wind on your skin (somatosensory system); and you smell and taste food while you are eating (olfactory and gustatory systems). In this regard, instead of a single sensory system, all of the sensory systems are engaged simultaneously and contribute to the final perception. Accordingly, many studies on perception focused on multisensory associations to gain insight into perception in real world, and previous reports suggest that multisensory association is a common attribute of sensory processing.
In this respect, there exist studies supporting the idea that visual perception can be changed by other modalities. For instance, Takeshima and Gyoba [5] examined the effect of auditory stimulus on visual object size perception in an experiment in which participants were asked to discriminate three different sizes of visual stimuli under three tasks, which were visual-only (without auditory stimulus), visual with low-intensity tones, and visual with high intensity tones (Figure 1.5).
The findings of the experiment demonstrated that participants perceived the object size larger while they were hearing high-intensity sound, whereas the ob-jects were perceived smaller in the case of low intensity sounds. Another exper-iment [6] revealed that the number of perceived visual objects (i.e., flashes) can be changed through auditory stimulation.
Figure 1.5: Behavioral task that participants were asked to discriminate the size of visual stimuli while the stimuli were in sync with low-frequency tone or high frequency tone, adapted from Takeshima and Gyoba [5]
In this experiment, subjects were instructed to judge how many times they heard and saw beeps and flashes, respectively (Figure 1.6). In trials in which there are few and close number of beeps and flashes in quantity, subjects were inclined to perceive the same number of stimuli in both modalities (beeps and flashes).
These two experiments indicated that visual perception and auditory percep-tion can be modulated by other modalities (auditory and visual stimulus, respec-tively). There are also examples on the influence of multisensory associations on perception in different modalities such as olfaction. For instance, Morrot et al. [24] conducted an experiment in which participants who taste white wines that are artificially colored with odorless red dye are asked to judge the type of the wine. The majority of the participants reported that they perceive these wines as red wines. The findings revealed that visual stimulus can affect the perception of smell.
Figure 1.6: Sound induced flash illusion in Shams et al. [6]. The results of representation of one of the trials in which 2 flashes are accompanied with 3 beeps illustrated that number of flashes was percieved as three rather than two. Adapted from Shams et al. [6].
1.4
Contributions of Audiovisual Associations
to Visual Motion Perception
In line with earlier studies regarding the effect of associative learning on per-ception, the bulk of early research on motion perception focused on unimodal components that have an impact on motion perception. Although majority of studies stick to this conventional view, multisensory contributions to visual mo-tion percepmo-tion became an interesting research area with the improvements in psychophysical paradigms [25]. In this vein, there are studies focusing on how multimodal interactions can contribute to and effect unimodal process, and can bias or improve the perception of motion. For instance, Meyer and Wuerger [7] tested whether auditory motion accompanying visual motion stimulus has an im-pact on visual motion through visual motion detection task. In their behavioral experiment, subjects were asked to judge the direction of moving dots with vary-ing coherence levels (0%, 50% or 100%) by a key press, that were accompanied with an auditory motion stimulus (left to right or right to left), simultaneously (Figure 1.7). They found that observers were inclined to perceive random dot
motion (visual stimuli with 100% coherence) as leftward in trials in which au-ditory motion was from right to left, whereas the effect was reverse in the case when auditory motion was from left to right. This result manifests that audiovi-sual cross modality can alter the perception of motion in ambiguous trials (viaudiovi-sual stimuli with 0% coherence) and lead to changes in perceptual performance.
Figure 1.7: Visual motion detection task in Meyer and Wuerger [7]. The random dot kinematogram at different coherence levels (0%, 50% and 100%) were used as visual stimuli whereas white noise cross-fading between left and right ear of the speaker was used as auditory stimulus.
Congruently, the influence of sound on visual motion perception was revealed by other studies. For example, Sekuler et al [26] presented observers two moving small disks that converge to one another, intersect and then move apart. These small disks were presented under three different conditions. In two conditions, the disks stopped when they intersected in one or two frames, whereas they continued to move without any pause in the third one. In addition, brief static clicks were introduced with visual stimuli before and after the intersection, and when small disks intersect with each other. In each trial, observers were asked to report
whether the small disks bounce off or stream through each other. The behavioral findings indicated that observers perceived the disks as bouncing when the click sound was given near or at the time of intersection. In this vein, the authors emphasize that sound can alter the perception of visual motion and this effect can stem from feedback mechanisms from multisensory regions that are high-level in the hierarchy to primary motion areas. This study was also replicated in another research [27] offering new findings regarding the auditory grouping effect that might be used by the visual system. As reported by Hidaka et al. [9], the last two behavioral experiments considered above indicate the modulatory effect of auditory motion information on visual motion perception.
The inducing effect of auditory motion on visual motion perception was also reported in [9], [8]. In the experiment by Teramoto et al. [8], observers were exposed to adaptation and test sessions, respectively. In the adaptation session, two white circles were placed side by side and presented to observers in alternation. During the experiment, half of the participants were subjected to high frequency tone that was synchronized to the onset of the leftward circle, whereas low frequency tone was synchronized to the onset of the right circle. The reverse of the process was applied to other half of the participants. After this exposure session, subjects were participated in test session in which they were asked to judge the direction of motion. In the test session, participants were presented blinking static white circles that were synchronized with high and low frequency tones. In rightward sound condition, the first visual stimulus was synchronized with a sound associated with leftward stimuli in the adaptation phase . Then, the process was reversed in leftward sound condition (Figure 1.8). The behavioral results indicated that there was an obvious sound induced illu-sory visual motion perception, since participants were induced to perceive visual motion in test session, in which they were presented static blinking visual stimuli that was given with a particular tone after the adaptation phase. According to Hidaka et al. [9], the mechanisms that underlie this effect was still uncertain. This effect can be due to the contribution of auditory motion information to visual motion perception as it was argued, or can also originate from the audi-tory positional capture. In this context, their study aimed to shed a light on
Figure 1.8: The effect of sound on visual apparent motion: The experimental design from the study from Teramoto et al. [8]. Participants were exposed to apparent motion in adaptation session in which two white circles were placed side by side and presented to observers in alternation. During the experiment, participants were subjected to high frequency tone (low frequency tone) that was synchronized to the onset of the leftward circle (rightward cirle), whereas low frequency tone (high frequency tone) was synchronized to the onset of the right circle (left circle). In test session, participants were asked to judge the direction of motion when blinking static white circles that were synchronized with high and low frequency tones.
the mechanisms that were unclear behind this effect, and to find out the direct contribution of auditory motion information on visual motion perception.
1.5
Feedback and Feedforward Mechanisms in
the Visual Hierarchy, and Perception
The classical study by Hubel and Wiesel [28], which suggests that the recep-tive field properties of neurons differ in distinct cortical areas, paved the way for research on understanding of the information processing in visual cortical areas. In this regard, it is widely accepted that there is a hierarchical feedforward in-formation processing across visual cortical areas, and that neural responses show
alterations in different visual cortices. In other words, the information process-ing startprocess-ing from low-level visual areas in which neurons are responsive to basic features of the scene proceeds to high-level visual areas in which neurons are responsive to more complex features of the scene [29].
There is also a feedback information processing from high-level visual areas to low-level visual areas, since cortical neurons can also be adaptive under dif-ferent contexts. Depending on the behavioral task such as attention, perception, and expectation, feedback projections from higher cortical areas can alter the information carried by the neurons at different levels in the hierarchy including primary visual cortex (V1) and lateral geniculate nucleus [30]. For instance, the findings by Motter [31] illustrated that V1 neurons, which are not consid-ered responsive to focal attention, became activated in a task in which there are competing visual stimuli rather than one stimulus as in the study of Moran and Desimone [32]. In terms of expectations, McManus et al. [33] made an experi-ment on monkeys. In the experiexperi-ment, monkeys were exposed to a task in which a particular shape and a contoured cue are presented. After a delay, shape and contoured cue were represented in a random dot line segments. The results of the experiment suggest that V1 neurons, which are considered to be selective for basic components of shapes such as edges and contours, may also be responsive to more complex shapes. In this context, V1 neurons can be tuned to integrate these basic components of shapes into whole perceptual task through association field. This result emphasizes the ability of feedback projections to alter informa-tion carried by neurons in low-order visual areas (V1 in this case). The influence of feedback mechanisms were also uncovered in perceptual tasks. The experiment conducted by Schlack and Albright [4] mentioned in earlier sections is one of the significant examples of involvement of feedback mechanism in perception. As a reminder, MT neurons became active in the case of static arrow shapes since monkeys associated static arrows with particular directions previously, even if MT neurons are not selective to static objects [30]. Furthermore, multisensory research demonstrates that visual perception is not only influenced by associa-tive learning in unisensory modalities but also by multisensory associations to a
considerable extent as it was emphasized in section 1.3. In this sense, the lit-erature starts to concentrate on the effect of multisensory associations on visual perception, especially on visual motion perception. In this respect, Hidaka et al. [9] made an experiment, consisting of three tasks including pre-exposure task, exposure task and post-exposure task. In the exposure task, human participants were presented a 100% coherent global motion either in leftward or rightward direction. During the task, leftward motion onset was accompanied by a high frequency tone burst, whereas low-frequency tone burst accompanied rightward motion display. Before the exposure task, participants were subjected to a pre-exposure task in which randomly assigned global motion display with different coherencies was displayed in sync with low-frequency tone or high-frequency tone. After the exposure task, the same procedure in pre-exposure task was applied. In both pre and post-exposure tasks, participants were asked to judge whether the direction of the majority of the dots are leftward or rightward.
The findings of the experiment demonstrated that participants’ responses were similar in all coherence levels before the exposure task, and psychometric curves of the participants illustrated that tones do not have impact on visual motion perception. On the other hand, motion perception was affected by auditory tones in post-exposure task, in accord with motion direction corresponding to the tone in the exposure task. Depending on the findings, authors suggest that audiovisual associations have an influence on the direction of motion perception and they can generate new neuronal representations between these modalities.
In this context, Kafaligonul and Oluk [10] conducted an experiment to in-vestigate the effect of audiovisual associations on low-level pre-attentive visual motion processing by using regular and reverse-phi random dot motions. Similar to the work of Hidaka et al. [9], there were three phases in their experiment involving pre-association test phase, association test phase, and post-association test phase. Pre- and post-association phases were the same in both experiments in which regular and reverse-phi random dot motions -with rotation being either clockwise (CW) or counter-clockwise (CCW)- were displayed with a static tone that can be high or low frequency. During these sessions, human subjects were instructed to attend both visual and auditory stimuli, and decide whether the
direction of motion was in CW or CCW direction by a keypress. In the first experiment, some of the participants were displayed regular random dot motion rotating CW or CCW with 100% coherence, with CW rotation being synchro-nized with low frequency static tone, whereas CCW rotation was accompanied by high frequency static tone (reverse of it for the rest of the participants) in association test phase. The procedure was the same in the second experiment except that reverse-phi was random dot motion and used as a visual stimulus.
The behavioral results indicated that static tones did not affect the psycho-metric curves of the participants in pre-association test phase in both of the experiments. However, the perceived direction of motion was influenced by the static tones in the post-association test phases in tune with the paired audiovi-sual stimuli in association test phases in the experiments. Moreover, the impact of audiovisual associations on motion perception was more pronounced in second experiment, than that of the first experiment. Significantly, static tones altered perceived direction of motions in concordance with audiovisual associations in the second experiment in which reverse-phi random dot motion was used. The authors conclude that static tones influence perceived direction of regular and reverse-phi random dot motion that are hard to be tracked by the observer. Thus, these findings reflect the effect of audiovisual associations on low-level pre-attentive visual motion processing contrary to high-level visual processing as conventional view suggests.
Depending on the experimental findings above, we can argue that not only feedforward processing, but also feedback mechanisms can play a significant role in forming perception. Moreover, the neurons in visual cortical area are not fixed, and they can be tuned through feedback projections from high-level visual areas and become selective for different properties of the stimuli.
1.6
Content and the Specific Aims of the Study
The perception is composed of both the sensory inputs as feedforward information processing throughout the cortical hierarchy in the brain, and extra-retinal factors that are involved in an interaction with this sensory information [14]. In other words, perceptual experience has been considered as the combination of sensory information and prior external experiences about the environment through asso-ciative learning that have an impact on this sensory information. Although con-siderable amount of research focused solely on the neural mechanisms of sensory information behind perception, other studies indicate that associative learning between visual stimuli have an influence on visual perception [20], [3].
In light of these findings, one can hypothesize that perceived motion can be altered by audiovisual associations, and these effects are observed in low-level visual information processing. This is in contrast with the conventional view arguing that cognitive processes such as associations are related with high-level visual information processing.
Although behavioral evidence provides evidence to this current view, the mech-anism underlying this effect still remain unclear. Given this background, the fun-damental aim of this study is to uncover neural correlates behind the effect of audiovisual associations on visual motion perception with an emphasis on early-stages of sensory processing. Accordingly, the time-course of association-induced effects of motion processing were revealed through electroencephalogram (EEG). In the literature, there are distinctive approaches on how feedforward and feedback connections play a role in the effect of audiovisual associations on visual motion perception. This effect might be due to the feedforward information pro-cessing that originates from strengthening of interactions between auditory and visual information in low-level areas after the audiovisual association exposure [34]. Contrarily, a more recent study of Vetter et al. [35] illustrate that the effect of audiovisual associates is observed in low-level areas in the absence of the feedforward processing. In this vein, another purpose of this study is to analyze
the role of the feedback and feedforward information processing on audiovisual association induced visual perception of motion.
Figure 1.9: Sound-contingent visual motion aftereffect: Behavioral and exper-imental results of the experiment conducted by Hidaka et al. [9]. (A) Global motion display at different coherence levels that were accompanied by high or low frequency tone during pre- and post-exposure test phases. (B) Behavioral results showing the effect of sounds on visual motion perception for each condi-tion (rightward sound, leftward sound and no sound condicondi-tions were denoted by circle, square and triangle, respectivelty). (C) Subjective motion nulling posint for each condition for pre-exposure session, post-exposure and two days after the experiment. Adapted from Hidaka et al. [9].
Figure 1.10: Experimental procedure and visual (random motion and reverse-phi motion) and auditory stimuli (low-frequency and high frequency) in association phase in the study of Kafalıg¨on¨ul and Oluk [10]
Chapter 2
Behavioral Methods and Results
2.1
Methods
2.1.1
Participants and Apparatus
There were 12 observers (7 female and 5 male, age range: 23-32 years) in the experiment in total. All of the subjects that participated in the experiment reported that they had normal or corrected vision and normal hearing abilities, with no history of clinical visual disease. The experimental procedures were in accordance with international standards (Decleration of Helsinki, 1964) and approved by the local ethics committee of ˙Ihsan Do˘gramacı Bilkent University, and each subject signed informed consent form at the beginning of the experiment. MATLAB version 7.12 with the PSYCHTOOLBOX 3.0 was used for stimulus preparation, stimulus presentation and data acquisition. Visual stimuli were pre-sented on a 20-inch CRT display at a viewing distance of 57 cm. Pixel resolution and refresh rate were 1280 x 1024 and 100 Hz, respectively. For auditory stimuli, insert earphone (E-A-RTONE Gold 3A) was used and the sound amplitudes were adjusted by sound-level meter (SL-4010Lutron). Digital oscilloscope (Rigol DS 10204B) which was connected to both computer soundcard and a photodiode,
was used to confirm the synchronization of visual and auditory stimuli. A Spec-troCAL photometer was used for luminance calibration and gamma correction of the display. All the experimental sessions were conducted in a dimly lit, and sound-attenuated room.
2.1.2
Stimuli
A small red circle (0.2 degree in diameter) which was presented on a mid-gray background (43.0192 cd/m2) and at the center of the screen, served as a fixation
target. The visual stimuli composed of 350 numbers of light gray dots brightness value (119.5004 cd/m2) that move 100% leftward, 100% rightward or random in
each trial. These moving dots were presented on an invisible circular window with 7 degree in diameter and centered at 5 degree above the fixation target. As auditory stimuli, either a high or low frequency static tones of which sampling frequencies are 2000 Hz and 500 Hz, respectively, were used with about 78 dB (sound pressure level).
2.1.3
Procedure
The experiment consisted of three distinct sessions which are pre-association test phase, associative phase and post-associative test phase. Before the experiment, each participant were exposed to a training session in which they were familiar-ized with the experimental procedure so that experimenter can detect whether participants can see the directions of dot movements and hear the sounds, ef-fectively. During the training session, participants were presented 24 trials that were similar to the trials in the main experiment, but without sound or feedback. They were asked to report the direction of dots. At the end of the training ses-sion, only the participants who observed the direction of moving dots correctly participated in the main experiment.
During each phase in the behavioral experiment, we used random dot kine-matogram which is widely used in low-level visual motion perception studies. Since the stimulus was hard to be tracked by the observer, high-level visual pro-cessing was relatively weak. With regard to this, several findings revealed that areas such as V1 and MT were selectively responsive to low-level pre-attentive visual motion. In this context, these areas are considered as low-level visual mo-tion areas. On the other hand, areas such as inferior parietal lobule (IPL) and superior temporal sulcus (STS) were selectively responsive to more attentional motion processing so that they are considered as high-level visual motion areas in terms of visual motion hierarchy.
Pre-association test and post-association test phases were identical. In both tasks, there were three types of trials which were audio-visual, visual-only and auditory trials. For audio-visual trials, the jitter was used (randomly assigned in between 0 and 500 ms in each trial) before the fixation point was displayed for 500 ms. Following fixation point, static random dots were presented for 500 ms. Then, visual motion stimuli, that can be either a 100% coherent right motion, a 100% coherent left motion or random dot motion in each trial, was displayed for 500 ms. For audio-visual trials, the onset of each visual motion was synchronized to the onset of the auditory stimuli which were low-frequency (500 Hz) tone or high-frequency (2000 Hz) tone, randomly in each trial. During these trials, participants are asked to fixate on a red circle at the center of the screen (fixation point), and decide the direction of majority of dots by a key press. There were 312 trials in this session in total: Visual Conditions (3) x Auditory Conditions (2) x Repetitions (52). There were 2-3 minutes breaks in the middle of the pre-and post-associative learning tasks. Trials in which participants respond in more than a minute were added to the end of the session and were presented again, randomly.
The visual-only trials were identically same with the audio-visual trials ex-cept that there were no auditory stimuli and they consisted of 52 trials: Visual Conditions (2) x Repetitions (52). The auditory-only trials are similar with the audio-visual trials with exception that there is no visual stimulus and participants are asked to attend just auditory stimuli that can be low-frequency (500 Hz) tone
or to a high-frequency (2000 Hz) tone without any key press. The total number of trials in this session was 52: Auditory Conditions (2) x Repetitions (26).
During visual-only trials in pre- and post-association test phases, the trials in which 100% coherent leftward and rightward motion were displayed without sounds were designated as catch trials to examine responses that were indepen-dent from the effect of sounds. In both of the phases, there are 52 catch trials: visual conditions (leftward and rightward) x repetition (26).
In association phase, there were two pairing adaptation conditions. In the first adaptation condition, high frequency static tone (2000 Hz) was paired with a 100% coherent right motion display whereas low frequency static tone (500 Hz) was paired with a 100% coherent left motion display. Contrarily, high frequency static tone (2000 Hz) was paired with a 100% coherent left motion display whereas low frequency static tone (500 Hz) was paired with a 100% coherent right motion display in the second adaptation condition. This task consisted of 400 trials as a whole: Visual Conditions (2) x Auditory Condition (1) x Repetitions (200). During association phase, participants were asked to passively attend both sounds and motion display without any key press.
2.2
Behavioral Results
The trials in behavioral data of all subjects corresponding to segments that were removed during EEG analysis, were excluded from behavioral data before be-havioral analysis. We hypothesized that there would be a difference between responses in pre- and post-association phases in line with sounds accompanied by a particular motion direction in association phase. In line with our hypohesis, the behavioral results indicate that the percentage of right presses increased in post-association test when rightward sound (Tone A or Tone B depending on adaptation condition) was given, in comparison with the pre-association phase (Figure 2.1).
In addition to graphical analysis, the difference in the values in number of right press between leftward and rightward sounds were calculated for both pre- and post-association test phases. Two-tailed paired t -test was applied to examine whether a specific sound associated with a particular direction in associative learning phase had a significant impact on direction of perceived motion. The null hypothesis is that the mean percentage change in right presses of individuals between rightward sound and leftward sound was the same for pre- and post-association test phases. T -test results indicated that there was significant effect of sounds on perceived motion direction since the null hypothesis is rejected with a p-value of .009. Moreover, differences in means in right responses for pre- and post-association test phases was supported by Cohen’s d (1.34).
Figure 2.1: Experimental procedure illustrating trial sequences. (A) Pre- and post - association test phases. (B) Association phase.
Figure 2.2: Behavioral results. Group averaged data (n=12) for pre- and post-association test phases in terms of percentage differences in right press under the condition of rightward and leftward sound. Error bars represent the standard errors of mean (SEM).
Chapter 3
EEG Data Acquisition, Analysis
and Results
3.1
EEG Data Acquisition
A 64-channel MR-Compatible system (BrainAmpMR, Brain Products) was used to record the electroencephalogram (EEG) activity. The system includes 63 scalp electrodes and a electrocardiogram (ECG) electrode which was placed at the back of each participant to detect cardio-ballistic artefacts. The layout of the EEG cap was based on the international 10/20 system. The FCz and AFz electrodes were used as reference and ground electrodes, respectively. The application of EEG paste was made with the use of syringe and q-tips in order to decrease impedances in all EEG channels and impedances were kept below the 5 kΩ throughout the experiment in order to increase single-noise ratio. The sampling rate of EEG signals was 5000 Hz, and each stimulus marker and raw EEG data was stored via Vision Recorder Software.
3.2
EEG Preprocessing and Analysis
The EEG data was analyzed by BrainVision Analyzer 2.0 and our own custom Matlab scripts. For preprocessing, EEG data was filtered before down-sampling (225 Hz, 24dB/oct). Then, data was analyzed with a sampling rate of 500 Hz. Subsequently, Cardio-ballistic correction was applied to data by removing signals originated from ECG channel. Then, zero phase shift IIR high band-pass filter ranging from 0.5 to 70 Hz and a notch filter at 50 Hz were applied to the EEG data. After filtering, the recordings were segmented into epochs -200 ms (before the onset of motion-static random dot stimulation) to 800 ms (after the onset of motion). Afterwards, Independent Component Analysis (ICA) was applied to each epoch in order to eliminate possible EEG artifacts such as eye-blinks and muscular movements. Then, semi-automated artifact rejection was applied to data. After preprocessing, ERPs (event-related potentials) time-locked to motion onset were computed by taking the average of EEG signals for each particular electrode corresponding to each specific experimental condition. Later, zero phase shift IIR low band-pass filter ranging from 0.5 to 40 Hz and a notch at 50 Hz were applied to EEG data to obtain smoother ERPs. Finally, baselines were computed from -200 ms to 0 ms before the motion onset and they were subtracted from the ERPs of each condition.
Only the evoked activities in visual-only (random dot motion), auditory-only (by either low- or high-frequency tone), and audiovisual (random dot motion accompanied by either low- or high-frequency tone) trials were included in EEG analysis for pre- and post-association test phases. ERPs was compared between pre- and post-association phases by the use of pointwise running t-test. A specific time point was shaded only if at least 20 ms of contiguous data was significantly different. A significant difference in pre- and post-association test phases was defined when it was stable for at least 20 ms of contiguous data (i.e. 10 consecutive points at a sample rate of 500 Hz) and present on at least three neighbouring electrodes meeting 0.05 alpha criterion.
3.3
Results
The additive-factors method was widely used in order to examine multisensory interactions in ERP studies. If an experiment contains two population of unisen-sory neurons that fire simultaneously (audiovisual), ERP recording should give linear sum of responses in the presence of two unisensory stimuli (auditory and visual stimulus) since ERP data depends on electrical fields that sum linearly (AV=A+V). Therefore, if the change in ERPs to unisensory stimuli under modu-lation is different from the change in multisensory stimuli, this unbalance reveals the effect of multisensory interactions [36]. In this context, The event related potentials (ERPs) for audiovisual integration emanating from associations were isolated by excluding the ERPs to sum of auditory-only stimuli (A) and visual-only stimuli (V) from those to audiovisual stimuli (AV).In order to investigate the significant differences in audiovisual integration (AV-A-V) due to the associ-ation phase, pairwise (post associassoci-ation test phase vs pre-associassoci-ation test phase) running t-test was applied to bimodal auditory (A), bimodal visual (V), and the difference (AV-A-V) waveforms for each electrode. In each plot, time is displayed on the horizontal axis form 0 ms to 600 ms, and electrodes are presented on the vertical axis (Figure 3.1).
The t -test results indicated that there is a significant difference in frontal re-gions (FP, AF, F, FC) between post and pre association auditory-only evoked activity after about 100 ms (Figure 3.1A), whereas there was no significant dif-ference between post and pre association test phases for visual-only (V) evoked activity (Figure 3.1B). Moreover, difference in evoked activities to difference ERP (AV-A-V) between pre- and post-association test phases was significant at 450 and after 500 ms in parieto-occipital and occipital regions (CP, P, PO and O), and just after 100 ms in frontal and central parietal regions (FC, C, CP).
Depending on these findings, time window of interest for bimodal auditory evoked activity was selected as [90-150] ms, and two time windows of interest was chosen as [460-490] ms and [500-520] ms for audiovisual (AV-A-V) evoked activities. The topographic activity patterns were plotted by averaging activities
(a) (b)
(c)
Figure 3.1: T -test results on the averaged ERP amplitudes that demonstrate significant effect in unimodal auditory (a), unimodal visual (b) and audiovisual (c) waveforms before and after association learning phase for different p-values (.001, .01, and .05, from darker to lighter gray shades).
within these time windows for bimodal auditory (A) and audiovisual evoked (AV-A-V) activity (Figure 3.2). Afterwards, representative electrodes were chosen for ERPs to bimodal auditory (A) and audiovisual integration (AV-A-V) activity within corresponding time windows (Figure 3.3). Moreover, ERPs to audiovi-sual integration activity was plotted by subtracting the sum of unimodal evoked activities (A+V) from audiovisual evoked activity (AV-A-V) in Figure 3.5.
The average ERPs to unimodal auditory condition (Figure 3.3A) indicate a significant sharp decrease from P1 to N2 for both before and post association test phases within selected time window [90-150] ms. However, ERPs to auditory condition in post association phase elicited less positivity in P1 peak as com-pared to the P1 peak in pre association test phase. Furthermore, P1-N2 for post
association test phase ERP was more negative than that corresponding to pre association test phase.We also apply t-test by measuring ERP amplitudes on se-lected time windows for auditory only condition. The t -test results indicated that the difference between pre- and post-association phase is statistically significant for auditory only condition in selected time window (t (11)=-4.88, p=.000).
Averaged difference ERPs to audiovisual condition (Figure 3.3B and 3.3C) elicit that there is a significant difference between pre- and post-association test phases in two selected time windows [460-490] ms and [500-520] ms. The ERP to audiovisual condition decreases in between 450-500 ms in post-association phase, whereas it has increased in the same time window for pre-association test phase (Figure 3.3B).Thereafter, audiovisual waveform for post-association test phase showes an increasing deflection starting at about 500 ms after the visual motion onset. However, a decreasing deflection was detected starting at approximately 500 ms in audiovisual waveform for pre-association test phase (Figure 3.3C). We also apply t -test by measuring ERP amplitudes on the two selected time windows (the same with above) for audiovisual condition. The t-test results indicated that the difference between pre- and post-association phase is significant for time windows [460-490] and [500-520] ms, t (11)=3.06, p-value=.011 and t (11)=2.83, p-value=.016, respectively.
In order to investigate the effect of audiovisual integration due to the associa-tion phase on moassocia-tion percepassocia-tion, we isolate ERPs to audiovisual integraassocia-tion by subtracting the sum of unimodal auditory and visual ERPs (A+V) from audio-visual (AV) ERP at selected electrodes (O1,Oz,O2, PO3,POz,PO3 and Pz) for both post- and pre- association test phases in Figure 3.5. The ERPs to both conditions indicate that there were significant changes in selected time windows [460-490] ms and [500-520] ms. During [460-490] ms, ERP to post association test phase demonstrates a decreasing pattern, while the pattern is increasing for ERP to pre-association test phase. Moreover, negativity in ERP for post-association condition is eliminated after about 500 ms after the motion display, whereas ERP to pre-association condition decreases significantly after 500 ms.
(a) (b)
(c)
Figure 3.2: Scalp topographies (a) Topography of auditory-only condition in frontal electrodes at selected time window [90-150] ms. (b) Topography of au-diovisual condition in occipital electrodes at selected time window [460-490] ms. (c) Topography of audiovisual condition in occipital electrodes at selected time window at [500-520] ms.
(a)
(b)
(c)
Figure 3.3: Averaged ERPs to auditory-only condition at frontal areas (a) and to audiovisual integration (AV-A-V) at and parieto-occipital and occipital elec-trodes(b) -(c) at selected time windows.
(a)
(b)
Figure 3.4: Averaged ERPs to visual-only and audiovisual conditions.
Figure 3.5: Averaged ERP to audiovisual integration (AV-A-V) at parieto-occipital and parieto-occipital electrodes at selected time windows of interest.
Chapter 4
General Discussion
4.1
Behavioral Results Discussion
In their experiment, Kafaligonul and Oluk [10] illustrated that audiovisual associ-ations have an impact on low-level pre-attentive visual motion processing contrary to high-level visual processing. In accord with the aim of this study, we designed a behavioral experiment by using random dot kinematogram to eliminate in-volvement of high visual areas in an effort to investigate the neural mechanisms underlying the effect of association-induced audiovisual interaction on motion perception in low-level visual areas. In this context, we hypothesized that a spe-cific sound that is accompanied by a particular motion direction in the association phase will lead to differences in behavioral responses between before and after as-sociation phases in compatible with tone-motion direction pairing in asas-sociation phase.
The behavioral results indicate that the percentage of right responses have in-creased in post-association test when rightward sound (Tone A or Tone B depend-ing on adaptation condition) was given, as compared to pre-association phase as we hypothesized. In other words, motion direction in random trials was perceived as rightward when rightward sound (that was given in associative learning test
phase) were given in post association test phase.Moreover, paired t-test results demonstrate that the effect of associative learning on these response differences between after and before association phases were statistically significant at sig-nificance level 0.01 (p-value = .008).
Since we eliminated the involvement of high-level visual motion areas by using random-dot kinematogram, our behavioral results reveal that audiovisual asso-ciations have an impact on low-level visual motion areas in parallel with the findings of Kafaligonul and Oluk [10]. Besides their findings, the result of our study, indicating that early visual areas are not only responsive to processing visual stimuli, were supported by findings of several other studies. These studies indicated that low-visual areas were also responsive to other sensory modalities including auditory stimuli and somatosensory stimuli [37] and [38].
In terms of audiovisual interactions, the findings Falchier et al. [39] also il-lustrated that low-level visual areas can be modulated by auditory system. In their study, the authors indicated that V1 receive information from both auditory cortex, superior temporal polysensory region (STP) by using sensitive tracers in V1. In this context, evidence from Cappe and Barone [40] also suggested that multisensory integration does not have to occur in high-level cortical areas.
4.2
EEG Results Discussion
In the literature, there are different approaches that explain how low-level visual motion areas can be influenced by associative learning. One possible explanation of this effect is feedforward information processing that originates from strength-ening of interactions between auditory and visual information in low-level areas after the audiovisual association exposure [34]. On the other hand, a more recent study illustrated that the effect of audiovisual associates is observed in low-level areas in the absence of the feedforward processing. Vetter et al. [35] conducted fMRI experiments to investigate how visual and auditory inputs influence brain activity within low-level visual areas without feedforward visual stimulation. In
one of their experiments, subjects were exposed to natural sounds (bird singing, traffic noise and talking crowd) while they were blindfolded whereas they were instructed to image sounds of natural scenes (forest, traffic and people) when they were asked in the other experiment. The experimental results demonstrated that V1 and V2 became activated during the first experiment. Moreover, V1 and auditory cortex were active during the second experiment. When interpreting these results, the authors argued that contents of mental imagery can be decoded by early visual areas and auditory cortex although there is no visual and auditory stimulation (feedforward stimulation). Accordingly, they suggested that activa-tion in early visual areas can be explained by feedback projecactiva-tions from higher cortical areas regarding multisensory and imagery areas in order to prepare early visual areas for upcoming information.
The EEG findings indicate that there is a significant difference between ERPs to auditory-only condition for pre- and post-association phases after about 100 ms in frontal regions, whereas there was no significant difference between post-and pre-association phases for visual evoked potentials (VEPs). This can suggest that interaction effect emanating from audiovisual association did not modulate VEPs at early latencies although baseline was based on visual motion-onset (at 0 ms). This can illustrate that early visual motion areas were not modulated by sounds after the associative learning test phase. This finding can be interpreted as one of the indicators for feedback mechanisms that can underlies the effect of audiovisual associations on low-level visual motion areas.
On the other hand, significance in difference ERPs to auditory-only condition at early latency suggests that auditory tones gained new meaning and processed differently after associative learning task, and its effects occurred at early la-tency in frontal regions. This pattern was supported by the EEG experiment [41] including continuous recognition task in which initial and repeated presenta-tions were displayed to participants. In the first half of the initial trials, images were simultaneously presented with congruent sounds, with the rest of the tri-als composing of only images without sound. In repeated presentation session containing only images, half of the trials consisted of images that were presented in initial trials with a corresponding tone whereas images that were displayed
without a sound were illustrated for other half of the trials. Participants were asked to report whether or not images were presented previously. Behavioral results demonstrated that participants identified the images that were accompa-nied with a corresponding sound more accurately than the images which were presented without a sound. Moreover, EEG results illustrated visual ERPs dif-ferentiated about at 60-136 ms. In light of these findings, the authors articulated that unisensory visual images were able to rapidly trigger multisensory represen-tations which were associated them previously. In the sense of our study, this significance in difference ERPs to auditory-only condition can be attributed to new meaning of sounds due to motion direction-sound associations.
Moreover, statistically significant acceleration was observed in difference ERPs (post-association vs pre-association) waveforms from P1 to N2 for auditory-only condition within these frontal regions in our experimental findings. With regard to N2 component, several findings revealed that N2 component was related with deviance detection processing [42]. After associative learning test phase, am-plitude of N2 peak in frontal areas was more negative in comparison with that of pre-association test phase. This negativity can originate from the mismatch between motion direction and given sounds that were incongruent to paired as-sociations in associative learning test phase.
Although VEPs were not modulated by the sound that gained new meaning after the association test phase, difference ERPs (AV-A-V) between post- and pre association test phases were significant in occipital and parieto-occipital areas at late latencies after the motion-onset. Furthermore, negativity in ERPs to audiovisual integration (AV-A-V) for post association phase was eliminated at 500 ms after the visual motion onset in parieto-occipital and occipital areas. The other indicator of feedback mechanism can be these high latencies. In other words, triggering of high-level association or non-sensory areas and high-level visual motion areas stemming from the new meaning of auditory tones after association test phase can lead to strengthening feedback connections. Therefore changes arising from feedback mechanisms can be observed late in time after the post-stimulus onset.
![Figure 1.1: Paired-association task including twelve pairings of fourier descriptors in the experiment of Sakai and Miyashita [1]](https://thumb-eu.123doks.com/thumbv2/9libnet/5680118.114200/18.918.307.659.164.449/figure-paired-association-including-pairings-descriptors-experiment-miyashita.webp)
![Figure 1.3: The three sequential cue tasks that were used by Shulman et al. [3]. In directional cue task, static arrowheads were used as a cue of direction of motion before the random dot display](https://thumb-eu.123doks.com/thumbv2/9libnet/5680118.114200/20.918.243.691.416.630/figure-sequential-shulman-directional-static-arrowheads-direction-display.webp)
![Figure 1.4: Association task and behavioral design of the experiment from Schlack and Albright [4]](https://thumb-eu.123doks.com/thumbv2/9libnet/5680118.114200/21.918.280.679.176.665/figure-association-task-behavioral-design-experiment-schlack-albright.webp)
![Figure 1.5: Behavioral task that participants were asked to discriminate the size of visual stimuli while the stimuli were in sync with low-frequency tone or high frequency tone, adapted from Takeshima and Gyoba [5]](https://thumb-eu.123doks.com/thumbv2/9libnet/5680118.114200/23.918.242.722.190.332/figure-behavioral-participants-discriminate-stimuli-frequency-frequency-takeshima.webp)
![Figure 1.6: Sound induced flash illusion in Shams et al. [6]. The results of representation of one of the trials in which 2 flashes are accompanied with 3 beeps illustrated that number of flashes was percieved as three rather than two.](https://thumb-eu.123doks.com/thumbv2/9libnet/5680118.114200/24.918.204.778.174.455/figure-illusion-representation-flashes-accompanied-illustrated-flashes-percieved.webp)
![Figure 1.7: Visual motion detection task in Meyer and Wuerger [7]. The random dot kinematogram at different coherence levels (0%, 50% and 100%) were used as visual stimuli whereas white noise cross-fading between left and right ear of the speaker was used](https://thumb-eu.123doks.com/thumbv2/9libnet/5680118.114200/25.918.232.716.324.743/figure-visual-detection-wuerger-kinematogram-different-coherence-stimuli.webp)

![Figure 1.10: Experimental procedure and visual (random motion and reverse-phi motion) and auditory stimuli (low-frequency and high frequency) in association phase in the study of Kafalıg¨ on¨ ul and Oluk [10]](https://thumb-eu.123doks.com/thumbv2/9libnet/5680118.114200/34.918.206.756.345.848/experimental-procedure-auditory-stimuli-frequency-frequency-association-kafalıg.webp)
