4
The
Effect of
Financial Liberalization
on
the
Efficiency of
Turkish Commercial Banks
Osman Zaim
Introduction
The financial markets of developing countries are undergoing a period of
rapid transition, and Turkey is no exception. Structural changes in the Turkish
economy, technological breakthroughs, the competitive structure of the finan-
cial services industry, and changing borrower demands have all had a signif-
icant impact on the delivery of credit to industry, agriculture, and households.
A fundamental concern among borrowers and depositors is the impact of such
changes on the cost and availability of credit and banking services. The abil-
ity of commercial banks to continue to deliver credit efficiently in the future
will play a major role in determining the efficiency of Turkey's industrial and agricultural production.
The topic of efficiencies in commercial banking can be subdivided into issues
regarding the scale of production (economies of scale), the cost complemen-
tarities of joint production (economies of scope), and deviations from an effi-
cient frontier (X-efficiency). Greater degrees of efficiency among banks
could result in greater accessibility of loanable funds, higher bank profitabil-
ity, more preferable rates for borrowers and depositors, increased services for
customers, and greater profitability for long-term viability by using savings-
generated efficiencies as a capital cushion.
Since policies regarding the regulation and/or deregulation of commercial
banks and their competitors could be guided by inferences based on empiri-
cal results of' studies of bank efficiency, it is crucial to apply to the banking
sector the methodologies developed for measuring efficiencies.
In this brief introduction, the setting for efficiency measurement of commer- cial banks is established, and potential benefits of efficiency analysis are
reviewed. The objective of' this work is to investigate the effect of financial
liberalization policies on the economic efficiency of Turkish commercial
64 Zaini
Before the introduction of the 1980 stabilization program, the banking sector
in Turkey was characterized both by restricted entry of domestic and foreign
banks and by regulated interest rates. The lack of interest rate competition in
the sector forced banks to compete for deposits by establishing a network of
branches across the country. This led to overbranching and overstaffing in
commercial banking. The main goal of the financial policies embodied in the
1980 stabilization program was to create a competitive environment and
thereby enhance the efficiency of the sector. The first steps taken in this direc-
tion were to pursue liberal policies such as allowing new entries (both domes-
tic and foreign) into the sector and liberalizing interest rates, commissions and
fees. The sector was quick to respond to the program. The liberalization of
interest rates and increased competition in the market forced banks to
decrease their costs. As a result, unprofitable branches were closed and the
number of staff was reduced in many banks.
To investigate the effect of financial liberalization policies on the economic
efficiency of Turkish commercial banks at the micro level, a nonparametric
frontier methodology is applied to commercial banks for representative years
in both pre— and post—liberalization eras. The method of analysis relies on
estimates of multi—output production and cost frontiers using linear program-
ming techniques.
Estimating production frontiers by imposing different scale assumptions on
the technology and by measuring each unit's distance from the frontier will
not only yield information on the technical inefficiency of the unit under
investigation, but will also determine at which scale it operates. In other
words, the methodology allows the exploration of whether a particular bank
is experiencing decreasing, increasing, or constant returns to scale. Thus, a
comparison of the scale economies of each bank in the pre- and post-liberal-
ization eras will shed light on whether the liberalization policies succeeded in
lorcing banks to operate at the optimum scale. Similarly, from the compari-
son of bank level cost efficiency measures, one can obtain information on
whether the liberalization policies succeeded in forcing banks to allocate
resources more optimally. This paper will review the structure of the Turkish
banking sector, followed by a model that will be used for efficiency compar-
isons. Subsequently, the paper will present data sources as well as a discus-
The of Financial Liberalization
65
Structure
of the banking system
The Turkish financial system includes the Central Bank, commercial banks,
as well as investment and development banks. Commercial banks are the
dominant institutions of the system. Investment banks were established with
the purpose of underwriting securities; however, they are also engaged in
commercial banking without depending on deposits as a source of funds.
Development banks, on the other hand, are primarily engaged in extending
medium and long-term loans to selected industries. Their funding comes
either from the government or from international organizations like the World
Bank. The total share of investment and development banks in the system is
limited; in fact, in 1990 only nine percent of the consolidated total assets of
all banks belonged to these institutions. Thus, given the rather different struc-
ture of development and investment banks as well as their limited scope in the
financial system as a whole, the focus of this work will be on commercial
banks so as to maintain the comparability and uniformity between the units
under investigation.
As in most other countries, banking is a heavily regulated industry in Turkey.
Restrictions on entry and exit, capital adequacy, reserve and liquidity require-
ments, asset portfolio restrictions, number of branches, deposit insurance, and
interest rates on deposits and loans are all regulated by the government. The
financial reforms in Turkey starting in 1980 were designed to reduce state
intervention and increase the role of market forces in the operation of the
financial system. The refornis included both the abolition of interest rate ceil-
ings and reductions in reserve and liquidity requirements as well as in finan- cial taxes. In addition, together with recently-established Turkish banks, for-
eign banks were permitted to operate in Turkey, and restrictions on foreign
exchange operations were significantly relaxed during that period.'
The role of government in the banking system is not limited to its regulatory
authority. As of the end of 1990, the state is the owner-manager of eight corn-
mercial banks troni a total of 56 banks in the country. In terms of size, banks
owned by the state control 49.7 percent of total assets in the commercial bank-
ing system.
For a 111010 coinpiehetisivc reVieW of policies during (he financial liberalization era, see
66 O.vman Zaiin
With regard to ownership, private banks in Turkey can be grouped as domes-
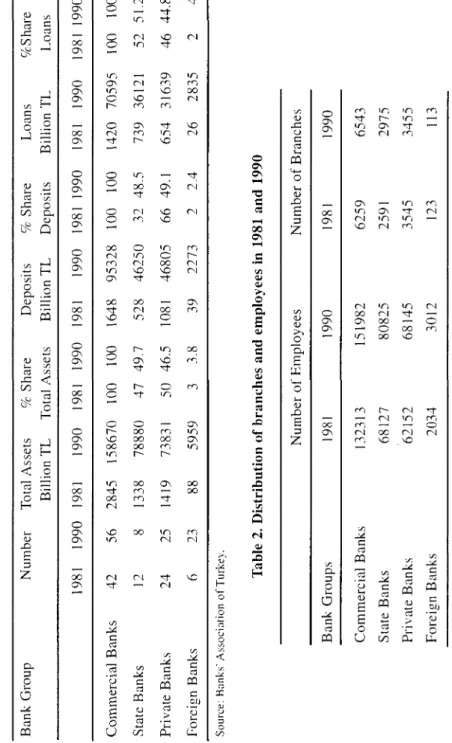
tic and foreign banks. Table I presents the distribution of total assets, deposits
and loans among commercial banks owned by the state, Turkish residents, and
foreigners for years 1981 and 1990.
Close inspection of Table I indicates that the sector was quick to respond to
the measures which foster competition. During the 198 1—1990 period the
number of commercial banks in the sector increased from 42 in 198 I to 56 in
1990. Out of 42 banks in 1981, 13 banks were either liquidated or merged with others, implying that 27 new banks entered the sector between 198 1 and
I 99t). Of these new entrants, 1 8 were foreign-owned, either as branches or as
subsidiaries.
Together with the new entries in the market, the liberalization of interest rates
breed
banks to decrease their costs by closing unprofitable branches andeducing the number of staff. Although the number of banks in the 198 1-1990
period increased significantly, the number of branches rose by only 4.5 per-
cent (from 6,259 to 6,543), whereas it had risen by 70 percent in the 1972- 1981 period. As for the number of staff, the rate of increase was 14.9 percent
between 1981 and 1900 (from 132,313 to 151,982), which was much lower
than the rate of 64 percent during the 1972-1981 period. Together with these
developments, the profitability of the banking system gained enormous
momentum during the financial liberalization era. As exhibited in Table 3,
real profits for private commercial banks have increased as much as five times
over the 1981— period, surpassing the real profitability index of manu—
firms by as much as 2.25 times as of 1989. Moreover, neither a
modest real increase in deposits (34 percent) and loans (58 percent) nor the
developments in the nominal and effective spreads can explain the sharp prof-
it increase entirely. Hence, taking the cost-saving measures described above
into consideration, one must rely on increased efficiency in the banking see- tor as a whole when trying to explain the success of the sector.
Table 1.
Structure
of the Turkish commercial bankingindustry
Bank Group Number Total Assets Billion TL % Share Total Assets Deposits Billion TL % Share Deposits Loans Billion TL c/cShare Loans 1981 1990 1981 1990 1981 1990 1981 1990 1981 1990 1981 1990 1981 1990 Commercial Banks 42 56 2845 158670 100 100 1648 95328 100 100 1420 70595 100 100 State Banks 12 8 1338 78880 47 49.7 528 46250 32 48.5 739 36121 52 51.2 Private Banks 24 25 1419 73831 50 46.5 1081 46805 66 49.1 654 31639 46 44.8 Foreign Banks 6 23 88 5959 3 3.8 39 2273 2 2.4 26 2835 2 4 Table 2. Distribution ofbranches
and
employees in 1981and
1990 Number of Employees Number of Branches Bank Groups 1981 1990 1981 1990 Commercial Banks 132313 151982 6259 6543 State Banks 68127 80825 2591 2975 Private Banks 62152 68145 3545 3455 Foreign Banks 2034 3012 123 113 Source: Banks' Association of Turkey. Source: Banks' Association of Turkey. C-.Table 3. Indicators of
profitability
1981 1982 1983 1984 1985 1986 1987 1988 1989 1990 1 Index of real profits of banking sector (a) 100.00 82.70 147.89 259.55 247.00 421.30 586.20 626.98 429.40 536.81 2. Index of real profits of manufacturing industry (b) 100.00 99.27 113.66 158.90 222.77 181.78 237.37 209.63 191.82 3. Index of real deposits (a) 100.00 128.12 127.67 138.85 153.92 165.06 169.20 148.08 145.15 134.64 4. Index of real lending (a) 100.00 112.02 114.50 100.49 122.64 164.40 188.88 152.94 146.70 158.89 5. Nominal spread 16.80 12.20 13.00 16.50 15.50 20.50 23.10 28.10 6. Effective spread 47.10 33.00 26.80 34.80 33.90 33.30 49.60 39.20 Notes: a: Deflated by Consumer Price Index b: Total profits of 500 largest firms deflated by Producer Price Index 1,3,4: Various publications of Banks Association of Tui'key: 2: Petrol Is Almanac (1990): 5,6: Capoglu Gokhan (1990). Sources: Rows:The Effects of Financial Liberalization
69
The section below summarizes the methodology used to investigate the effects
of liberalization policies on the economic efficiency of commercial banks.
Model
To investigate the effects of liberalization policies on the economic efficiency
of Turkish banks at the micro level, a nonparametric frontier methodology is
applied to commercial banks for both pre— and post—liberalization eras. This
method of analysis has been used in most previous bank efficiency studies.
For example, Sherman and Gold (1985), Parkan (1987), and Vassiloglu and
Giokas (1990) have analyzed efficiency differences between bank branches,
whereas Charnes et al. (1990), Ferrier and Lovell (1990) and Berg, Forsund
and Jansen (1991) have focused on efficiency differences between banking
firms.
The method used has been introduced by Farrell (1957). In his influential
work Farrell (1957) showed how one can measure productive inefficiency and
its components (allocative and technical inefficiencies) within a theoretically
meaningful framework. His initial approach has been adopted and extended
by Farrell and Fieldhouse (1962), Seitz (1970), Afriat (1972), and Meller
(1976). In more recent studies, Fare, Grabowski and Grosskopf(1985), Fare,
Grosskopf and Lovell (1982), and Banker, Charnes, and Cooper (1984)
showed how one can decompose Farrell's measure of technical inefficiency
and thus extract information on the scale of the unit under investigation.
The approach utilizes a sequence of linear programs to construct a transfor-
mation frontier so as to compute efficiency measures relative to said frontier.
In order to describe the theoretical underpinnings of the model employed,
suppose we observe a sample of K production units, each of which uses inputs
x e R+ available at prices w E to produce outputs y E R+ in an envi-
ronment characterized by variables and
a
E R+. As a matter of nota-tion, let xjkbe the quantity of input i used by unit k, and let the quantity
of output i produced by unit k. These data can be placed into data matrixes
a K x M matrix of output levels whose k,i th element is and N a
K x N matrix of input levels whose k,i th element is
Environmental variables and
a
are exogenously-fixed inputs and outputsthat a decision-making unit cannot control, at least in the short run. The deci-
70 Osinan Zaiin
given outputs. For the exogenously-fixed outputs, the decision-making units
would like to expand the elements of
a
as much as possible, given inputs.Again, for notational convenience, let the data on these be placed into data
matrixes P, a K x S matrix otexogenously-fixed inputs (or categorical vari-
ables) whose k,i th element and R , a K x T matrix of exogenously-fixed
outputs whose k,i th element is a1.
k M
Using the notation at hand for any y E R+ , production possibilities can be
characterized in terms of input requirement set L(i), which can be construct—
ccl from observed input-output data by means of
A A K T A A T T A
k=I,2...,k
where z is a k x I intensity vector. Intuitively, this equation constructs a ref-
erence technology from observed inputs and outputs. Relative to this bound-
ing technology, the technical efficiency of each observation is calculated by
solving K linear programming problems of the form:
F(xh A mm Subject to M N A R I A z z' = 1
The solution vector 2L in the above problem measures the fraction by which a
firm can multiply its input vector and still produce no less of any output. If it
is not possible to produce the existing outputs with a radially smaller input
vector, then )L takes the value of I, expressing that the unit under investigation
is technically efficient. The choice of this input-saving efficiency measure is
in coherence with the expressed interest of the banking sector in reducing
costs. In the above formulation, technical efficiency is calculated relative to
a production frontier that satisfies strong disposability of both inputs and out-
puts as well as variable returns to scale (VRS). However, by altering the con-
straint on the intensity vector z, one can also construct production frontiers
The Effects of Financial Liberalization 71
(CRS) (by deleting the last constraint) and non-increasing returns to scale
(NIRS) (by changing the last constraint as z7
I).
By comparing the efficiency scores obtained from production frontiers with
different scale assumptions, one can also find out at which scale the unit oper-
ates. Since the VRS production frontier envelopes the data more closely than
the production frontier, the comparison efficiency scores from these
two frontiers will reveal information on whether a particular unit is operating
under IRS or NIRS. While equality between the two scores indicates NIRS
technology, inequality means that the unit operates under IRS. Furthermore,
since a production frontier with the CRS assumption envelopes the data least
closely of all, the resulting efficiency scores will be less than or equal to those
calculated with NIRS technology. Thus, for any observation operating under
NIRS, equality between the efficiency scores from CRS and NIRS technolo-
gies implies CRS, whereas inequality implies DRS.
If input price vectors are known, the cost efficiency of each unit may be cal-
culated by solving K additional linear programs of the form:
, ) = mum Subject to M
ziNxh
(3) R T<A
zi = 1The solution vector the cost minimizer for the input price vector WA and
the output vector The measures of cost efficiency C(xk; yk; vvA) and alloca-
tive efficiency A(x , yL;
WA) are given by
k A A A C
(x,,W)=
f
A Q(y ; vv ) w wxwx
(4) A A A A A A C(x ; y , w )A(x,y,w)=
A AF(x,
y)
72 Zairn
which cost is increased due to production inefficiency and its components
(technical and allocative inefficiencies). For example,
C'
- I measures theby which cost is increased due to both types of inefficiencies,
while - I measures the by which cost is increased due to alloca-
tive inefficiency alone. Finally, C - A shows the percentage by which cost
is increased due to technical inefficiency.
Data and empirical results
The literature which models bank production and behavior is divided into two
distinct categories with respect to the measurement of banks inputs and out-
puts. HLlmprey made a useful distinction between the production
approach and the intermediation approach to bank behavior. Under the pro-
duction approach banks are considered as producing deposits and loans using
capital, labor, and materials. The proponents of this approach use the num-
ber of accounts and loans outstanding as banks' outputs. Their measure of
total costs include all operating costs incurred in the production of outputs.
The intermediation approach, by contrast, treats banks as collector of funds
which are then intermediated to loans and other assets. The dollar volume of
deposits and loans is the appropriate measure of bank output in this case, and
the combination of operating and interest costs provides the appropriate mea-
sure of total costs. In spite of this behavioral distinction, the work by Berg,
Forsund and .Iansen (1991) implies that the production frontier is invariant as
to how the output is measured. In their own words:
"We
found that important characteristics of the efficiency frontier forNorwegian banking are about the same whether we choose to measure
output by the number of accounts and their average size or by the total
balances of the accounts. This applies to the size of efficiency gains as
well as to our results on economies of scale."
In this study the intermediation approach to banking behavior is adopted. The
data are compiled from the publications of the Banks Association of Turkey,
which publishes yearly income statements and balance sheets for each bank.
The representative years for pre- and post-liberalization eras are chosen as
and 1990, respectively. The year 1981 was chosen instead of 1980 in
order to establish conformity with the data used for the post-liberalization era.2
The sample for the 1990 data set consists of all 56 commercial banks that
2
The Effects of Financial Liberalization 73
operated at that time. The sample for the pre-liberalization era, which origi-
nally consisted of 42 commercial banks, excludes three state banks whose income statements reflect some of their non-banking activities as well. The
variables used for the models described above are the following:
Outputs:
= dollar volume of demand deposits
= dollar volume of time deposits
= dollar volume of short-term loans
= dollar volume of long-term loans
Inputs:
= total number of employees
= total interest expenditures
= depreciation expenditures
A4 = expenditures on materials
Input price:
= total expenditures on salaries and fringe benefits
Total costs:
C = w1x1 + x2 + + x4
Environmental variables:
= average size of demand deposit accounts
a2 = average size of time deposit accounts
= number of branches
74 Osnian Zaini
Production frontier results
For each bank in the sample of 56 fi.r the year 1990 and 39 for the year 1981,
linear programming problem 2 is solved for all scale assumptions. Table 4 and
Table 5 below give summary statistics of the efficiency scores and returns to
scale for pre- and post-liberalization eras.
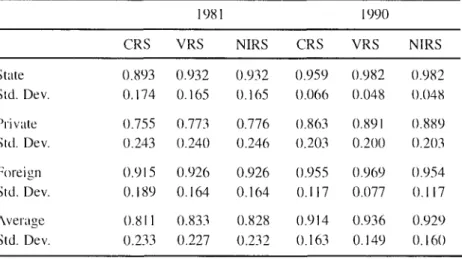
Table 4. Average technical efficiency scores under
different scale assumptions
1981 1990 CRS VRS NIRS CRS VRS NIRS State Std. Dcv. 0.893 0.174 0.932 0.165 0.932 0.165 0.959 0.066 0.982 0.048 0.982 0.048 Private Std. Dev. 0.755 0.243 0.773 0.240 0.776 0.246 0.863 0.203 0.891 0.200 0.889 0.203 Foreign Std. Dev. 0.915 0.189 0.926 0.164 0.926 0.164 0.955 0.117 0.969 0.077 0.954 0.117 Average Std. Dcv. 0.811 0.233 0.833 0.227 0.828 0.232 0.914 0.163 0.936 0.149 0.929 0.160
These tables point to some striking facts on how liberalization policies have
fostered competition. First, the level of technical efficiency has increased by
10 percent on average from 1981 to 1990. Note that all entries for technical
efficiency scores in 1981 are smaller than those in 1990. Secondly, technical
efficiency differences between banks have decreased over time. This evidence
is due to the fact that standard deviations of technical efficiency scores for each group in 1981 are greater than those in 1990. Thirdly, banks have undergone
considerable scale adjustment and were successful in achieving optimal scale.
An exanlination of Table 5 shows that the proportion of banks operating at the
optimal scale has increased from 59 per cent in 1981 to 68 per cent in 1990.
Another important fact is that the rate of change of technical efficiency has
been greater in private banks compared to state and foreign banks. This find- ing, while closing the efficiency gap between banks, is also an indication of
The Efft'cts of Financial Liberalization 75
Table 5. Developments in
returns
to scaleI 981 1990
Number of banks with CRS 23 59% 38 68%
Number of banks with DRS 6 15% 13 23%
Number of banks with IRS 10 26% 5 9%
Total 39 100% 56 00%
Cost
frontier
results
In the cost version to he used presently, the method inefficiency measure-
ment takes on a rather simple and intuitively appealing form. In a word, a
bank is said to be cost inefficient if it is dominated by one or more banks in
the Following sense:
(a) Other banks have lower expenses than its own expenses; and
(b) All output indicators of other banks are either greater than or equal to its
own indicators.
To determine cost inefficiency and its components, the procedure described
n Problem 3 is repeated for each bank in the samples representing pre- and
post-liberalization eras. Table 6 gives the summary results for the indexes
that show the average amount by which cost is increased clue to production
inefficiency and its components (allocative and technical inefficiencies) for
each owner class.
Evidence on cost efficiency indicates that, on average, costs were 75 percent
above the minimum in 1981 and that this figure drops to 38 percent (almost a
50 percent reduction) in 1990. The results indicate that the effect of allocative
and technical inefficiencies on cost increases differs for pre- and post-liberal-
ization eras. While in 1981 banks were more vulnerable to technical ineffi-
ciency, the effect of allocative ineFficiency was more dominant in 1990. Also,
close Inspection of Table 6 shows that in both eras private and state banks dif- icr with respect to the relative effects of allocative and technical inefficiencies
on cost increases. While in state banks a large portion of cost inefficiency is
due to allocative inefficiency, the same is not true fbr private banks, where the
76 Osnian Zaim
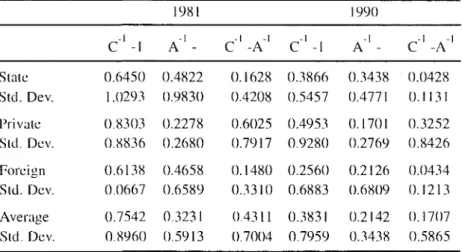
Table 6. The effect of technical and allocative inefficiencies
on cost increases
1981 1990
Cl-I
A'-
C'-A' C'-!
A'-
C'-A'
State Ski. Dev. 0.6450 1.0293 0.4822 0.9830 0.1628 0.4208 0.3866 0.5457 0.3438 0.4771 0.0428 0.1 13 I Private Std. Dcv. 0.8303 0.8836 0.2278 0.2680 0.6025 0.7917 0.4953 0.9280 0.1701 0.2769 0.3252 0.8426 Foreign Std. Dcv. 0.6138 0.0667 0.4658 0.6589 0.1480 0.3310 0.2560 0.6883 0.2126 0.6809 0.0434 0.1213 Average Std. Dcv. 0.7542 0.8960 0.3231 0.5913 0.4311 0.7004 0.3831 0.7959 0.2142 0.3438 0. 1707 0.5865
A comparison of rates of improvement for different ownership classes
through the years indicates that a relatively higher rate of improvement of cost
inefficiency in private banks closed the efficiency gap between the latter and
state banks. Table 7 was designed to complement the analysis of the effect of
liberalization policies on economic efficiency. It classifies banks into three
categories, namely: banks which are economically efficient; those which are
only technically efficient; and those which are economically inefficient; in
addition, it shows their respective weights in the financial system for both
eras.
A comparison of pre- and post-liberalization eras in Table 7 offers enough evi-
dence that liberalization policies have encouraged more efficient use of
resources in the Turkish banking industry. As a result, the proportion of fully-
efficient banks has increased from 38 percent in 198! toSS percent in 1990.
A high relative share of deposits and loans accruing to efficient banks in both
Table
7.Developments
in
economic
efficiency
1981 1990 Bank Number % % % % Number % % % Classes of Banks Share of demand deposits Share of time deposits Share of Share of short-term long-term loans loans of Banks Share of demand deposits Share of time deposits Share of Share of short-term long-term loans loans Technically and 15 81 80 81 81 31 79 81 75 86 allocatively efficient (38%) (55%) banks Only technically 8 6 5 3 13 10 15 14 16 12 efficient banks (21%) (18%) Technically and 16 13 15 16 6 15 6 5 9 2 allocati vely inefficient (41%) (27%) banks Total 39 (100%) 100 100 100 100 56 (100%) 100 100 100 100 Source: Author's computations.78 Osman Zaiin
Conclusion
Turkeys financial reform seems to have succeeded in stimulating commercial
banks to take measures aimed at enhancing both technical and allocative effi-
ciency. As a result, the number of efficient banks has increased over time.
The following are the main findings of this study:
i) A comparison of efficiency scores indicates that state banks are more effi-
cient than their private counterparts. This contradicts the thesis which asserts
that public ownership is inherently less efficient, at least as far as the Turkish
banking industry is concerned.
ii) Banks have undergone considerable scale adjustment and have thus sue-
ceeded in achieving optimal scale.
iii) The effect of allocative and technical inefficiencies Ofl cost increases is
different for private and state banks. While state banks are more vulnerable
to allocative inefficiency, the effect of technical inefficiency on cost increas-
The Effects of Fincincial Liberalization 79
Bibliography
• Alliat, S .N. 1972. "Efficiency Estimation of Production Functions. International Lcononsu Review. 13: 568-98.
• Akkurt A.. D. Hakioglu. et. al. 1981. Developments in the Tuikish Banking Sector 1980-
990." Working Paper, Centi'al Bank of the Republic of Turkey, Ankara.
• Banker, RI)., A. Chaines, and W.W. Cooper. 1984. "Models for Estimation of Technical and
Scale Inefliciencics in Data Envelopment Analysis." Management Science, 30: 078-92.
• Berg, Si., F.R Forsund, and E.S. Jansen. 1991. "Technical Efliciency of Norwegian Banks: The Nonparametric Approach to Efficiency Measurement." The Journol of Productivity Analysis, 2:
l27-42.
• Charnes A.. W.W. Cooper, et. al. 1990. "Polyhedral Cone-Ratio DEA Models with an
Illustrative Application to Large Commercial Banks.'' Journal ot Econometrics, 46: 73—9 I
• Capoglu, G. 1990. "The Effect of Financial Liberalization on the Efficiency of the Turkish
Financial System in the l980c Paper presented at the Fifth Annual Conference of the European Economic Association, Lisbon.
• Fare R.. R. Grabowski, and S. Grosskopf. 1985. "Technical Efficiency of Philippine
Agriculture.'' Applied Economics, 17: 205— 14.
• Farc, R., S. Grosskopf, and C.A,K. Lovell. 1982. The Measuremnero of Efficiency of Production. Boston: Kluwer-Nijhoff Publishing.
• Farrell, Mi. 1957. "The Measurement of Productive Efficiency." Journal of the Royal
Statistical Societr, Al 25: 258—81.
• Farrell, Mi., and M. Fieldhouse. I 962. "Estimating Efficient Production Function Under
Increasing Returns to Scale." Journal oft/me Royal Satistical Society. A 125: 252-67.
• Ferier, G.I). and C.A.K. Lovell. 1990. "Measuring Cost Efficiency in Banking: Econometric and Linear Programming Evidence." Journal of Econometrics, 46: 229—45.
• Humnprey, D.B. 1985. "Costs and Scale Economies in Bank Intermediation." In R.C. Aspinwall
and Eisenhems, eds., Handbook of Bankoig Strategy. New York, NY: Wiley.
• Meller. P. 1976. "Efficiency Frontiers for Industrial Establishments of Different Sizes
Explorations in Economic Research." Occasional Papers of the National Bureau of Economic
Research, 3: 379-407. Washington, D.C.
• Parkan, C. 1987. "Measuring the Efficiency of Service Operations: An Application to Bank Branches.'' Engineering Cost.s and Production Economics, 12: 237—42.
• Sherman, H.D., and F. Gold. 1985. "Branch Bank Operating Efficiency: Evaluation with Data Envelopment Analysis.'' .lournal of Banking and Finance, 9: 297—3 15.
• Seit,., W.D. 1970. "The Measuremcnt of Efficiency Relative to a Frontier Production Function." American Journal of Agricultural Economics, 52: 505—5 Il
• Vassmlogu M., and D. Grokas. 1990. "A Sttmdy of the Relative Efficiency of Bank Branches: An
Application of Data Envelopment Analysis." Journal of Operational Research Society, 41(7):
80
Comments
Pierre
Abou
Ezze
The main point argued in Osman Zaim's paper is that the 1980 liberalization
of Turkey's financial markets has increased the efficiency of Turkish com-
mercial banks.
In order to assess the effect of liberalization on efficiency, a linear program
technique was used to estimate production and cost functions for representa-
tive years. Since the results show an improvement in both functions, the
paper argues that financial liberalization seems to have succeeded in increas-
ing the efficiency of commercial banks. A few comments need to be made in
connection with these findings.
Initially, the methodology used is very appropriate for measuring efficiency at
a given point in time. However, the use of depreciation expenditure as a mea-
sure of the cost of physical capital is somewhat problematic. Indeed, depre-
ciation based on historical or book values actually distorts the true cost of cap-
ital in the case of banks that bought their buildings and equipment at different
points in time.
In addition, using this methodology to compare production and cost at two
different points in time simply indicates whether production units have
become more or less efficient and nothing else. Linking this change in effi—
ciency to factors such as market liberalization is a different matter. Osman
Zaim argues that the liberalization of interest rates and new entries into the
market forced banks to decrease their costs. However, the number of branch-
es increased by only five percent and employment by only 14.9 percent over
the 1981-90 period as compared with a 70 percent increase in branches and a
64 percent rise in employment during the 1972-81 period. The question that
arises here is whether the slow increase is the result of financial reforms or
simply the end of an overexpansion that took place in the 1970s and which led
to an overbanked industry.
Also, the data show that the number of employees per branch increased for the
entire banking sector as well as for private banks between 1981 and 1990. As
for the nuniber of branches per bank, while the ratio has decreased on aver-
c'ominents 81
whether this decrease has been the outcome of the closure of unprofitable
branches or simply the liquidation of some banks at a time when newly-
founded ones have not yet opened many branches. As for state banks, the
average number of branches increased from 215 to 371 during the 1980s.
Hence, it is not quite clear in Zairn's paper just how much of the increased
efficiency has been the outcome of financial reforms and how much of it has
resulted simply from the consolidation of the banking sector which would
have taken place anyway.
Moreover, it would have been helpful to discuss the relationship between the
changes in the returns to scale to an average cost curve and to indicate
whether there is compatibility between returns to scale and the size of Turkish
banks.
Lastly, it seems that private banks have fared better on the production side
than on the cost side. While the gap between private and state banks is being
narrowed in this regard, the state-to-private ratio of inefficiencies did not
change between 1981 and 1990, and this is an issue that the author failed to
address in his paper.
Marcel Cassard
Osman Zairns paper is quite thought-provoking, but some remarks seem in
order regarding the choice of model used to analyze the efficiency of Turkish
banks. Generally, input/output models tend to measure the efficiency of
banks in terms of the ratio of the volume of deposits and loans to a set of
inputs, without giving weight to the quality of the loans portfolio of banks, or
the concentration of loans to sectors or individuals. These models also fail to
address the cost efficiency of banks, which is the spread between lending and
borrowing rates; indeed, cost efficiency is an important determinant of the
competitiveness of the banking system. Omitting these variables from the
analysis does not provide a complete picture of the efficiency of the banking
sector in TLlrkey.
In light of the above remarks, it is hardly surprising that the author should
have reached the conclusion that state banks in Turkey are more efficient than
their private counterparts. Such a conclusion is not generally supported by the
82 Marcel Cas,carc/
deposits and loans is an important determinant of efficiency, the conclusion is
not surprising; indeed, it can be explained by the fact that state banks have an
implicit guarantee from the government which allows them to attract more
deposits as well as to make more loans, since they lend to the captive market
of state enterprises. Exporters borrow heavily from state banks in Turkey
hecause the government provides subsidies for loans targeted to exports,
which again explains the higher volume of loans.
However, a closer examination of the data in Tables I and 2 will yield a dif—
picture of the efficiency of state banks in Turkey. For instance, the
number of branches per state bank increased from 216 in 1981 to 372 in 1990,
while the number of branches per private bank has declined from 148 in 1981
to 138 in 1990. Similarly, the number of employees per state bank increased
Ironi 5,677 in 1981 to 10,103 in 1990, while the number of employees per pri-
vate hank barely increased &om 2,59() in 1981 to 2,726 in 1990. Nonetheless,
during this period the total assets held by private and state banks remained
very close. These measures hardly point to an increase in efficiency on the part of Turkish state banks.
Another conclusion of the paper is that Turkish banks have improved their
allocative and technical efficiency. Although this may he true, it remains to
be seen why intermediation costs are still so high in Turkey. When one exam- ines the spread between after-tax returns on deposits and effective lending
rates, which are a measure of intermediation costs, it is not clear whether or
not they have declined substantially during the period under consideration. in fact, the spreads are so high that large corporations bypass local banks and
borrow directly on international capital markets. Large effective spreads gen-
erally show low operational efficiency. In addition, they lead to an oversup—
ply of banking services as well as to low productivity in making such services
available on the market. It would have been interesting to see these differ-
ences in efficiency in the Turkish banking system effectively reconciled in