Chapter 9
ABSTRACT
The main purpose of this chapter is to evaluate the causality relationship between non-performing loans, industry volume, and economic growth and to provide some policy recommendations for global growth. Within this context, annual data of 16 African countries for the periods between 2001 and 2015 was taken into the consideration. Additionally, Dumitrescu Hurlin panel causality test was used to reach the objective. According to the result of this analysis, it was identified that there is a causality relationship between industry volume and economic growth.
Relationship Between
Non-Performing Loans, Industry,
and Economic Growth of
the African Economies and
Policy Recommendations
for Global Growth
Hasan Dinçer
Istanbul Medipol University, Turkey
Serhat Yuksel
Istanbul Medipol University, Turkey
Zafer Adalı
INTRODUCTION
Africa is the second biggest continent of the world with respect to population density. There are 54 different countries and more than 1 billion people in this continent which is correspond to 15% of the world population (Toenniessen et. al., 2008). On the other side, Africa combats many different problems at the same time for a long period. Starvation, unfavorable health conditions, migration and civil wars are accepted as the most important problems for Africa (Watts, 1991).
In addition to them, economic problems play a very significant role for this continent. Africa is one of the poorest regions in the world in spite of the fact that it has many natural resources (Kownacki, 2000). According to the World Bank report, most of the people in Africa have less than 2.5 USD incomes per day. This situation underlines the importance of economic problems in this continent. Owing to this condition, it can be said that studies, which focus on economic development in Africa, are essential in order to solve the problems in this continent.
Furthermore, Africa has also significant role in global trade. Especially after the effects of globalization, economic borders among the countries have been disappeared (Yüksel et. al., 2015). This condition gives a chance to all economies to reach new markets in the world. This issue can be accepted as a leading factor to develop global economy. In other words, when the economies of African countries are improved, this will make an important contribution to the global growth. This situation will increase the living standard of the people in the world.
Non-performing loans (NPL) of the banks, industry volume and economic growth are interrelated variables. When non-performing loans ratio of the banks in the country increases, this problem influences industry volume of this country negatively. The main reason behind this situation is that banks will be unwilling to give loans in this aspect (Elegbe, 2013), (Abadi et al., 2014), (Ahmad and Bashir, 2013). Furthermore, when banks reduce the amount of the loans due to the high NPL problem, it will decrease the investment and consumption amount that has a direct effect on economic growth (Balgova et. al., 2016), (Klein, 2013).
Moreover, decrease in industry volume mainly refers that companies have some financial problems. Because of this issue, these countries will face some difficulties In addition to this situation, it was also defined that a decrease in economic growth is the main cause of the non-performing loans ratio in African countries. This chapter makes an important contribution to the literature. While considering these results, it can be said that to increase global trade economies of the countries should be improved and banking sectors should work more effectively. As a result, it will be possible to increase the living standards of the people and provide global growth.
in order to pay their loans debt to the banks. This situation will have positive influence on non-performing loans ratio (Karahanoglu and Ercan, 2015), (Ersin and Duran, 2017). Also, these companies will try to decrease their costs to manage this financial problem. Within this context, they mostly prefer to lay off the employees and reduce their investments which lead to decrease in economic growth (Kaldor, 1966), (Drakopoulos and Theodossiou, 1991), (Diaz Bautista, 2003).
Additionally, economic growth has also influences on non-performing loans ratio and industry volume. If there is a decline in economic growth, this situation affects the financial aspects of the people in that country. Due to this issue, both people and countries have some difficulties to pay their debts to the banks that increases non-performing loans ratio (Khemraj and Pasha, 2009), (Louzis et. al., 2012). On the other side, when there is a recession in a country, it will have a negative effect on industry volume in that country (Balgova et. al., 2016).
Although the concepts of economic growth, industry production and nonperforming loans were analyzed in lots of studies separately, there is not a study in the literature which focuses on the relationship between these three different variables together. While considering these aspects, the main purpose of this study is to analyze the causality relationship between non-performing loans ratio, industry volume and economic growth in African countries. In order to reach this objective, annual data for the periods between 2001 and 2015 will be examined by using Dumitrescu Hurlin panel causality test. As a result of this analysis, it will be possible to make some recommendation in order to solve economic problems in Africa. Also, the results will show the ways to increase global growth. Therefore, it can be said that this study will make a significant contribution to the literature by helping to solve important problems.
This paper consists of four different parts. After the introduction, in the second part, similar studies in the literature will be detailed. In this part, the missing area in the literature related to this subject will be underlined. Moreover, in the third part, economic situation in Africa over the years is detailed. In the next part, research and methodology will be explained. Within this context, data and methodology used in the analysis will be detailed. After that, analysis results will be shared. Finally, in the last section, analysis results and the recommendations will be discussed.
BACKGROUND
Economic growth is an important indicator of the economies of the countries. Parallel to this aspect, industry production refers to the development in the industry of these countries. On the other side, nonperforming loans ratio is an important symptom
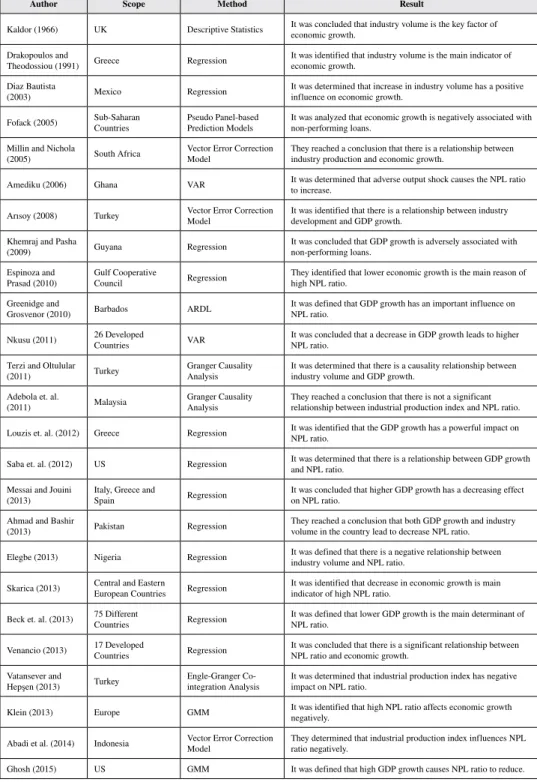
Table 1. Similar studies in the literature
Author Scope Method Result
Kaldor (1966) UK Descriptive Statistics It was concluded that industry volume is the key factor of economic growth. Drakopoulos and
Theodossiou (1991) Greece Regression It was identified that industry volume is the main indicator of economic growth. Diaz Bautista
(2003) Mexico Regression It was determined that increase in industry volume has a positive influence on economic growth. Fofack (2005) Sub-Saharan Countries Pseudo Panel-based Prediction Models It was analyzed that economic growth is negatively associated with non-performing loans. Millin and Nichola
(2005) South Africa Vector Error Correction Model They reached a conclusion that there is a relationship between industry production and economic growth. Amediku (2006) Ghana VAR It was determined that adverse output shock causes the NPL ratio to increase. Arısoy (2008) Turkey Vector Error Correction Model It was identified that there is a relationship between industry development and GDP growth. Khemraj and Pasha
(2009) Guyana Regression It was concluded that GDP growth is adversely associated with non-performing loans. Espinoza and
Prasad (2010) Gulf Cooperative Council Regression They identified that lower economic growth is the main reason of high NPL ratio. Greenidge and
Grosvenor (2010) Barbados ARDL It was defined that GDP growth has an important influence on NPL ratio. Nkusu (2011) 26 Developed Countries VAR It was concluded that a decrease in GDP growth leads to higher NPL ratio. Terzi and Oltulular
(2011) Turkey Granger Causality Analysis It was determined that there is a causality relationship between industry volume and GDP growth. Adebola et. al.
(2011) Malaysia Granger Causality Analysis They reached a conclusion that there is not a significant relationship between industrial production index and NPL ratio. Louzis et. al. (2012) Greece Regression It was identified that the GDP growth has a powerful impact on NPL ratio. Saba et. al. (2012) US Regression It was determined that there is a relationship between GDP growth and NPL ratio. Messai and Jouini
(2013) Italy, Greece and Spain Regression It was concluded that higher GDP growth has a decreasing effect on NPL ratio. Ahmad and Bashir
(2013) Pakistan Regression They reached a conclusion that both GDP growth and industry volume in the country lead to decrease NPL ratio. Elegbe (2013) Nigeria Regression It was defined that there is a negative relationship between industry volume and NPL ratio. Skarica (2013) Central and Eastern European Countries Regression It was identified that decrease in economic growth is main indicator of high NPL ratio. Beck et. al. (2013) 75 Different Countries Regression It was defined that lower GDP growth is the main determinant of NPL ratio. Venancio (2013) 17 Developed Countries Regression It was concluded that there is a significant relationship between NPL ratio and economic growth. Vatansever and
Hepşen (2013) Turkey Engle-Granger Co-integration Analysis It was determined that industrial production index has negative impact on NPL ratio. Klein (2013) Europe GMM It was identified that high NPL ratio affects economic growth negatively. Abadi et al. (2014) Indonesia Vector Error Correction Model They determined that industrial production index influences NPL ratio negatively. Ghosh (2015) US GMM It was defined that high GDP growth causes NPL ratio to reduce.
nonperforming loans are the subjects that attracted the attention of many different researchers. Because of this situation, there are lots of studies in the literature which focused on these concepts. Some of these studies were detailed on Table 1.
As it can be seen from Table 1, most of the studies focused on the relationship between nonperforming loans and GDP growth. Messai and Jouini (2013) made a study to analyze this relationship in Italy, Greece and Spain. They used regression analysis in order to reach this objective. As a result, it was identified that higher GDP growth has a decreasing effect on NPL ratio. Khemraj and Pasha (2009), Espinoza and Prasad (2010), Louzis et. al. (2012), Saba et. al. (2012), Skarica (2013), Beck et. al. (2013), Venancio (2013), Haniifah (2015) and Erdogdu (2016) also reached the similar conclusion by using the same method.
In addition to those studies, Balgova et. al. (2016) tried to evaluate the determinants of economic growth. Within this context, they analyzed 100 different countries in their study. According to the results of the probit analysis, it was defined that NPL ratio is the most important indicator of economic growth. Also, Klein (2013) and Ghosh (2015) used GMM analysis and emphasized the same conclusion. Furthermore, Amediku (2006) and Nkusu (2011) determined that decrease in GDP growth leads to higher NPL ratio by using GMM approach.
Moreover, it can also be understood that there are also some studies which evaluated the relationship between industry volume and economic growth. Kaldor (1966) concluded that industry volume is the key factor of economic growth in his study. Terzi and Oltulular (2011) also made a study to analyze this relationship in Turkey. As a result of Granger causality analysis, it was identified that there is a causality relationship between industry volume and GDP growth. Additionally, Drakopoulos and Theodossiou (1991) and Diaz Bautista (2003) defined that increase in industry volume has a positive influence on economic growth with the help of regression analysis. Also, Arısoy (2008) and Millin and Nichola (2005) reached the
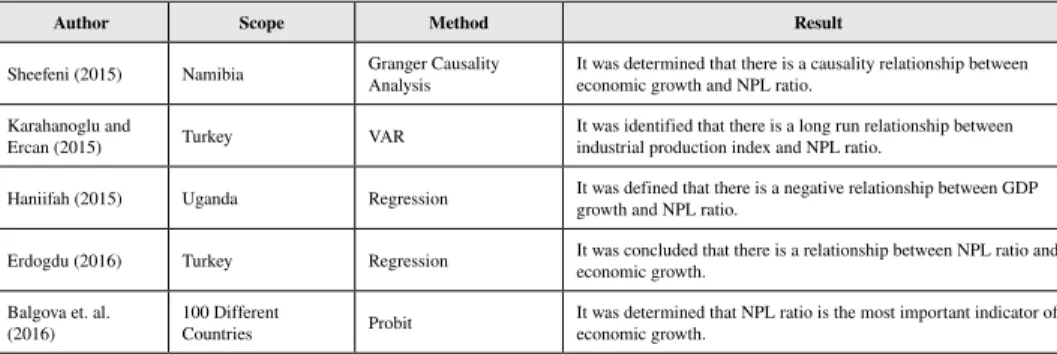
Author Scope Method Result
Sheefeni (2015) Namibia Granger Causality Analysis It was determined that there is a causality relationship between economic growth and NPL ratio. Karahanoglu and
Ercan (2015) Turkey VAR It was identified that there is a long run relationship between industrial production index and NPL ratio. Haniifah (2015) Uganda Regression It was defined that there is a negative relationship between GDP growth and NPL ratio. Erdogdu (2016) Turkey Regression It was concluded that there is a relationship between NPL ratio and economic growth. Balgova et. al.
(2016) 100 Different Countries Probit It was determined that NPL ratio is the most important indicator of economic growth.
Furthermore, some studies in the literature focused on the relationship between industry volume and nonperforming loans. Elegbe (2013) tried to determine this relationship in Nigeria. According to the results of the regression analysis, it was identified that there is a negative relationship between industry volume and NPL ratio. Ahmad and Bashir (2013) emphasized the similar conclusion for Pakistan with the help of similar method. Additionally, Vatansever and Hepşen (2013) and Karahanoglu and Ercan (2015) underlined the same aspect for Turkey. Moreover, Abadi et al. (2014) determined that industrial production index influences NPL ratio negatively. In spite of these studies, Adebola et. al. (2011) analyzed this issue for Malaysia and defined that there is not a significant relationship between industrial production index and NPL ratio.
While considering these studies, it was understood that there are lots of studies in which the relationship between nonperforming loans and economic growth was analyzed. Additionally, it was also seen that the relationship between industry volume and economic growth was also taken into the consideration in many different studies. Similarly, the effect of industry volume on nonperforming loans was also examined. However, it was understood that there is not a study in the literature that considers the causality relationship between these three variables together. In addition to this situation, it was also identified that Africa region was not examined very much in these studies.
MAIN FOCUS OF THE CHAPTER
Socio-Economic Outlook of Africa
Social Conditions of Africa
Regarding the population density, Africa is the second biggest continent in the world. More than 1 billion people live in this continent. This number forms 15% of total population in the world. On the other side, there are 54 different countries in Africa. These countries are listed on Table 2.
On the other side, Table 3 details the information related to the population of African countries in 2015.
Table 3 gives information about the population of African countries in 2015. As seen in this table, Nigeria has the highest population in Africa. In addition to Nigeria, Ethiopia, Egypt and Congo Democratic Republic are the other important countries with respect to the population. On the other hand, Djibouti, Equatorial Guinea, Comoros, Cape Verde, São Tomé & Príncipe and Seychelles are African
Table 2. African countries
Algeria Angola Benin Botswana Burkina Faso Burundi Cabo Verde Cameroon Central
African
Republic Chad Comoros Congo Cote d’Ivoire Djibouti Egypt
Equatorial Guinea Eritrea Ethiopia Gabon Gambia Ghana Guinea Guinea-Bissau Kenya Lesotho Liberia Libya Madagascar Malawi Mali Mauritania Mauritius Morocco Mozambique Namibia Niger Nigeria Rwanda Sao Tome and Principe Senegal Seychelles Sierra Leone Somalia South Africa South Sudan Sudan Swaziland Tanzania Togo Tunisia Uganda Zambia Zimbabwe
Table 3. Population of African countries
Country Name Population (Thousands) in 2015 Country Name Population (Thousands) in 2015 Country Name Population (Thousands) in 2015
Nigeria 182,201.96 Burkina Faso 18,105.57 Congo 4,620.33
Ethiopia 99,390.75 Mali 17,599.69 Liberia 4,503.44
Egypt 91,508.08 Malawi 17,215.23 Mauritania 4,067.56
Congo Dem.
Rep. 77,266.81 Zambia 16,211.77 Namibia 2,458.83
South Africa 54,490.41 Zimbabwe 15,602.75 Botswana 2,262.49
Tanzania 53,470.42 Senegal 15,129.27 Lesotho 2,135.02
Kenya 46,050.30 Chad 14,037.47 Gambia 1,990.92
Sudan 40,234.88 Guinea 12,608.59 Guinea-Bissau 1,844.33
Algeria 39,666.52 South Sudan 12,339.81 Gabon 1,725.29
Uganda 39,032.38 Rwanda 11,609.67 Swaziland 1,286.97
Morocco 34,377.51 Tunisia 11,253.55 Mauritius 1,273.21
Mozambique 27,977.86 Burundi 11,178.92 Djibouti 887.86
Ghana 27,409.89 Benin 10,879.83 Equatorial Guinea 845.06
Angola 25,021.97 Somalia 10,787.10 Comoros 788.47
Madagascar 24,235.39 Togo 7,304.58 Cape Verde 520.50
Cameroon 23,344.18 Sierra Leone 6,453.18 São Tomé & Príncipe 190.34
Côte d’Ivoire 22,701.56 Libya 6,278.44 Seychelles 96.47
Niger 19,899.12 Eritrea 5,227.79
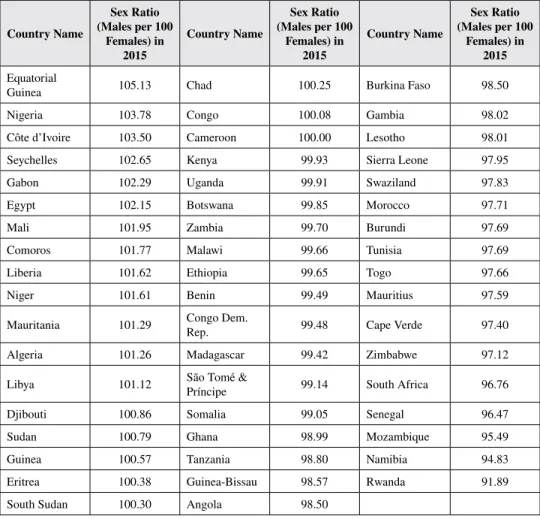
countries which have low population. Table 4 gives information about the ratio of males to the females of African countries in 2015.
Table 4 shows that in 21 African countries (out of 53), the numbers of males are higher than female people. Within this scope, Equatorial Guinea is the country where the ratio of males to the females is the highest. Nigeria, Côte d’Ivoire and Seychelles are the other significant countries for this situation. Furthermore, Rwanda is also an African country in which the ratio of females to the males is the highest. Mozambique and Namibia are also important African countries where much more males live in comparison with females. Additionally, Table 5 demonstrates the distribution of featured African countries by age.
Table 4. The ratio of males/females African countries in 2015
Country Name Sex Ratio (Males per 100 Females) in 2015 Country Name Sex Ratio (Males per 100 Females) in 2015 Country Name Sex Ratio (Males per 100 Females) in 2015 Equatorial
Guinea 105.13 Chad 100.25 Burkina Faso 98.50
Nigeria 103.78 Congo 100.08 Gambia 98.02
Côte d’Ivoire 103.50 Cameroon 100.00 Lesotho 98.01
Seychelles 102.65 Kenya 99.93 Sierra Leone 97.95
Gabon 102.29 Uganda 99.91 Swaziland 97.83
Egypt 102.15 Botswana 99.85 Morocco 97.71
Mali 101.95 Zambia 99.70 Burundi 97.69
Comoros 101.77 Malawi 99.66 Tunisia 97.69
Liberia 101.62 Ethiopia 99.65 Togo 97.66
Niger 101.61 Benin 99.49 Mauritius 97.59
Mauritania 101.29 Congo Dem. Rep. 99.48 Cape Verde 97.40
Algeria 101.26 Madagascar 99.42 Zimbabwe 97.12
Libya 101.12 São Tomé & Príncipe 99.14 South Africa 96.76
Djibouti 100.86 Somalia 99.05 Senegal 96.47
Sudan 100.79 Ghana 98.99 Mozambique 95.49
Guinea 100.57 Tanzania 98.80 Namibia 94.83
Eritrea 100.38 Guinea-Bissau 98.57 Rwanda 91.89
South Sudan 100.30 Angola 98.50
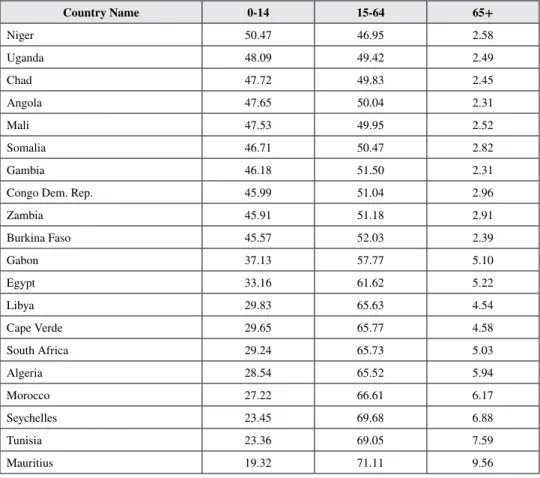
Table 5 shows that 50.47% of the population in Niger is less than 14 years old. This ratio is 48.09% in Uganda, 47.72% in Chad and 57.65% in Angola. This situation identifies that young population is very high in those countries. It can also be understood from Table 5 that the percentage of people who are more than 65 is very low. On the other side, Mauritius is an African country where the percentage of people who are less than 14 years old is 19.32%. However, it can also be understood that 9.56% of people is more than 65 years old. In other words, old population is very high in Mauritius whereas there is very small young population. This situation is also very similar in Tunisia, Seychelles, Morocco and Algeria. As a result, it can be said that countries, which have high young population, are an important opportunity for investment. In other words, they may have a significant contribution to global trade (Fogel, 1994), (Coale and Hoover, 2015), (Bloom et. al., 1998).
Table 5. Distribution of the population by age in 2015
Country Name 0-14 15-64 65+ Niger 50.47 46.95 2.58 Uganda 48.09 49.42 2.49 Chad 47.72 49.83 2.45 Angola 47.65 50.04 2.31 Mali 47.53 49.95 2.52 Somalia 46.71 50.47 2.82 Gambia 46.18 51.50 2.31
Congo Dem. Rep. 45.99 51.04 2.96
Zambia 45.91 51.18 2.91 Burkina Faso 45.57 52.03 2.39 Gabon 37.13 57.77 5.10 Egypt 33.16 61.62 5.22 Libya 29.83 65.63 4.54 Cape Verde 29.65 65.77 4.58 South Africa 29.24 65.73 5.03 Algeria 28.54 65.52 5.94 Morocco 27.22 66.61 6.17 Seychelles 23.45 69.68 6.88 Tunisia 23.36 69.05 7.59 Mauritius 19.32 71.11 9.56
Macroeconomic Conditions of Africa Continent
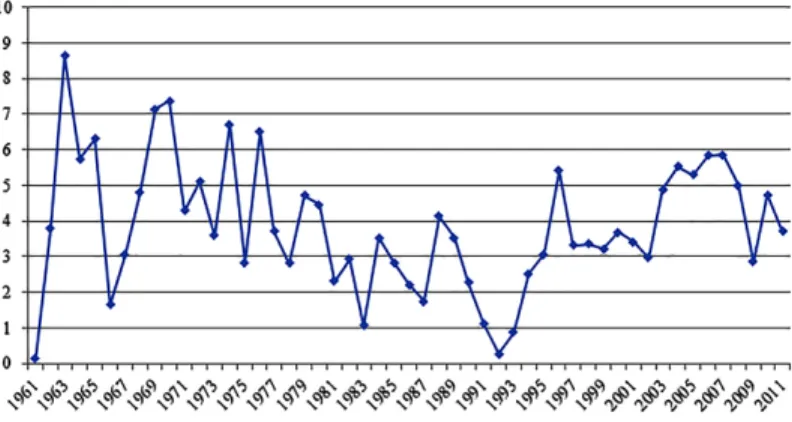
The importance of Africa with respect to the economic aspect is increasing. Figure 1 gives information about economic growth of Africa over the years.
Figure 1 shows that economic growth is very volatile in Africa. In other words, there are sharp increases and decreases in this ratio over the years. For example, although it was only 0.12% in 1961, it exceeded 8.5% in 1963. However, it decreased dramatically to 1.63% in 1966. Additionally, there was a decreasing trend in economic growth for the periods between 1970 and 1992. In 1970, annual economic growth was 7.37% whereas it declined to 0.26% in 1992. On the other side, it can also be seen that there was a small increasing trend after 1992. From 1997 to 2012, this ratio had values between 3% and 5.89%. In summary, it is understood that economic Figure 1. Economic growth of Africa
Source: World Bank.
Figure 2. Banking sector in Africa (million USD) Source: World Bank.
growth in Africa can be changed very fast. Figure 2 shows the amounts of banking sector in Africa.
As it can be seen Figure 2, the importance of banking sector is significantly increasing over the years. In 1965, the amount of banking sector was 2,551 million USD whereas it dramatically increased to 46,769 million USD in 2001. It can also be seen that there was a significant increasing trend after 2001. For example, in 2002 the amount of banking sector was 44,732 million USD, but in went up to 113,554 million USD in 2008. It can be understood that the power of the banks in Africa rises. This situation shows that trade volume in African countries is increasing. Figure 3 gives information about the export volume in Africa over the years.
As it can be seen from Figure 3, there is an important increase in export amount of Africa over the years. In 1962, African countries made 9,245 million USD amount of export. Nonetheless, this amount exceeded to 700 billion USD in 2011. Another important point is that radical increase in the export amount of Africa was mostly stated after 2002. While the export amount was 177 billion USD in 2002, this amount increased to 711 billion USD in 2011. Additionally, it is also understood that there is a decrease in this amount in 2008. The main reason behind this condition is that global mortgage crisis affected the export volume of African countries. These results give information that African countries increased export amount very much especially in the last years. This situation contributes to economic growth of these countries and increase in global trade as well (Kavoussi, 1984), (Yüksel and Zengin, 2016a). Figure 4 shows industry volume in Africa over the years.
As it can be seen from Figure 4, industry volume is significantly increasing in Africa over the years. In 1965, the industry volume in this continent was only 17,763 million USD. However, it is seen that this amount increased to 759 billion USD in 2011. In addition to this aspect, it is also identified that this increase was Figure 3. Export volume in Africa (million USD)
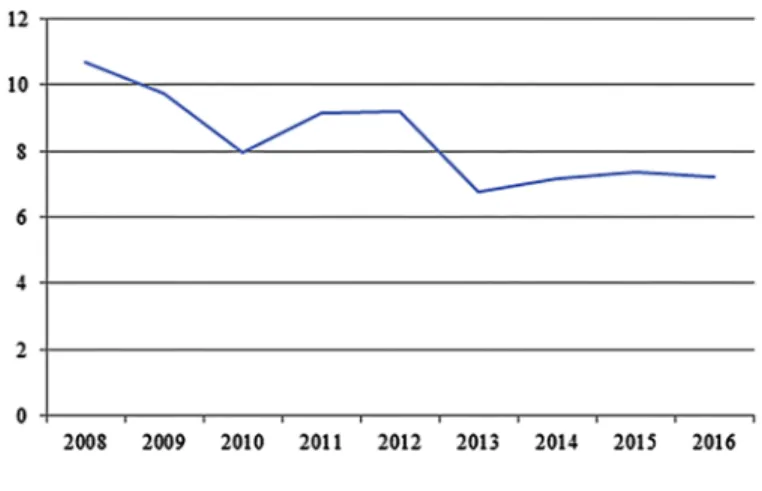
mostly occurred after 2001. While industry volume of Africa was 183 billion USD in 2002, it increased more than 4 times in 2012. It can also be understood that industry volume of Africa was affected negatively form 2008 global mortgage crisis. Figure 5 shows inflation rates of Africa between the years of 2008 and 2016.
As seen in Figure 5, inflation rates have a declining trend in Africa after 2008. For instance, inflation rate was 10.71% in 2008 whereas it decreased to 7.24% in 2016. This decreasing trend in inflation rates shows that economies in African countries started to become more stable. The main reason is that low inflation rates decrease uncertainty in the market. Because of this situation, investors in those countries will be willing to make new investments. This situation will also contribute to trade volume and global growth (Sarel, 1996).
Figure 5. Inflation rates in Africa Source: African Development Bank.
Figure 4. Industry volume in Africa (million USD) Source: World Bank.
While considering macroeconomic indicators of Africa, it is identified that this continent has a very weak performance in comparison with other continents. It is also understood that the importance of Africa is increasing over the years. In spite of this situation, it can be seen that the economies of African countries had a significant improvement after 2001. This situation makes an important contribution to global growth by increasing the trade volume in the world.
Economic Conditions of Featured African Countries
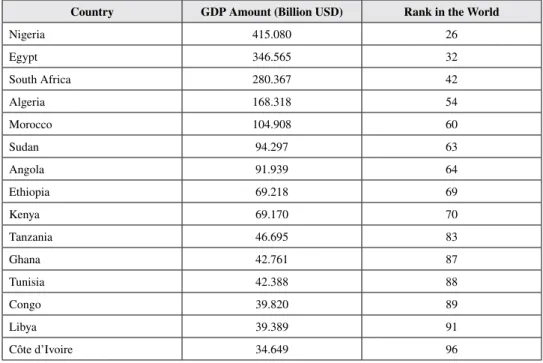
Table 6 gives information about 15 African countries which have highest GDP amount. Table 6 shows that Nigeria is the African country which has the highest GDP in 2016. It has 415.080 billion USD amount GDP in this year. On the other hand, Egypt has the second highest GDP with the amount of 346.565 billion USD. In addition to them, South Africa has 280.367 billion USD amount of GDP which is the third highest amount in Africa in 2016. It can also be understood from Table 6 that the rank of Nigeria is 26 in spite of the fact that it has the highest GDP amount in Africa. Moreover, the rank of Egypt is 32 while it has the second highest GDP in Africa. This situation shows that African countries are not successful in the world Table 6. 15 African countries which have highest GDP (2016)
Country GDP Amount (Billion USD) Rank in the World
Nigeria 415.080 26 Egypt 346.565 32 South Africa 280.367 42 Algeria 168.318 54 Morocco 104.908 60 Sudan 94.297 63 Angola 91.939 64 Ethiopia 69.218 69 Kenya 69.170 70 Tanzania 46.695 83 Ghana 42.761 87 Tunisia 42.388 88 Congo 39.820 89 Libya 39.389 91 Côte d’Ivoire 34.649 96
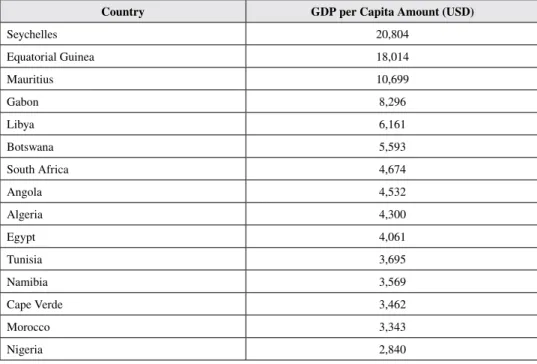
with respect to the GDP amount. In other words, Africa has a very weak role in comparison with other countries in the world. Table 7 gives information about the 15 African countries that have highest GDP per capita amount in 2016.
As it can be seen from Table 7, Seychelles is the African country which has the highest GDP per capita amount in 2016 with the amount of 20,804 USD. In addition to Seychelles, Equatorial Guinea is the second best country with the amount of 18,014 USD. Furthermore, Mauritius has 10,699 USD amount of GDP per capita which is the third highest amount. It can be understood from Table 7 that the best countries with respect to GDP per capita are very different than the best countries regarding GDP amount. Table 8 gives information about 10 African countries which have highest inflation rate in 2016.
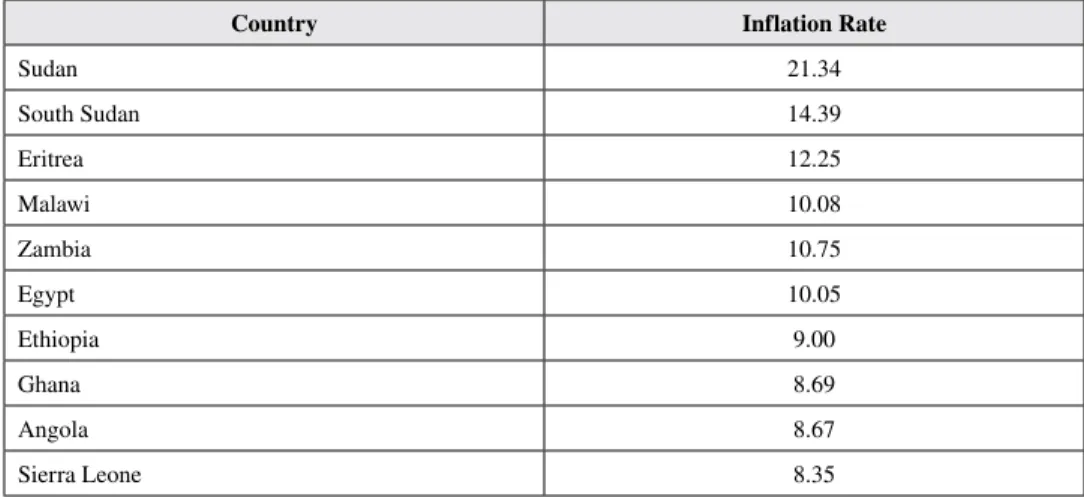
As it can be understood from Table 8, Sudan is the country which has the highest inflation rate (21.34%) in 2016. On the other side, inflation rate in South Sudan is 14.39% in 2016 which is the second highest rate. In addition to those countries, Eritrea is in the third rank with 12.25% inflation rate. This situation shows that there is high level of uncertainty in these countries. This problem has also negative effect on global trade and global growth. Table 9 gives information about the countries which have the highest real percentage growth of exports.
Table 7. 15 African countries which have highest GDP per capita (2016)
Country GDP per Capita Amount (USD)
Seychelles 20,804 Equatorial Guinea 18,014 Mauritius 10,699 Gabon 8,296 Libya 6,161 Botswana 5,593 South Africa 4,674 Angola 4,532 Algeria 4,300 Egypt 4,061 Tunisia 3,695 Namibia 3,569 Cape Verde 3,462 Morocco 3,343 Nigeria 2,840
As it can be seen from Table 9, Niger has the highest growth rate (16.83%) of export in 2016. Moreover, Chad has the second highest rate for this aspect. Export amount in this country increased about 14.84% in 2016. In addition to these two countries, Guinea-Bissau and Namibia are other important African countries regarding export growth. Increase in export amount is a very significant factor to contribute global trade. Table 10 shows the ratio of current account balance to GDP amount of African countries in 2016.
Table 8. 10 African countries which have highest inflation rate (2016)
Country Inflation Rate
Sudan 21.34 South Sudan 14.39 Eritrea 12.25 Malawi 10.08 Zambia 10.75 Egypt 10.05 Ethiopia 9.00 Ghana 8.69 Angola 8.67 Sierra Leone 8.35
Source: African Development Bank.
Table 9. 10 African countries which have the highest export growth (2016)
Country Real Percentage Export Growth
Niger 16.83 Chad 14.84 Guinea-Bissau 14.51 Namibia 12.59 Liberia 10.27 Seychelles 9.81 Libya 8.63 Senegal 8.44
Democratic Republic of Congo 7.37
Cape Verde 7.18
Table 10 explains current account balance of African countries in 2016. The most important point of this table is that only 3 countries out of 53 have current account surplus. The ratio of current account balance to GDP is 5.61% in Botswana, 1.64% in Swaziland and 0.90% in South Sudan. However, there is current account deficit in other 50 countries. The ratio of current account deficit to GDP amount is less than 5% in 12 different countries.
On the other side, other 37 countries have current account deficit/GDP ratio which is higher than 5%. For example, this ratio is 31.97% in Liberia, 44.54% in Libya and 46.10%. When the ratio of current account deficit to GDP is higher than 5%, it is accepted as a significant indicator of a financial recession in the country (Yüksel and Zengin, 2016b). Because of this situation, these 37 countries are subject to important risks.
In addition to them, Table 11 gives information about trade relationship between Africa and European Union. As it can be seen in this table, there was an increasing trend in the import amount of EU from Africa for the periods between 2006 and Table 10. Current account balance of African in 2016
Country Name 2016 Country Name 2016 Country Name 2016
Botswana 5.61 Tunisia -5.86 Togo -11.00
Swaziland 1.64 Burundi -5.95 Namibia -11.30
South Sudan 0.90 Senegal -6.04 Rwanda -11.87
Morocco -0.67 Malawi -6.06 Congo -12.40
Zambia -1.09 Kenya -6.26 Sao Tomé & Príncipe -13.80
Egypt -1.12 Sudan -6.40 Djibouti -13.96
Madagascar -1.67 Lesotho -6.49 Cameroon -14.58
Equatorial Guinea -2.33 Comoros -6.89 Gambia -14.98
Guinea-Bissau -2.41 Benin -7.12 Seychelles -15.41
Côte d’Ivoire -3.04 Ghana -7.66 Algeria -17.10
Nigeria -3.16 Tanzania -8.18 Zimbabwe -19.78
Mali -4.07 Sierra Leone -8.38 Mauritania -20.26
South Africa -4.09 Ethiopia -8.41 Niger -21.90
Eritrea -4.10 Chad -8.60 Guinea -28.36
Mauritius -4.71 Uganda -9.10 Liberia -31.97
Central Afr. Rep. -5.08 Gabon -9.64 Libya -44.54
Burkina Faso -5.31 Cape Verde -9.82 Mozambique -46.10
Angola -5.39 Congo Dem. Rep. -10.85
2012. Nevertheless, there was a reduce in the amount import form African countries from this year. On the other hand, the export amount of EU to African countries went up until 2014. However, there was a decreasing in this amount in 2015 and 2016.
Issues, Controversies, Problems
Data Set and Variables
In this study, 16 African countries were taken into the consideration because the data for other African countries was not available. In the analysis process, annual data of these 16 African countries for the periods between 2001 and 2015 was used. All data was provided from the website of World Bank. With respect to the “NPL” variable, the ratio of non-performing loans to total loans was considered. Additionally, regarding the variable on “Industry”, the ratio of industry volume in GDP amount was used. Moreover, as for the variable of “Economic Growth”, annual GDP growth was taken into the consideration. The names of these countries were given on Table 12.
The details of economic growth, industry volume and nonperforming loans data of these countries in 2015 are given on Table 13.
As it can be seen from Table 13, in 2015, Rwanda has the highest GDP growth rate (6.90%) whereas the economy of Sierra Leone is downsizing by 20%. On the Table 11. Africa and European Union trade relationship
Year Import of EU From Africa (Million EUR) Export of EU to Africa (Million EUR)
2006 17,187 15,734 2007 17,210 18,538 2008 22,367 22,436 2009 16,863 19,467 2010 21,759 23,140 2011 34,080 28,891 2012 42,422 28,856 2013 38,257 30,278 2014 37,044 31,133 2015 28,437 29,060 2016 20,412 24,915
other side, industry volume in Gabon is increasing 52% which is the highest ratio among the selected countries. After Gabon, Swaziland is the second country with 44% increase in the industry volume. Furthermore, Sierra Leone has the weakest performance with respect to this concept. In addition to them, Namibia has the lowest nonperforming loans ratio (1.55%) among all selected countries. After Namibia, South Africa is the second successful African country regarding nonperforming loans ratio. On the other hand, Sierra Leone is the worst country for this issue because nonperforming loans ratio of this country is 31.73. It can be understood from Table 12 that Sierra Leone is the worst country for each three variables. However, the best countries are different for each concept.
Table 13. The data of economic growth, industry volume and nonperforming loans for selected countries in 2015
Country NPL (%) GDP Growth Rate (%) Industry (%)
Egypt 7.2 4.2 36.3195 Gabon 3.8 3.85668 52.8165 Ghana 14.6736 3.8827 26.3476 Kenya 5.98876 5.6492 19.5245 Mauritius 7.02514 3.50001 22.7061 Morocco 6.53333 4.4 29.1991 Mozambique 4.3 6.26654 20.0823 Namibia 1.55169 5.66377 30.4034 Nigeria 5.32419 2.65269 20.3819 Rwanda 5.83738 6.9042 14.2368 Senegal 21.1733 6.48519 23.5929 Sierra Leone 31.73 -20.301 7.56926 South Africa 3.12083 1.2833 28.7195 Swaziland 7.54107 1.65739 44.2457 Tunisia 16.2 0.8 28.9269 Uganda 5.12696 5.04298 20.4321
Table 12. 16 African countries analyzed in the study
Egypt Mauritius Nigeria South Africa
Gabon Morocco Rwanda Swaziland
Ghana Mozambique Senegal Tunisia
Dumitrescu Hurlin Panel Causality Tests
Dumitrescu and Hurlin panel causality test is accepted as an advanced form of Granger causality analysis. It tests causality relationship between the variables. The main requisite of this analysis is that the variables, which will be used in the causality analysis, should be stationary. Because of this situation, stationary analysis of the variables should be performed by using panel unit root tests before starting Dumitrescu Hurlin panel causality test. The details of this test were explained below (Dumitrescu and Hurlin, 2012).
Yi t ai Y Y B X k K i k i t k k K i k i t k i t , = + , + , + , = − = −
∑
∑
1 1 ε (1)In this equation, K explains optimum lag interval. On the other side, Y and X represents the variables of which causality analysis will be examined. That is to say, the purpose of this analysis is to determine whether X is the cause of Y or not. Because the methodology considered in the analysis is essential (Eti and İnel, 2016), it can be said that Dumitrescu Hurlin panel causality analysis is very helpful in order to achieve the purpose of this study.
Analysis Results
Stationary analysis of the variables is the first step to evaluate the relationship between non-performing loans, industry volume and economic growth. For this purpose, Levin, Lin and Chu (LLC) panel unit root test was used. The results of this test were given on Table 14.
As it can be understood from Table 14, as a result of Levin, Lin and Chu panel unit root test, the probability values of all three variables are less than 0.05. This situation shows that these variables do not have unit root. In other words, they are stationary at their level values. Owing to this situation, these variables were used in the analysis with their original forms. In addition to this condition, to achieve Table 14. LLC panel unit root test results
Variables Levin, Lin and Chu Test (p Value)
NPL 0.0000
the objective of the study, Dumitrescu Hurlin panel causality test was taken into the consideration. The results of this test were given on Table 15.
As it can be seen from Table 15, the probability values for the null hypothesis of “Industry volume does not cause economic growth” for 1 lag and 2 lags are less than 0.05. Because of this situation, it was defined that this null hypothesis can be rejected. This result demonstrates that there is a causality relationship between industry volume and economic growth. That is to say, in order for African countries to provide economic growth, increase in industry volume should be provided. It can also be said that when industry is improved in Africa, this will contribute to global trade. Additionally, this situation has a positive influence on global growth.
Another important result of this analysis is that the null hypothesis of “Economic growth does not cause NPL” was rejected since the probability value of this hypothesis is less than 0.05. This result explains that decrease in economic growth is the main cause of the non-performing loans ratio in African countries. This condition shows that when there is a decline in economic growth of these countries, customers started to face some difficulties in order to pay their debts to the banks. Due to this aspect, the non-performing loans ratio increases. Because economic recession has an increasing effect on nonperforming loans, economic growth should be provided to contribute global trade.
In addition to these aspects, the null hypothesis of “Industry volume does not cause NPL” can be rejected as well because the probability values of this hypothesis for 1 lag and 3 lags are less than 0.05. This situation refers that decrease in the industry volume is the key reason of high non-performing loans ratio. This issue explains that when there is decrease in industry volume in African countries, the companies will have lower trade volume and the profitability of them will decline. Table 15. Dumitrescu Hurlin panel causality test results
Null Hypothesis Probability Values (lag=1) Probability Values (lag=2) Probability Values (lag=3)
“Industry” does not cause “Economic
Growth” 0.5335 0.0000 0.0003 “Economic Growth” does not cause
“Industry” 0.5887 0.4413 0.2233 “NPL” does not cause “Economic
Growth” 0.8687 0.3226 0.5211 “Economic Growth” does not cause
“NPL” 0.0096 0.8637 0.5078 “NPL” does not cause “Industry” 0.6106 0.4218 0.9599
As a result of this aspect, these parties have problems regarding the repayment of the loans taken by the banks. In other words, global trade possibilities should be taken into the consideration to improve the industry. Therefore, it can be possible to minimize the ratio of nonperforming loans.
SOLUTIONS AND RECOMMENDATIONS
In this study, it is concluded that industry growth is the main cause of economic growth which has a decreasing effect on nonperforming loans ratio. As it can be understood these three variables are connected to each other for African countries. Therefore, it is obvious that African countries should focus on improving their industry levels in order to minimize the negative ways of lower economic growth and higher nonperforming loans.
FUTURE RESEARCH DIRECTIONS
In this study, the relationship between nonperforming loans, industry development and economic growth is evaluated for African countries. In addition to this aspect, another study, which makes a comparison developed countries with developing countries with respect to this relationship, will be also very beneficial to the literature.
CONCLUSION
In this paper, it was aimed to identify the causality relationship between non-performing loans, industry volume and economic growth. Within this scope, 16 African countries were analyzed in this study. Because there is not necessary data for other African countries, they had to be eliminated in the analysis. Furthermore, annual data of these 16 African countries for the periods between 2001 and 2015 were taken into the consideration. Additionally, Dumitrescu Hurlin panel causality test was considered in order to reach this objective.
In the analysis process, first of all, unit root test was made to understand whether the variables are stationary or not. Within this context, Levin, Lin and Chu (LLC) panel unit root test was used. As a result of this test, it was defined that probability values of all three variables are less than 0.05. This situation shows that these variables do not have unit roots. In other words, it was seen that they are stationary on their level values. Owing to this situation, it was identified that there are appropriate for
According to the results of the panel causality analysis, it was determined that there is a causality relationship between industry volume and economic growth. In other words, it was understood that decrease in the industry volume is the main reason of economic recession. The main reason behind this situation is that when there is a problem in the industry, companies will face financial problems and this issue results in decreasing economic growth. Due to this aspect, it was recommended that African countries should focus on industry development in order to provide economic growth. It can also be understood that when industry is developed in Africa, this will contribute to global trade has an increasing effect on global growth.
In addition to this situation, it was also concluded that decrease in economic growth is the main cause of the non-performing loans ratio in African countries. This condition demonstrates that when economic growth of these countries is declined, customers started to face some financial difficulties in order to pay their debts to the banks. Owing to this situation, the non-performing loans ratio of these banks increases. Therefore, it can be said that when economies of African countries are developed, the problem of high non-performing loans ratios will be minimized. To enhance global growth, banking sector should work effectively. Hence, as it can be understood from the result of the analysis, economies of the countries should be improved to enhance effective banking sector and provide global growth.
Another important result of this study is that decrease in the industry volume is the key reason of high non-performing loans ratio. This issue explains that when industry volume in African countries is decreased, the companies will have lower trade volume. Because of this situation, the profitability of these countries will decline. As a result of this aspect, these parties have problems regarding the repayment of the loans taken by the banks. Thus, it was understood that these countries should also improve their industries to reduce non-performing loans ratio. While considering this result, it can be said that global trade should be developed to have effective banking system and increase life standards of the people. Owing to this situation, it can be possible to reach global growth.
REFERENCES
Abadi, S., Achsan, N. A. I., & Rachmina, D. (2014). The Dynamics of Non-Performing Loan in Indonesian Banking Industry: A Sensitivity Analysis using VECM Approach. International Journal of Education and Research, 2(8).
Adebola, S. S., Sulaiman, W., Yusoff, W., & Dahalan, J. (2011). An ARDL approach to the determinants of nonperforming loans in Islamic banking system in Malaysia. Kuwait Chapter of Arabian Journal of Business and Management Review, 1(2), 20–30.
Ahmad, F., & Bashir, T. (2013). Explanatory Power of Macroeconomic Variables as Determinants of Non-Performing Loans: Evidence form Pakistan. World Applied Sciences Journal, 22(2), 243–255.
Amediku, S. (2006). Stress tests of the Ghanaian Banking Sector: A VAR Approach. Working Paper of Bank of Ghana, WP/BOG-2006/02.
Arisoy, I. (2008). Türkiye’de Sanayi Sektörü-Iktisadi Büyüme Ilişkisinin Kaldor Hipotezi Çerçevesinde Test Edilmesi (No. 2008/1). Discussion Paper, Turkish Economic Association.
Balgova, M., Nies, M., & Plekhanov, A. (n.d.). The economic impact of reducing non-performing loans. EBRD Working Paper No. 193.
Beck, R., Jakubik, P., & Piloiu, A. (2013). Non-performing loans: What matters in addition to the economic cycle? Working Paper Series, 1515.
Bloom, D. E., Sachs, J. D., Collier, P., & Udry, C. (1998). Geography, demography, and economic growth in Africa. Brookings Papers on Economic Activity, 1998(2), 207–295. doi:10.2307/2534695 PMID:12295931
Coale, A. J., & Hoover, E. M. (2015). Population growth and economic development. Princeton University Press.
Diaz Bautista, A. (2003). México´s Industrial Engine of Growth: Cointegration and Causality. Revista Momento Economico, (126).
Drakopoulos, S. A., & Theodossiou, I. (1991). Kaldorian Approach to Greek Economic Growth. Applied Economics, 23(10), 1683–1689. doi:10.1080/00036849100000133 Dumitrescu, E. I., & Hurlin, C. (2012). Testing for Granger non-causality in heterogeneous panels. Economic Modelling, 29(4), 1450–1460. doi:10.1016/j. econmod.2012.02.014
Elegbe, A. (2013). Bank failure and economic development in Nigeria: An empirical approach. British Journal of Economics. Finance and Management Sciences, 8(1), 46–63.
Erdogdu, A. (2016). Assessing the Impact of Non-Performing Loans on Economic Growth in Turkey. Economic and Social Development: Book of Proceedings, 309. Ersin, İ., & Duran, S. (2017). Faizsiz Finans Döngüsünü Oluşturma Açısından Adil Ekonomik Düzen Söyleminin Kredileşme İlkeleri Ve Uygulanabilirliğinin Değerlendirilmesi. Turkish Studies, 12(8), 109–132. doi:10.7827/TurkishStudies.11928
Espinoza, R., & Ananthakri, P. (2010). Nonperforming Loans in the GCC Banking System and their macroeconomic effects. IMF Working Paper WP/10/224.
Eti, S., & İnel, M. N. (2016). A Research on Comparison of Regression Models Explaining the Profitability Base on Financial Data. International Journal of Business and Management, 4(10), 470–475.
Fofack, H. (2005). Nonperforming loans in Sub-Saharan Africa: causal analysis and macroeconomic implications. World Bank Policy Research Working Paper, 3769. Fogel, R. W. (1994). Economic growth, population theory, and physiology: the bearing of long-term processes on the making of economic policy (No. w4638). National Bureau of Economic Research. doi:10.3386/w4638
Ghosh, A. (2015). Banking-industry specific and regional economic determinants of non-performing loans: Evidence from US states. Journal of Financial Stability, 20, 93–104. doi:10.1016/j.jfs.2015.08.004
Greenidge, K., & Grosvenor, T. (2010). Forecasting non-performing loans in Barbados. Journal of Business. Finance and Economics in Emerging Economies, 5(1), 79–108. Haniifah, N. (2015). Economic Determinants of Non-performing Loans (NPLs) in Ugandan Commercial Banks. Taylor’s. Business Review (Federal Reserve Bank of Philadelphia), 5(2), 137–153.
Kaldor, N. (1966). Causes of the Slow Rate of Economic Growth of the United Kingdom: An Inaugural Lecture. Cambridge University Press.
Karahanoğlu, İ., & Ercan, H. (2015). The Effect of Macroeconomic Variables on Non-Performing Loans in Turkish Banking Sector. Journal of International Social Research, 8(39), 883–892. doi:10.17719/jisr.20153913804
Kavoussi, R. M. (1984). Export expansion and economic growth: Further empirical evidence. Journal of Development Economics, 14(1), 241–250. doi:10.1016/0304-3878(84)90052-X
Klein, N. (2013). Non-Performing Loans in CESEE: Determinants and Macroeconomic Performance. IMF Working Paper WP13/72.
Kownacki, P. (2000). Migration phenomena and current social and economic problems of the African countries. Hemispheres: Studies on Cultures and Societies, (15), 37-49.
Louzis, D. P., Vouldis, A. T., & Metaxas, V. L. (2012). Macroeconomic and bank-specific determinants of non-performing loans in Greece: A comparative study of mortgage, business and consumer loan portfolios. Journal of Banking & Finance, 36(4), 1012–1027. doi:10.1016/j.jbankfin.2011.10.012
Messai, A. S., & Jouini, F. (2013). Micro and macro determinants of non-performing loans. International Journal of Economics and Financial Issues, 3(4), 852–860. Millin, M., & Nichola, T. (2005). Explaining economic growth in South Africa: A Kaldorian approach. International Journal of Technology Management & Sustainable Development, 4(1), 47–62. doi:10.1386/ijtm.4.1.47/1
Nkusu, M. (2011). Nonperforming loans and macrofinancial vulnerabilities in advanced economies. IMF Working Paper, WP/11/161.
Saba, I., Kouser, R., & Azeem, M. (2012). Determinants of Non Performing Loans: Case of US Banking Sector. The Romanian Economic Journal, 44(6), 125–136. Sarel, M. (1996). Nonlinear effects of inflation on economic growth. Staff Papers, 43(1), 199–215. doi:10.2307/3867357
Sheefeni, J. P. S. (2015). The Impact of Macroeconomic Determinants on Non-performing Loans in Namibia. International Review of Research in Emerging Markets and the Global Economy, 4, 612–632.
Škarica, B. (2014). Determinants of non-performing loans in Central and Eastern European countries. Financial Theory and Practice, 38(1), 37-59.
Terzi, H., & Oltulular, S. (2011). Türkiye’deki Sanayileşme ve Ekonomik Büyüme Arasındaki Nedensel İlişki. Doğuş Üniversitesi Dergisi, 5(2), 219–226.
Toenniessen, G., Adesina, A., & DeVries, J. (2008). Building an alliance for a green revolution in Africa. Annals of the New York Academy of Sciences, 1136(1), 233–242. doi:10.1196/annals.1425.028 PMID:18579885
Vatansever, M., & Hepsen, A. (2013). Determining impacts on non-performing loan ratio in Turkey. Journal of Finance and Investment Analysis, 2(4), 119–129. Venâncio, S. F. M. (2013). Does financial development promote economic growth? (Doctoral dissertation). Instituto Superior de Economia e Gestão.
Watts, M. (1991). Entitlements or empowerment? Famine and starvation in Africa. Review of African Political Economy, 18(51), 9–26. doi:10.1080/03056249108703903
228
Yüksel, S., Dincer, H., & Hacioglu, U. (2015). CAMELS-based Determinants for the Credit Rating of Turkish Deposit Banks. International Journal of Finance & Banking Studies, 4(4), 1–17.
Yüksel, S., & Zengin, S. (2016a). Causality relationship between import, export and growth rate in developing countries. International Journal of Commerce and Finance, 2(1), 147–156.
Yüksel, S., & Zengin, S. (2016b). Leading Indicators of 2008 Global Crisis: An Analysis with Logit and MARS Methods. Finansal Araştırmalar ve Çalışmalar Dergisi, 8(15), 495–518.
KEY TERMS AND DEFINITIONS
Current Account Balance: Gives information about the difference between the
incoming and outgoing amounts of foreign exchanges.
Economic Growth: The increase in GDP amount in comparison with the last
period.
Export: Selling goods to other countries.
GDP: The first letters of gross domestic product. It gives information about the
economic power of the country.
GDP Per Capita: Calculated as the total GDP value divided by the number of
people in this country.
Industry Growth: Gives information about the improvement in the industry
volume.
Inflation Rate: The increase in the price levels.
Nonperforming Loan: The loan which cannot be paid by the customers within
90 days period after the maturity.
Nonperforming Loans Ratio: Calculated by dividing nonperforming loans to