37
TOURISTIC DESTINATIONS’ PERCEIVED RISK AND
PERCEIVED VALUE AS INDICATORS OF E-WOM
AND REVISIT INTENTIONS
Abdullah USLU1Ali Naci KARABULUT2 Received: 20.07.2018, Accepted: 31.10.2018
Abstract
In the process of destination selection, it is known that tourists perceive many different risks and use eWOM behavior as a risk reduction tool. Also the risks that consumers perceive are influential on the values they perceive. For this reason, spreading positive eWOM messages and encouraging revisit intentions are seen as significant competitive advantages in terms of destination management. In this context, to measure the effects of tourists’ perceived risk on their perceived value and the effects of their perceived value on their eWOM dissemination and revisit intentions, have been identified as the main objectives of this study. The sample of the study consists 228 tourists who visited the Fethiye (TR) destination in 2017. As a result of analysis of the data with Structural Equation Modeling, it is found that perceived risk variable has an impact on perceived value, perceived value variable has impacts on eWOM dissemination intention and revisit intention and eWOM dissemination intention has an impact on revisit intention.
Keywords: Destination marketing, eWOM, perceived risk,
perceived value.
1. Introduction
Since consumers can only learn the results of their purchasing decisions in the future, each purchasing process contains uncertainties and therefore risks for them (Cox & Rich, 1964: 33, Taylor, 1974: 54).
1 Assistant Professor, Department of Tourism Management, Manavgat Faculty of
Tourism, Akdeniz University, Manavgat, Antalya, Turkey, E-mail: [email protected], http://orcid.org/0000-0002-3660-7096
2 Assistant Professor, Department of Business Administration, Faculty of Management,
Mugla Sitki Kocman University, Fethiye, Mugla, Turkey e-mail: [email protected], http://orcid.org/0000-0001-9156-1732
38
Although there is no conclusive definition of risk, it is seen in the literature that it is explained by concepts such as expected loss, expected disutility, the probability of adverse outcomes, effects or consequences (Aven & Renn, 2009: 1). As can be understood from these explanations, the concept of risk is an important part of the consumer's purchasing process, being the estimates related to losses that are likely to occur in the future.
This general acceptance in the consumer behaviour area is undoubtedly true for the tourism sector. In the process of destination choice, tourists are perceiving and trying to minimize various risks that related with destination alternatives (Karl & Schmude, 2017, Fuchs & Reichel, 2011, Chew & Jahari, 2014, Tavitiyaman & Qu, 2013: Lepp et al, 2011, Çetinsöz & Ege, 2012). For this purpose, while making a rigorous assessment of the available alternatives, they also refer to all possible resources of information (Sharifpour et al., 2014).
However, it is also known that consumers do not make an objective risk assessment that applies to everyone. Consumers who try to make decisions with limited knowledge and experience often face a purchase situation that they have not experienced before and assesses with subjective impressions of the risk involved in this situation (Mitchell, 1999: 164). This situation has led to the formation of “perceived risk” term in consumer behaviour literature, which defines risks in terms of the consumer's perceptions.
The concept of perceived risk was first emphasized by Bauer (1960, 1967) and later by many scholars (for example: Kahneman & Tversky, 1979; Sweeney et al., 1999; Tsanakas & Desli, 2003: 962), being considered as one of the most important variables in consumers ' purchasing preferences.
It is known that consumers attempt to obtain information from their external environment to reduce perceived risk and often refer to other consumers' knowledge as information sources (Clow & Baack, 2016; Koç, 2016, Kutluk & Arpacı, 2016). Such information exchanges of consumers about products and services are expressed with the concept of word-of-mouth (WOM). Arndt (1967) describes WOM as “seeking social support for adoption or non-adoption and risk reduction by group action” and Sundaram et al. (1998) sorts positive WOM reasons as altruistic, product involvement, and self-enhancement and negative WOM reasons as altruistic, anxiety reduction, vengeance, and advice seeking reasons.
39
Today, presenting information in an accessible form is as important as reaching information (Güler et al. 2018). Consumers are able to access all kinds of information from anywhere through Internet and mobile communication technologies, and can share information including a wide range of social networks. Thus, “electronic Word of mouth (eWOM)” has emerged as a concept, which is more credible, more accessible and more powerful than classical WOM (Akyüz, 2013). Tham et al. (2013) stated the distinguishing characteristics of eWOM, when compared to classic WOM, such as referring the communication of people who are not familiar with each other, the diversity of channels and content, the opportunities for greater information requests, message retention capability, and content provider motivations for disclosure.
eWOM an important determinant of any purchase decision today, is also effective in the selection of destinations known as the selections that tourists perceive numerous risks (Abubakar, 2016; Chen et al., 2014; Di Pietro et al., 2011; Fotis et. al., 2012; Jakobsen & Munar, 2012; Jalilvand et al. 2012). Moreover, the content developed by users is perceived more reliable than those of official tourism websites, travel agencies and mass media advertising (Fotis et al. 2012, Lopez & Sicilia, 2013) and factors such as the lack of evaluation in the tourism sector without experience, lead consumers to take the comments of experienced people more into account and thus make WOM the most important source of information for consumers (Aydın, 2014).
In this study, it was aimed to examine the effects of perceived risk level, perceived value, eWOM intention and the intention to visit again, which is an important determinant in selecting tourism destination and to present valuable insights to target audiences as well as to contribute literature and target audiences. For this purpose, first a literature survey was conducted to develop conceptual knowledge, then the time that the hypothesis was tested, empirical research was carried out and the findings of the research were discussed.
2. Literature Review
In the literature, there are many studies that examine the impact of the concept of perceived risk on the destination selection of tourists. For example, Sharifpour et al. (2014), surveyed risk perceptions associated with traveling to the Middle East in his research on 508 Australian participants. The findings of the study reveal that objective knowledge with regard to destination is variable with the most potent influence on tourists’ risk perceptions, while subjective knowledge does not modify
40
the perceived risk significantly, and the various types of perceived risk may lead to the use of different sources of information.
Sarıbaş and Öter (2013) consider risk as an important element of travel motivation and destination selection. However, in the study carried out by Karamustafa and Erbaş (2011) on foreign tourists coming to Cappadocia, a cultural-oriented tourist destination, it was found that the functional risk factor during tour package purchase was more dominant than other risk factors, and the risk factors differ according to the demographic and cultural characteristics of tourists in the visits.
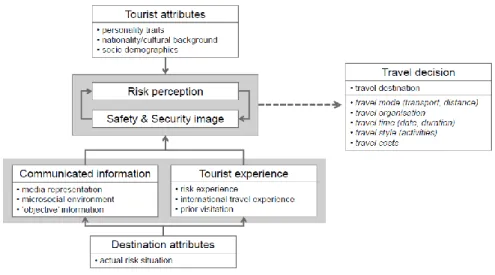
Karl & Schmude (2017) have generated a framework according to their literature review which introduces that risk perceptions are operating between destination and tourist attributes with safety and security images as seen in Figure 1.
Figure 1: Karl & Schmude’s Literature based research framework.
Perceived risk, whose effects on the selection of destination has been determined by many studies, have different types identified in the literature. Lim (2003: 219), examined 18 studies in the literature and stated that the perceived risk has been addressed in nine types of risk as financial risk, performance risk, social risk, physical risk, psychological risk, time loss risk, personal risk, privacy risk and resource risk. However, in these studies analysed by Lim and in other studies in the literature, it has been observed that these nine dimensions are not
Tourist attributes
• personality traits
• nationality/cultural background • soc.to demographics
i Travel decision
Risk perception • travel destination
---
-•
• travel mode (transport, distance)Safety & Security image • • tratravveel orl time gani(dsatiateon , duration)
t • • tratravveel l costs style /activiUes)
I I
-Communicated information Tourist experience
• media representation • risk experience
• microsocial environment • international travel experience
• ·objective' information • prK>r visitation
• •
-I
Destination attributes
41
completely present and some of this types are derived from nomenclature differences.
For example, Çetinsöz & Ege (2012), – by citing from Roehl & Fesenmajier (1992), Sönmez & Grafe (1998) – listed the most common risk types pronounced for the tourism sector as financial risk, functional risk (or performance risk), physical risk, social risk, psychological risk, satisfaction risk, time loss risk, health, political uncertainty and terrorism. Sharifpour et al. (2014) examined the perceived risk associated with destination under three headings: psychological risk, physical risk, and performance risk. Yeniçeri et al. (2012: 147) stated six types as functional risk, physical risk, financial risk, social risk, psychological risk, and time risk, and Tsiros and Heilman (2005: 117) in their literature review, indicated that perceived risk was examined under six types as functional risk, physical risk, financial risk, social risk, psychological risk, and performance risk. Koç (2016) also refers to six types of risk, including financial risk, performance risk, physical risk, psychological risk, social risk and time risk.
The risk types, whose effects on destination selection are examined in this study, are defined as follows in the literature:
1. Perceived physical risk: risks associated with personal safety, such as illness or injury during use (Tsiros and Heilman, 2005, Cetinsöz & Ege, 2012).
2. Perceived social risk: the risk of embarrassment to other people or loss of social status due to a failed choice (Tsiros and Heilman, 2005, Çetinsöz & Ege, 2012).
3. Perceived financial risk: the risk of money loss due to the purchased service (Çetinsöz & Ege, 2012).
4. Perceived performance risk: the risk is that the purchased product does not function properly, that it can only be used for a short period (Lim, 2003: 219), that the service characteristics do not respond to the needs of the consumer (Çetinsöz & Ege, 2012).
5. Perceived psychological risk: the risk of experiencing disappointment (Lim, 2003: 219), the loss of ego (Tsiros and Heilman, 2005: 117) and the damage of personal image (Çetinsöz & Ege, 2012).
As can be understood from these definitions, perceived risk is a very comprehensive concept with different aspects. Due to this comprehensive characteristic, it is only possible to measure the total
42
effect of perceived risk on consumer behaviour by dealing with different aspects of the issue.
Perceived risk, in the literature on consumer behaviour, is considered to be one of the most fundamental negative-directional influences of perceived value (Chen & Dubinsky, 2003; Erdogan & Aksoy, 2013; Sweeney et al., 1999).
Chiu et al. (2014)’s study considers perceived value in two forms: utilitarian and hedonic, and this suggests that perceived value species are affected by the perceived risk in different ways. Accordingly, in consumers ' online purchases, while perceived risk negatively moderates the relationship between utilitarian value and repeat purchase intention, it also positively moderates the relationship between hedonic value and repeat purchase intention.
Accordingly, in the field research of our current study, the following hypotheses have been developed to question the effects of perceived risk on perceived value and destinations, and the effect of perceived value on destinations and revisit intentions: “H1: the perceived level of risk on tourism destinations has an impact on the perceived value of the visited destination.”, “H2: the perceived value regarding the destination increases the intention to revisit this destination.”
It is a very common reaction for consumers to exchange information with their social environment in the face of perceived risk. The basis of cognitive control to reduce perceived risks lies in collecting and processing information (Koç, 2016). eWOM, which is ranked first among the main sources of information in the internet for the consumer and also started to be ranked first in the Internet resources, has a close relationship with consumers’ perceived risk concept in this respect.
eWOM messages, which are used as a risk reduction tool by consumers, are known to be much more reliable than conventional marketing messages. Moreover, Lee (2014)’s study reveal that, even some consumers who have experienced unsuccessful eWOM experiences leading to be deceived, continue to rely on eWOM messages. The high level of trust in the consumer enhances the importance of eWOM with regard to the perceived risk.
There are many studies in the literature that show that eWOM is an important determinant in the selection of destinations. For example, Zhu & Lai (2009)’s empirical study which compares the reception population data in Zhejiang Province and the eWOM information in two Chinese
43
websites also provides the close relationship between eWOM and booking behaviours of tourists. They had determined a correlation between the volume of online reviews and tourist population with their findings. Also Jalilvand et al. (2012)’s study which reveal that eWOM positively influences the travel intent directly and by the mediation of destination image and attitude toward destination; Abubakar (2016)’s study which suggest that eWOM is positively related to travel intention and destination trust, while destination trust is positively related to travel intention; and Del Bosque et al. (2018)’s study which shows that word of mouth communication is also influental on tourists’ expectations for the destinations are the studies among the ones on the subject.
It is seen that such studies in the literature are mostly related to the causes and consequences of obtaining information through eWOM. However, consumers also have the behaviour of sharing information through eWOM. Bulut & Karabulut (2018) defines consumer eWOM behaviour in two ways: information search and information sharing. In online shopping, acquiring information through eWOM reveals the consumer's confidence level, and the behaviour of sharing information with the eWOM has a positive effect on the purchasing behaviour by increasing the loyalty level of the consumer.
According to Aydın (2014), who deals with the eWOM behaviour of tourists in two ways: searching for information and sharing information, the most powerful motivation that drives the tourists to research information through eWOM is “knowledge acquisition/social orientation”, and the components of this factor are as follows: seeing different evaluations, taking advantage of the experience of others, comparing them with their own experiences, to meet people with the same problems, helping them making the right purchase decision and making a complete purchase decision. The most powerful motivation moving tourists to share information through eWOM is “self-improvement” and the components of this factor are helping others, expressing satisfaction, expressing successful experiences, warning others, protecting others and sharing successful experiences.
The tourist experiences are physical and multi sensual and responses to surrounding stimuli transformed into stories, experiences and memories (Sarıbaş et al. 2017). Tham et al. (2013) suggests that eWOM is important for offering visitors the opportunity to share their memorable tourism experiences, bringing industry stakeholders together (for building a strong destination image) and providing more interaction
44
with social media, in terms of Destination Management Organisation (DMO). Fotis et al. (2012) suggests that tourists are largely using social media as a means to share their experiences after their holidays.
In the field research of this study, the following hypotheses were developed to examine the relationship of eWOM propagation behaviour, which is seen to be relatively less studied in the literature, with the intention to revisit the destination and the perceived value of destinations: “H3: the perceived value of destination increases the intention of spreading the eWOM.”, “H4: the intention to spread eWOM on destination increases the intention to revisit the destination.”
One of the reasons that affects tourists to spread positive eWOM messages about destinations and to improve their intention to revisit destinations is that they have a level of satisfaction from the holiday experience.
The concept of customer satisfaction is defined as the positive difference between customer expectations before purchasing behaviour and customer experiences after purchasing behaviour (Başanbaş, 2012, Onaran et al., 2013). According to Expectation Confirmation Theory (also known as Expectancy Disconfirmation Theory or Expectancy Disconfirmation Paradigm), expectations and perceived performance are key elements for satisfaction. The satisfaction occurs to the extent that the perceived performance that occurs after the product/service experience exceeds the expectations prior to the experience, and the dissatisfaction occurs when the expectations exceed the perceived performance (Hsu & Lin, 2015, Mitchell, 2016, Oliver 1980, Yüksel&Yüksel, 2008). There are many studies in the literature in the direction that the perceived value, which is an increasing element of satisfaction, also increases the repurchase (Eggert & Ulaga, 2002; Wu et al., 2014) and revisit intentions (Allameh et al., 2015; Oh, 1999; Um et al., 2006; Raza et al. 2012).
In the field research of this study, in which the relationship between the perceived risk and perceived value variables was tested, it was found that there was a correlation between them. Because, as mentioned earlier, perceived risk is a pre-purchase variable that has an impact on reducing tourist expectations and the perceived value is a post-purchase variable that expresses the positive impression that tourists have on their destination experiences.
45
Thus, within the scope of our field survey, which will be explained in the next section, the perceptions of tourists before and after the experience of destination are compared and associated.
3. Methodology
The aim and scope of the study, model and hypotheses, population and sample, data collection tools and analysis method, finally the findings of the research are included in this section.
3.1. Purpose and scope of the research
This study was carried out to determine the risks that tourists perceive in relation to an unknown destination, the value that they perceive in relation to a destination they have visited, the value that they perceive in relation to a destination they have visited, the intention to spread eWOM about the destination they have visited, the intention to revisit the destination, and finally the intention to spread eWOM about a destination they visited and the intention to revisit that destination.
Within the scope of the research, tourists coming to Fethiye destination in 2017were examined. Fethiye is one of the important summer tourism centres of Turkey with its historical and natural attributes where more than half a million tourists are hosted every year. The population of the research is limited in this way because there has been no previous study on this subject and because of the time and cost limitations of the research.
3.2. Model and hypotheses of research
Research model was developed being based on the studies of Lim (2003), Nadir et al. (2008), Sharifpour et al. (2014) and Abubakar (2016). According to the research model shown in Fig.2, the risk perceived by tourists coming to Fethiye destination is estimated to have an impact on perceived value by reducing the expectation for destination. This research model was designed considering that the perceived value had an effect on the intention to visit again and the intention to spread the eWOM, and that the intention to spread the eWOM had an effect on the revisit intentions.
46
Figure 2: Conceptual Model
In this context, research hypotheses developed to determine the perceived value of perceived risk, the intention to revisit the perceived value and the eWOM intention, and the effect of eWOM intention on the intention of revisiting are as follows:
H1: the perceived level of risk related to tourism destinations
increases the perceived value related to the visited destination.
H2: the perceived value of the destination increases the intention to
revisit the destination.
H3: the perceived value of destination increases the intention of
spreading the eWOM regarding the destination.
H4: the intention to spread eWOM about destination increases the
intention to revisit the destination.
The Population and Sample of the Research
The population of the survey is the tourists visited Fethiye in 2017. According to Nunnally (2010) and Kline (2011), the sampling volume in the research must be at least 10 times the number of variables. Since the number of variables used in this research model is 20, the number of 200, which is 10 times higher, is determined as the minimum number of samples. Due to the fact that it is very difficult to reach the entire population of the study, 300 tourists were reached between May-July 2017 with easy sampling method. Since 45 questionnaires were missing among the completed, and since 27 questionnaires were removed from
:,
...
47
the analysis due to missing data, end value and normality analyses, the evaluations were carried out on 228 questionnaires.
Data Collection Tools and Methods of the Research
The survey form, which is the data collection tool of the research, consists of two parts. In the first part, there are 8 questions about the demographic characteristics of tourists, and in the second part there are 30 questions about the perceived risk, the perceived value, the intention to visit again and the intention to spread the eWOM.
The first four statements on the risk perceived in the research scale are on financial risk, 5., 6. and 7. expressions are on performance risk, 8., 9., 10. and 11. statements are on physical risk, 12., 13. and 14. are on psychological risk, 15., 16. and 17. Expressions are on social risk, where they are adapted to tourism destination selection by taking from Karabulut’s (2013) scale.
The scale of Karabulut (2013) including 17 items was used to measure the perceived risk variability, having 4 items to measure the financial risk factor, 3 items to measure the performance risk factor, 4 items to measure the physical risk factor, 3 items to measure the psychological risk factor, and 3 items to measure the social risk factor, Ryu, Han and Kim’s (2008) scale including 3 items was used to measure the perceived value, Clemens, Wu, Hu and Gan’s (2009) scale including 3 items was used to measure the revisit intention, and the scale of Karatepe and Ekiz (2004) and Nadiri et al. (2008) including 7 items was used to measure the intention of spreading eWOM. 5-Point Likert expressions in the scale were: “1= I Strongly Disagree, 2= I Disagree, 3=Neither Disagree Nor Agree, 4= I Agree, 5= I Strongly Agree”.
In this study, reliability analysis of the variables used in the first scale and correlation values were examined in the scope of the analysis method and then convergent-divergent validity values were investigated. In this study, firstly, confirmatory factor analysis (CFA) and second-level confirmatory factor analysis were applied to the perceived risk components. For the purpose of testing hypotheses, structural Equation modelling (SEM) was used to determine the extent to which the relationship between multiple variables predicted by a particular theory is verified by the data set (Schumacker and lomax, 2004).
4. Analysis and Results
The demographic findings of the study, Cronbach Alpha coefficients of scale, relationship between variables of model,
48
convergent-divergent validity, confirmatory factor analysis, second-level CFA, measurement model and road analysis are included in this topic.
4.1. Demographic Findings
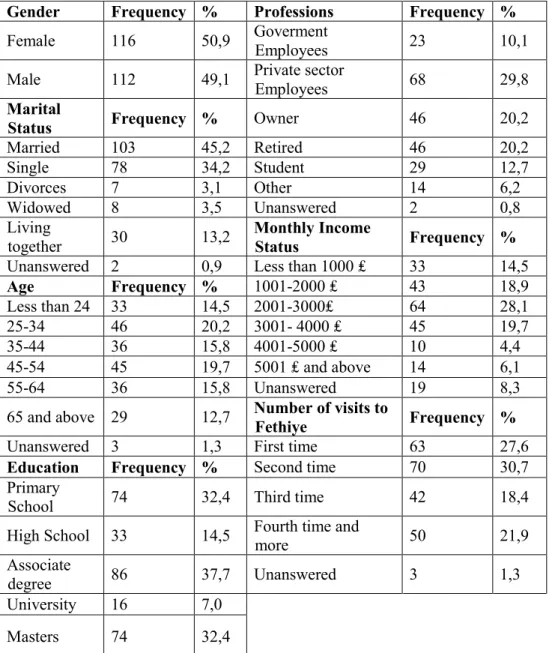
The distribution of the participants according to their demographic characteristics is shown on Table 1.
Table 1.Demographic Characteristics of Tourists
Gender Frequency % Professions Frequency %
Female 116 50,9 Goverment Employees 23 10,1 Male 112 49,1 Private sector Employees 68 29,8
Marital
Status Frequency % Owner 46 20,2
Married 103 45,2 Retired 46 20,2
Single 78 34,2 Student 29 12,7
Divorces 7 3,1 Other 14 6,2
Widowed 8 3,5 Unanswered 2 0,8
Living
together 30 13,2 Monthly Income Status Frequency %
Unanswered 2 0,9 Less than 1000 ₤ 33 14,5
Age Frequency % 1001-2000 ₤ 43 18,9 Less than 24 33 14,5 2001-3000₤ 64 28,1 25-34 46 20,2 3001- 4000 ₤ 45 19,7 35-44 36 15,8 4001-5000 ₤ 10 4,4 45-54 45 19,7 5001 ₤ and above 14 6,1 55-64 36 15,8 Unanswered 19 8,3
65 and above 29 12,7 Number of visits to Fethiye Frequency %
Unanswered 3 1,3 First time 63 27,6
Education Frequency % Second time 70 30,7
Primary
School 74 32,4 Third time 42 18,4
High School 33 14,5 Fourth time and more 50 21,9 Associate
degree 86 37,7 Unanswered 3 1,3
University 16 7,0
Masters 74 32,4
49
As seen on Table.1, research was carried out with 228 tourists who visited Fethiye. 50.9% of the sample were female, 49.1% were male. Among the participants, 20.2% were in the 25-34 age range, 19.7% were in the 45-54 age range, 15.8% were in the 35-44 age range, 15.8% were in the 55-64 age range, 14.5% were 24 and below, and 12.7% were 65 and above. Regarding their number of visits to Fethiye, 162 of them (71%) were repeating customers, 66 (29%) of them came for the first time. From here, it is observed that a great majority of the tourists coming to Fethiye have consciously been visiting the destination for multiple times.
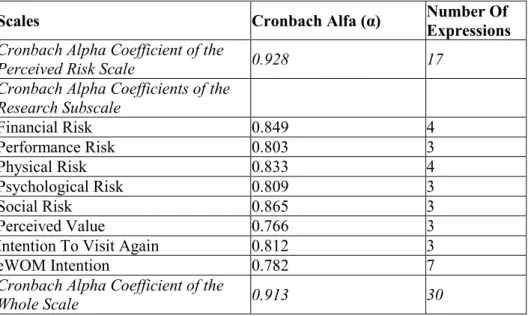
4.2. Cronbach Alpha Coefficients of Scales
The results of Cronbach Alpha coefficients of the whole scale and each subscale are presented in Table 1.
Table 1. Cronbach Alpha Coefficients of the Scale
Scales Cronbach Alfa (α) Number Of Expressions
Cronbach Alpha Coefficient of the
Perceived Risk Scale 0.928 17
Cronbach Alpha Coefficients of the Research Subscale Financial Risk 0.849 4 Performance Risk 0.803 3 Physical Risk 0.833 4 Psychological Risk 0.809 3 Social Risk 0.865 3 Perceived Value 0.766 3
Intention To Visit Again 0.812 3
eWOM Intention 0.782 7
Cronbach Alpha Coefficient of the
Whole Scale 0.913 30
In order to ensure the structural reliability and validity of the scale used in the study, Cronbach Alpha coefficients should be over 0.70 (Nunnally, 2010, Cronbach, 1951). However, in certain studies, it has been suggested that Cronbach Alpha coefficient of 0.60 and above can also be accepted (Choi and Siraykaya, 2005). In this context, Cronbach Alpha coefficients of each of the variables in Table 1 are larger than 0.70 and reliable.
50
4.3. Relationships Between Variables in The Model
Before testing the hypothesis based on the purpose of the study, it is necessary to establish the relations between variables. For this purpose, variables such as perceived risk, perceived value, intention to visit again and eWOM intention were subjected to correlation analysis as shown in Table 2.
Table 2. Arithmetic averages, standard deviation and correlation values of the model according to the first arrival tourist and repeating tourists
*p<0.001
According to Table 2, the relationship between variables is significant at 0.01. The correlation values in the study were above (r>0.85) and in the expected direction (Raykov and Marcoulides, 2006). Therefore, these significant relationships allow for analysis of the interaction between variables. In addition, the variable having the highest arithmetic mean of 4.38 is the intention to visit again, while the perceived risk is the variable with the lowest arithmetic mean of 3.55. There are similar arithmetic averages at the level of perceived risk between first-time tourists and repeating visitors, which is not significant for perceived value variables. In addition, it was observed that the arithmetical average of the previous tourists was higher than the perceived risk level.
4.4. Convergent-divergent validity
In order to determine whether the observed variables used in the study are representative of the latent structures to which they belong, the convergent-divergent validity is calculated. (Fornell and Larcker, 1981: 45).
Arithmetic Average of the number of tourists arriving for
the first time
Arithmetic Average of the number of Repeating tourists Arithmetic Average of the number of all tourists N (228) S.D. 1 2 3 4 1 Perceived Risk 3.57 3.53 3.55 0.74 1 2 Perceived Value 3.81 3.82 3.82 0.86 .29* 1
3 Intention To Visit Again 4.18 4.38 4.28 0.67 .21* .46* 1
51
In order to ensure convergent validity, the CR (composite reliability) value for each latent variable must be greater than 0.70 and the AVE value must be greater than 0.50. To ensure the divergent validity, the Maximum Shared Variance (MSV) should be smaller than the AVE value and the Maximum H Reliability (MaxR (H)) should be greater than the CR (composite Reliability) value (Hu and Bentler, 1999, Gaskin and Lim, 2016). In addition, the square root of the AVE value of a latent variable should be greater than the correlation value of that variable with other variables (Fornell and Larcker, 1981: 46).
Table 3. The Convergent-Divergent Validity Values of the Variables in the Model
CR AVE MSV MaxR(H) PR PV eWOM RVI
PR 0.903 0.653 0.091 0.926 0.808a
PV 0.805 0.579 0.298 0.806 0.301*** 0.761a
eWOM 0.837 0.569 0.185 0.911 0.182* 0.419*** 0.754a
RVI 0.818 0.601 0.298 0.827 0.277** 0.546*** 0.430*** 0.775a
PR=Perceived Risk, PV: Perceived Value, eWOM= eWOM, RI=Revisit Intention, CR=Composite Reliability, AVE= Average Variance Explained, MaxR(H)= Maximum H Reliability (Note: Cross values (a) are the square roots of AVE values)
Table 3 shows that the lowest AVE value calculated for latent variables is 0.569 and the lowest CR value calculated is 0.805. These results mean that convergent validity is provided for all latent variables in the measurement model. For the divergent validity, the MSV (maximum Shared Variance) value is less than the Average variance described in the AVE (Average variance Extracted, and MaxR(H) (maximum H reliability) value is greater than CR (Composite reliability). The correlation between variables and the square roots of the values of the AVE also provides the divergent validity for all latent variables.
4.5. Confirmatory factor analysis, second level CFA, measurement model and path analysis
In this study, confirmatory factor analysis was performed for financial, performance, physical, psychological and social risks that constitute the perceived risk variable. During confirmatory factor analysis, the factors (Financial Risk 1, Performance Risk 1, Performance Risk 4, Physical Risk 3, Physical Risk 1, Psychological Risk 1, Social Risk 1) that had the standardized values under 0.50 and that required the
52
utilization of high correction indexes were excluded from the analysis to improve the model. As a result of the first level confirmatory factor analysis, the results of the model in Table 4 were obtained. Accordingly, when the standardized values in the First Order CFA were examined, it was found that the factor loads of the latent variables were between 0.71-0.86 for financial risk, 0.80-0.91 for performance risk, 0.75-0.76 for physical risk, 0.67-0.85 for psychological risk, and 0.77-0.91 for social risk.
Table 4. First order CFA and second order CFA Values for detected risk components
First Order CFA Second Order CFA Scales and items Std. Loadings Critical Ratio
(C.R.) Std. Loadings Critical Ratio (C.R.) p Perceived Risk Financial
Risk - - 0.741 - 0.001 Performance Risk - - 0.790 8.938 0.001 Physical Risk - - 0.945 8.845 0.001 Psychological Risk - - 0.848 8.703 0.001 Social Risk - - 0.684 6.978 0.001
Financial Risk FinR3 0.863 - 0.883 - 0.001
FinR2 0.706 9.094 0.690 8.654 0.001
Performance
Risk PerR3 PerR2 0.910 0.804 - 12.975 0.800 0.914 - 12.360 0.001 0.001
Physical Risk PhyR4 0.761 - 0.767 - 0.001
PhyR2 0.750 10.492 0.743 10.326 0.001
Psychological
Risk PhyR3 PhyR2 0.847 0.669 - 9.377 0.825 0.686 - 9.156 0.001 0.001
Social Risk SocR2 0.906 - 0.785 - 0.001
SocR3 0.767 10.346 0.884 9.910 0.001 In order for a model to be considered as a holistic model in the context of structural equality modelling, it is necessary to evaluate some of the goodness of fit values (Schumacker and Lomax, 2004). Results revealed that model fulfilled the criteria suggested by Hu and Bentler (1999) and yielded an acceptable level of model fit, χ2(25) =56.429, Confirmatory Fit Index (CFI) =0.970, Goodness of Fit Index (GFI)= 0.954, Incremental Fit Index (IFI)= 0.971 and Square Error of
53
Approximation (RMSEA)= 0.074. In this context, it is observed that the relationships in the model are consistent with the sample data.
The perceived risk has five components and at least two expressions per component. In order to bring these five components into a single dimension, second level confirmatory factor analysis was performed. According to the results of second-level confirmatory factor analysis in Table 4, all t-values were greater than 2.56 and standardized values were greater than 0.50, meaning that all the variables were significant. The standardized values of the factors forming the Perceived Risk Component were 0.741 for Financial Risk, 0.790 for Performance Risk, 0.945 for Physical Risk, 0.848 for Psychological Risk and 0.684 for Social Risk. The second-level CFA results revealed that model fulfilled the criteria suggested by Hair et al. (2010) and yielded an acceptable level of model fit, χ2 (30) =84.288, confirmatory fit index (CFI) =0.949, Goodness of Fit Index (GFI)= 0.931, Incremental Fit Index (IFI)= 0.949 and Square Error of Approximation (RMSEA)= 0.08.
The relationship between the variables to be used in the research model, which are the perceived risk, the perceived value, the intention to visit again and the eWOM intention, was examined and whether the first condition of model creation was fulfilled was measured. According to the CFA analysis for the model, after extracting 3 questions with low standard values (eWOM 1, eWOM 2, eWOM 7), the remaining 20 items were loaded on their respective factors and the measurement model provided a good fit (χ2/df =2.29, GFI = 0.864, AGFI = 0.814, CFI = 0.904, IFI=0.905 and RMSEA = 0.075) (Schumacker and Lomax, 2004).
After verification of the measurement models, the relationships between the variables used in the study were tested through the structural model. In the context of structural model analysis, 4 different hypotheses were tested to determine the perceived value of perceived risk, the effect of perceived value on the revisit intentions and eWOM intentions, and the effect of eWOM intentions on the revisit intentions (Fig.).
54
Figure 3:Structural Model Results
When we look at the path diagram in Figure 3, It is seen that the perceived risk dimension has an effect on the perceived value of the perceived value on the intention to visit eWOM and again on the intention to visit again. However, it is observed that the ratio of variance to the perceived value dimension was 9.6% (R2=0.096), 17.7% (R2=0.177) and the ratio of variance for the eWOM intention was 35.0% (R2=0.350). In addition, the variance of the general model is 57%.
Table 5. Results of Hypothesis Tests
Hypotheses Structural Path Std. Loading t p
H1 PR PV 0.310 3.764 0.001***
H2 PV RVI 0.456 4.665 0.001***
H3 PV eWOM 0.421 4.866 0.001***
H4 eWOM RVI 0.232 2.677 0.007**
Model fit: χ2/df = 2.27, GFI = 0.864, AGFI = 0.816, IFI = 0.906, CFI = 0.904, RMSEA = 0.075. ***p<0.001, ** p<0.01 0.310*** R'=O,[O Pen,ei<ed Vaine 0.42 *** R'=0,35 0.232** R'=O,[S
55
When the data in Table 5 were examined, it was found that the t value between the intention of eWOM and the intention of revisit was greater than 2.56 but significant at the significance level of 0.007. Moreover, it appears that all t-values outside this are greater than 2.56 and at a significance level of 0.001. At this point, it was determined that the relations between all variables are meaningful. Again, for the overall significance of the structural model, the goodness-of-fit values in Table 5 appear to be within acceptable limits of fit.
When the results of the structural model in Figure 3 and the results of the hypotheses in Table 5 are analysed together, it can be seen that the perceived risk factor have a positive and significant effect on perceived factor (H1: β=0.310, t=3.764, p=0.001). It was found that the perceived
value factor had positive and significant effects on the intention to visit again and the intention of eWOM (H2: β=0.456, t=4.665, p=0.001; H3:
β=0.421, t=4.866, p=0.001). Finally, it was determined that the intention of eWOM had a positive and significant effect on the intention to visit again (H4: β=0.232, t=2.667, p=0.007). Therefore, all hypotheses formed
in the direction of the purpose of the study have been accepted.
5. Discussion and Conclusion
Based on the literature review, four hypotheses were developed in this study which aimed to identify the relationship between perceived risk, perceived value, eWOM dissemination and revisit intention variables for tourism destinations, and all of these hypotheses were accepted as the result of analysis.
According to research findings, the perceived value of a destination increases the intention to revisit that destination. This finding overlaps with numerous studies in the literature, such as Allameh et al., 2015; Oh, 1999; Um et al., 2006; Raza et al. 2012. Considering the positive impact of revisit rates on the competitiveness of destinations with these findings, it is clear that the high value attributed to a destination will contribute to the competitive advantage of that destination.
At the same time, according to research findings, the value perceived by tourists towards destination increases their intention to disseminate eWOM messages related to this destination. This finding coincides with Oh (1999)’s research findings and is important for marketers who want their destinations to appear more in the social media. It is also observed that the intention to spread the eWOM on a destination is increasing the intention to revisit the destination. This finding shows that the perceived value has an indirect effect on the reversal induction
56
and overlaps with Bulut & Karabulut (2018)’s study, which referred to the effect of eWOM propagation behaviour on loyalty.
In addition to these findings, which overlap with the literature, the perceived level of risk associated with tourism destinations has also been observed to increase the perceived value of the visited destination. This is a remarkable finding because the perceived risk is a concept that mostly has negative effects on the perceived value in the consumer behaviour literature. However, current research findings show that the perceived risk has a positive effect on the value perceived by the consumer towards a destination he/she visited.
It is thought that this situation, which appears to be a contradiction at first glance, can be caused by three different reasons. First, the tourists' perceived value of destination contains a utilitarian value rather than a hedonic value. According to the findings of the study of Chiu et al. (2014), hedonic value, (adventure, gratification, role, best deal, social, idea benefits), is positively affected by perceived risk.
Secondly, it is possible that the risks that tourists perceive before they visit any destination are decreasing their expectations for the destination they are going to visit, and that the experience they have during the visit become more valuable. This probability indicates the negative relationship between consumer expectations and consumer satisfaction prescribed by Expectation Confirmation Theory.
The third is the possibility that a general risk perception for tourism destinations, including destinations that have never been visited, is increasing the perceived value of a destination that has been visited before. In other words, it is likely that tourists value a destination that they have visited before, more than any destination that they have not experienced. In this third case, tourists who have visited a destination before (repeating) are expected to perceive more value than those who have visited it for the first time.
However, it is observed that those who have visited Fethiye before and those who have visited Fethiye for the first time are very close to each other (without constituting any significance) compared to the arithmetical averages of perceived risk and perceived value variables. According to these findings, this third possibility is not to be mentioned, and the first two possibilities are strengthened.
Undoubtedly, in order to defend the existence of this finding, which is seen in the literature, and to explain the reasons, new studies should be
57
carried out using different places, time and samples. It is hoped that this study will provide a different perspective and motivation for future studies on similar issues.
References
Abubakar, A.M. (2016), “Does eWOM influence destination trust and travel intention: a medical tourism perspective,” Economic Research-Ekonomska Istraživanja, 29, 1, 598-611.
Akyüz, A. (2013), “Determinant factors influencing e-WOM,”
Mediterranean Journal of Social Sciences, 4, 159-166.
Allameh, S. M., Khazaei Pool, J., Jaberi, A., Salehzadeh, R., & Asadi, H. (2015), Factors influencing sport tourists’ revisit intentions: The role and effect of destination image, perceived quality, perceived value and satisfaction. Asia Pacific Journal of Marketing and
Logistics, 27(2), 191-207.
Arndt, J. (1967), “Role of product-related conversations in the diffusion of a new product,” Journal of Marketing Research, 4, 291-295.
Aven, T., Renn. O. (2009), On risk defined as an event where the outcome is uncertain, Journal of Risk Research, 12:1, 1-11.
Aydın, B.O. (2014), Electronic Word-Of-Mouth: An Analysis Of Consumer Motivations, Selçuk Univers,ty Journal of Institute of Social Sciences, 32, 13-25.
Başanbaş, Ş. (2012), A Research On Perceived Quality, Satisfaction and Loyalty Relatıonshıp In Automotive Supplier Industry, Journal of Marketing and Marketing Research, 10, 15-39.
Bauer, R.A. (1960), “Consumer behavior as risk taking,” in
Dynamic marketing for a changing world, R.S. Hancock, ed. Chicago:
American Marketing Association, 389-398.
Bauer, R.A. (1967), Risk Taking and Information Handling in
Consumer Behavior, Graduate School of Business
Administration, Harvard University, Boston, MA, pp. 23-33.
Bulut, Z. A., & Karabulut, A. N. (2018), Examining the role of two aspects of eWOM in online repurchase intention: An integrated trust– loyalty perspective. Journal of Consumer Behaviour,17(4), 407-417.
58
Chen, C-H., Nguyen, B., Klaus, P. & Wu, M-S. (2014), Exploring Electronic Word-of-Mouth (eWOM) in The Consumer Purchase Decision-Making Process: The Case of Online Holidays – Evidence from United Kingdom (UK) Consumers, Journal of Travel & Tourism Marketing, 32:8, 953-970.
Chen, Z., & Dubinsky, A. J. (2003), A Conceptual Model Of Perceived Customer Value in E‐Commerce: A Preliminary Investigation. Psychology & Marketing, 20(4), 323-347.
Chew, E.Y.T. & Jahari, S.A. (2014), Destination Image As A Mediator Between Perceived Risks And Revisit Intention: A Case Of Post-Disaster Japan, Tourism Management, 40, 382-393.
Chiu, C. M., Wang, E. T., Fang, Y. H., & Huang, H. Y. (2014), Understanding customers' repeat purchase intentions in B2C e‐ commerce: the roles of utilitarian value, hedonic value and perceived risk. Information Systems Journal, 24(1), 85-114.
Choi, H.S. ve Sırakaya, E. (2005), Measuring Residents’ Attitude toward Sustainable Tourism: Development of Sustainable Tourism Attitude Scale. Journal of Tourism Research, 43, 380-394.
Clemes, M. D., Wu, J. H. C., Hu, B. D., and Gan, C. (2009), “An Empirical Study of Behavioral Intentions in the Taiwan Hotel Industry”.
Innovative Marketing, 5(3): 30-50.
Clow, K. E. & Baack, D. (2016), Integrated Advertising, Promotion and Marketing Communications (7th Edition), Pearson Education, London.
Cronbach, L.J. (1951), Coefficient alpha and the internal structure of tests. Psychometrika 16 (3), 297–334
Cox, D.F., Rich, S.U., (1964), Perceived Risk and Consumer Decision-Making: The Case of Telephone Shopping, Journal of
Marketing Research: 1 (4), ss. 32 – 39.
Çetinsöz, B. C., Ege, Z. (2012), Risk Reduction Strategies According to Demographic Features of Tourists: The Case of Alanya, Anatolia Turizm Araştırmaları Dergisi, 23 (2), 159 – 172.
Del Bosque, I. R., San Martin, H. Collado, J. & Salmones, M.M.G.I. (2009), A Framework for Tourist Expectations, International Journal Of Culture, Tourism And Hospitality Research, 3 (2), 139-147.
59
Di Pietro, L., Di Virgilio, F., Pantano, E. (2012), Social network for the choice of tourist destination: attitude and behavioural intention, Journal of Hospitality and Tourism Technology, 3 (1), 60-76.
Eggert, A., & Ulaga, W. (2002), Customer perceived value: a substitute for satisfaction in business markets?. Journal of Business &
industrial marketing, 17(2/3), 107-118.
Erdoğan, E., Aksoy, R. (2013), The Impact Of Consumers' Perceived Risk On The Perceived Service Quality In Services, International Journal Of Economic And Social Research, 9, 2, 9, 121-150.
Fornell, C. and Larcker, D. F. (1981), “Evaluating Structural Equation Models with Unobservable Variables and Measurement Error”.
Journal of Marketing Research, 18(1): 39-50.
Fotis, J., Buhalis, D. & Rossides, N. (2012), Social media use amd impact during the holiday travel planning process, In: Fuchs, M., Ricci, F. and Cantoni, L., eds. Information and Communication Technologies in Tourism, Springer-Verlag, Vienna, pp. 13-24.
Fuchs, G. & Reichel, A. (2011), An exploratory inquiry into destination risk perceptions and risk reduction strategies of first time vs. repeat visitors to a highly volatile destination, Tourism Management, 32, 2, 266-276.
Fyall, A., Garrod, B. & Wang, Y. (2012), Destination collaboration: A critical review of theoretical approaches to a multi-dimensional phenomenon, Journal of Destination Marketing & Management, 1, 1-2, 10-26.
Gaskin, J. and Lim, J. (2016), "Master Validity Tool", AMOS Plugin. Gaskination's StatWiki.
Gomezelj, D.O. & Mihalic, T. (2008), Destination Competitiveness, Tourism Management, 29, 2, 294-307.
Güler, M.E., Saribaş, Ö. and Kömürcü, S. (2018). Akdeniz Çanağı Ülkelerinin Turizm Bakanlıklarının Web Sayfalarına İlişkin Bir Değerlendirme, III. Uluslararasi Doğuakdeniz Turizm Sempozyumu, Iskenderun, Nisan 20-21.
60
Hair, J., Black, W., Babin, B., and Anderson, R. (2010), Multivariate data analysis (7th ed.): Prentice-Hall, Inc. Upper Saddle River, NJ, USA.
Hsu, C-L., Lin & J. C-C. (2015), What drives purchase intention for paid mobile apps? – An expectation confirmation model with perceived value, Electronic Commerce Research and Applications, 14, 46–57.
Hu, L. ve Bentler P. M. (1999), “Cut Off Criteria For Fit Indexes In Covariance Structure Analysis: Conventional Criteria Versus New Alternatives”. Structural Equation Modeling: A Multidisciplinary
Journal, 6(1): 1-55.
Jakobsen, J.K.S. & Munar, A.M. (2012), Tourist information search and destination choice in a digital age, Tourism Management Perspectives, 1, 39-47.
Jalilvand, M. R., Samiei, N., Dini, B. & Manzari, P.R. (2012), Examining the structural relationships of electronic word of mouth, destination image, tourist attitude toward destination and travel intention: An integrated approach, Journal of Destination Marketing & Management, 1, 134–143.
Karabulut, A. N. (2013), Measurement of Tendency of Consumers to Make Shopping via Internet Against Perceived Variable of Risk: Prospect Theory Against Expected Utility Theory, Journal Of Yasar University, 8 (32), 5515-5536.
Karamustafa, K., Erbaş, E. (2011), Perceived Risk in Buying Decision Process: A Research on Package Tours, Journal of Consumer and Consumption Research, 3(1), 103-144.
Karatepe, O. M. and Ekiz, H. E. (2004), “The effects of organizational responses to complaint on satisfaction and loyalty: a study of hotel guests in Northern Cyprus”, Managing Service Quality, 14(6): 476-486.
Karl, M. & Schmude, J. (2017), Understanding the role of risk (perception) indestination choice: A literature review and synthesis,
Turizam: međunarodni znanstveno-stručni časopis, 65 (2), 138-155.
Kahneman, D. & Tversky, A. (1979), Prospect Theory: An Analysis of Decision under Risk, Econometrica: 47 (2), 263 – 292.
61
Kline, R. B. (2011), Principles And Practice Of Structual Equation Modeling, Third Edition, The Guil XYZ Press, New York, USA.
Koç, E. (2016), Tüketici Davranışı ve Pazarlama Stratejileri: Global ve Yerel Yaklaşım, Seçkin Publication, Ankara.
Kutluk, A., Arpacı, Ö. (2016), Investigation of E-complaints with Grounded Theory and Content Analysis towards Travel Agencies in the Context of E-wom, Balıkesir University The Journal of Social Sciences Institute: 19 (35), 367-385.
Lee, Y-C. (2014), Impacts of decision-making biases on eWOM retrust and risk-reducing strategies, Computers in Human Behavior, 40, 101–110.
Lepp, A., Gibson, H. & Lane, C. (2011), Image and perceived risk: A study of Uganda and its official tourism website, Tourism Management, 32, 3, 675-684.
Lim, N. (2003), Consumers’ perceived risk: sources versus consequences, Electronic Commerce Research and Applications, 2, 216– 228.
Lopez, M. & Sicilia, M. (2013), Determinants of E-WOM Influence: The Role of Consumers’ Internet Experience, Journal of Theoretical and Applied Electronic Commerce Research, 9 (1), 28-43.
Mitchell, A. C. (2016), Changes in Perceptions of Service Quality Corresponding to Population Growth, International Journal Advances in Social Science and Humanities, 4 (1), 62 – 69.
Mitchell, V-W. (1999), Consumer Perceived Risk: Conceptualisations and Models, European Journal of Marketing: 33 (1/2), 163 – 195.
Nadiri, H., Hussain, K., Ekiz, E. H. ve Erdoğan, Ş.(2008), "An investigation on the factors influencing passengers' loyalty in the North Cyprus national airline", The TQM Journal, 20(3): 265-280.
Nunnally, J.C., (2010), Psychometric Theory 3rd Edition, Tata McGraw-Hill Education.
Oh, H. (1999), Service quality, customer satisfaction, and customer value: A holistic perspective. International Journal of Hospitality
62
Oliver, R. L. (1980), A cognitive model of the antecedents and consequences of satisfaction decisions, Journal of marketing research, 17(4), 460-469.
Onaran, B., Bulut, Z.A. & Özmen, A. (2013), A Study to Investigate the Effect of Customer Value on Customer Satisfaction, Brand Loyalty and Customer Relationship Management Performance, Business and Economics Research Journal, 4 (2), 37-53.
Raykov, T. ve Marcoulides, A. G. (2006), A First Course in
Structural Equation Modeling. 2th Ed, Lawrence Erlbaum Inc., New
Jersey, USA.
Raza, M. A., Siddiquei, A. N., Awan, H. M., & Bukhari, K. (2012), Relationship between service quality, perceived value, satisfaction and revisit intention in hotel industry. Interdisciplinary journal of
contemporary research in business, 4(8), 788-805.
Ryu, K., Han, H., and Kim, T. H. (2008), “The Relationships among Overall Quick-Casual Restaurant Image, Perceived Value, Customer Satisfaction and Behavioral Intentions”. International Journal
of Hospitality Management, 27, 459-469.
Sarıbaş, Ö., Kömürcü, S. and Güler, M.E. (2017). “Visual Sense of the Cities and the Impact on Tourism: Case of Izmir”. International
Journal of Social Sciences and Humanity Studies, 9(1), 202-214.
Sarıbaş, Ö. and Öter, Z. (2013). Risk as a Motivation in Adventure Tourism and its Use in Terms of Tourism Marketing, 8th Silk Road International Conference, Tbilisi - Batumi, Georgia, May 24-26.
Schumacker, R. E. & Lomax, R.G. (2004), Beginner’s guide to structural equaiton modeling, Lawrence Erlbaum Associates, New Jersey, USA.
Sharifpour, M., Walters, G., Ritchie, B.W. & Winter C. (2014), Investigating the Role of Prior Knowledge in Tourist Decision Making: A Structural Equation Model of Risk Perceptions and Information Search, Journal of Travel Research, 53, 3, 307-322.
Şimşek, Ö. F. (2007), Yapısal Eşitlik Modellemesine Giriş (Temel
İlkeler ve LISREL Uygulamaları). Ekinoks Publishing, Ankara.
Sundaram, D. S., Mitra, K., Webster, C. (1998), Word-of-Mouth Communications: A Motivational Analysis, Advances in Consumer Research,25, 527-531.
63
Sweeney J.C., Soutar, G.N., Johnson, L.W. (1999), The Role of Perceived Risk in the Quality – Value Relationship: A Study in a Retail Environment, Journal of Retailing: 75(1), 77–105.
Tavitiyaman, P. & Qu, H. (2013), Destination Image and Behavior Intention of Travelers to Thailand: the Moderating Effect of Perceived Risk, Journal of Travel & Tourism Management, 30, 3, 169-185.
Taylor, J.W. (1974), The Role of Risk in Consumer Behavior,
Journal of Marketing, 38 (2), ss. 54 – 60.
Tham A., Croy, G. & Mair, J. (2013), Social Media in Destination Choice: Distinctive Electronic Word-of-Mouth Dimensions, Journal of Travel & Tourism Marketing, 30:1-2, 144-155.
Tsanakas, A., and E. Desli (2003), “Risk measures and theories of choice,” British Actuarial Journal, 9, 959-991.
Tsiros, M., Heilman, C.M. (2005), The Effect of Expiration Dates and Perceived Risk on Purchasing Behavior in Grocery Store Perishable Categories, Journal of Marketing: 69 (2), 114 – 129.
Um, S., Chon, K., & Ro, Y. (2006), Antecedents of revisit intention. Annals of tourism research, 33(4), 1141-1158.
Wu, L. Y., Chen, K. Y., Chen, P. Y., & Cheng, S. L. (2014), Perceived value, transaction cost, and repurchase-intention in online shopping: A relational exchange perspective. Journal of Business
Research, 67(1), 2768-2776.
Yeniçeri, T., Yaraş E., Akın, E. (2012) , Tüketicilerin Riskten Kaçınma Düzeylerine Göre Sanal Alışveriş Risk Algısı Ve Sanal Plansız Tüketim Eğilimlerinin Belirlenmesi, International Journal of Economic
and Administrative Studies: 9, ss. 145 – 164.
Yuksel. A. and Yuksel, F. (2008), “Consumer satisfaction theories: a critical review”, in Yuksel, A. (Ed.), Tourist Satisfaction and Complaining Behavior: Measurement and Management Issues, Nova Science Publications Inc, New York, NY, 65-88.
Zhu, M., Lai, S. (2009), A Study About The EWOM Influence on Tourism Destination Choice, International Conference on Electronic Commerce and Business Intelligence (ECBI), Bejing June 6-7.