22
Chapter 2
DOI: 10.4018/978-1-5225-5149-2.ch002
ABSTRACT
The use of machine learning techniques for medical diagnosis has become increasingly common in recent years because, most importantly, the computer-aided diagnostic systems developed for supporting the experts have provided effective results. The authors aim in this chapter to improve the performance of classification in computer-aided medical diagnosis. Within the scope of the study, experiments have been performed on three different datasets, which include heart disease, hepatitis, and BUPA liver disorders datasets. First, all features obtained from these datasets were converted into complex-valued number format using phase encoding method. After complex-valued feature set was obtained, these features were then classified by an ensemble of complex-valued radial basis function (ECVRBF) method. In order to
test the performance and the effectiveness of the medical diagnostic system, ROC analysis, classification accuracy, specificity, sensitivity, kappa statistic value, and f-measure were used. Experimental results show that the developed system gives better results compared to other methods described in the literature. The proposed method can then serve as a useful decision support system for medical diagnosis.
A Medical Decision Support
System Based on Ensemble
of Complex-Valued Radial
Basis Function Networks
Musa Peker
Muğla Sıtkı Koçman University, Turkey
Hüseyin Gürüler
Muğla Sıtkı Koçman University, Turkey
Ayhan İstanbullu
INTRODUCTION
In medical diagnostics, diagnosis of a disease is performed with considering patient’s data. However, the increase in the data density and the excessive number of symptoms affecting the disease complicate diagnostic procedures. Amongst one of the most popular topics to emerge in recent years is the use of computers in medical diagnostic. Computer-aided medical diagnostic systems have been developed to help specialists, with such systems aiming to minimising the physician error. Computer-aided classification systems can minimise the potential errors. In addition, these systems facilitate and accelerate in-depth examination of medical data (Cheung, 2001; Das, 2010).
In order to test the effectiveness of newly developed computer-aided medical diagnostic systems, researchers are conducting experiments on datasets that are open to common use. The hybrid method proposed in this study has been tested with three datasets. Those are Statlog heart disease, BUPA liver disorders, and Hepatitis datasets, which are obtained from the UCI machine learning repository (Bache & Lichman, 2013). The common characteristic of these datasets is having a distribution which cannot be separated linearly. There is also a large amount of missing data on the Hepatitis dataset. Information about some of the earlier studies carried out on these datasets is given below.
In the literature, some studies performed on the Statlog heart disease dataset are as follows: Based on many attempts, Cheung (2001) has achieved the highest classification accuracy (81.48%) using the Naive Bayes algorithm among a number of other classification algorithms. Kahramanli and Allahverdi (2008) have achieved 86.8% accuracy rate by using a fuzzy neural network algorithm. Das et al. (2009) have developed an ensemble algorithm which includes three neural networks and an 89.01% classification accuracy has been obtained with the proposed model. Subbulakshmi et al. (2012) have achieved an 87.50% classification accuracy by using the extreme learning machine (ELM) method. Karabulut and Ibrikci (2012) have developed a method based on a rotation forest algorithm, and a 91.20% classification accuracy has been obtained with the proposed method.
In the literature, some studies that have been carried out on the Hepatitis dataset are as follows: Javad et al. (2012) have developed a hybrid method (SVM-SA) which includes SVM and simulated annealing (SA) algorithms. They have obtained a 96.25% accuracy rate. Shao et al. (2015) have proposed a weighted linear loss twin SVM for large-scale classification. They have obtained an 84.99% accuracy rate with the method. Aldape-Pérez et al. (2012) have developed a novel method referred to as an associative memory based classifier (AMBC) and an 85.16% classification accuracy has been obtained. Bashir et al. (2016) have developed an ensemble method
with multi-layer classification using optimized weighting and enhanced bagging, and an 87.04% classification accuracy has been obtained with the method which is entitled HM-BagMoov.
In the literature, some studies have been carried out on the BUPA liver disorder dataset for the identification of liver disorders as follows: Goncalves et al. (2006) have developed a new neuro-fuzzy method entitled the inverted hierarchical neuro-fuzzy BSP System (HNFB). A 73.33% classification accuracy has been obtained using this method. Jin et al. (2007) have proposed a genetic fuzzy feature transformation method for SVMs. They have achieved a 70.80% accuracy rate. Lee and Mangasarian (2001) have developed smooth SVMs (SSVM) and reduced SVMs (RSVM) classifier methods. Using these methods, they have achieved 70.3% and 74.8% accuracy rates, respectively. Chen et al. (2012) have developed a hybrid method in which the 1-NN method and particle swarm optimization (PSO) are used together. A 68.99% classification accuracy has been obtained with the proposed hybrid method. Dehuri et al. (2012) have developed an enhanced PSO-based evolutionary functional link neural network (ISO-FLANN). A 76.8% classification accuracy has been achieved with the method. Shaoa and Deng (2012) have developed a coordinate descent margin based-twin SVM. They have obtained 73.67% classification accuracy with the method. Savitha et al. (2012) have developed a fully complex-valued radial basis function (FC-RBF) network. A 74.6% accuracy rate has been achieved with the proposed method. Mantas and Abellán(2014) have developed an algorithm entitled Credal-C4.5. A 64.53% classification accuracy has been achieved with the Credal-C4.5 method which involves a decision tree based on imprecise probabilities. López et al. (2014) have developed an SVM based method. In this method, a multivariate normalization algorithm was used to train the SVM algorithm. A 72.17% classification accuracy has been achieved with the method.
Recently, the use of complex-valued classifiers for real-valued classification problems is one of the most important research topics (Savitha, Suresh & Sundararajan, 2012; Amin, Islam & Murase, 2009). Complex-valued classifiers have been utilised in the classification stage of many studies, since they provide good results (Peker, 2016; Savitha, Suresh &Sundararajan, 2012; Amin & Murase, 2009; Amin, Islam & Murase, 2009; Li, Huang, Saratchandran & Sundararajan, 2006; Chen, Mclaughlin & Mulgrew, 1994). In this study, a new hybrid method, an ensemble version of a complex-valued radial basis function algorithm has been developed. Bagging and boosting methods have been used as an ensemble algorithm. We believe that the proposed method provides an important contribution to the literature relating to complex-valued classifiers.
The rest of the paper is organized as follows. In Section Materials and Methods, information is presented about the datasets and methods used in the study. The
experimental results and discussion section is given in Section Experimental Results and Discussions. In addition, a comparison with the existing methods in the literature have been carried out in this section. General information about the obtained results is presented in Section Conclusion.
MATERIALS AND METHODS
Data Description
Studies have been carried out on three different datasets in order to evaluate the success of the proposed method. The datasets have been taken from the UCI Machine Learning Repository (Bache & Lichman, 2013). These datasets are related to heart, Hepatitis, and liver disorders. The Statlog heart disease dataset relates to 270 people (Bache & Lichman, 2013). The data of 120 of these relate to healthy individuals and 150 relate to patients. The features of this dataset have been presented in Table 1.
The Hepatitis disease dataset was donated by the Jozef Stefan Institute in Slovenia (Bache & Lichman, 2013). The dataset is used to estimate the existence or absence of Hepatitis, based on different medical tests carried out on a patient. The dataset is comprised of 155 samples with 19 features. Target features have been coded as 1 for survivors (123) and 0 for the patients who died (32). Approximately 48.30% of the dataset contains missing value. Features in the dataset have been presented in Table 2.
The BUPA liver disorders dataset contains 345 samples with 6 features and two classes (Bache & Lichman, 2013). Samples are all unmarried men. 200 of these
Table 1. The features of the Statlog heart dataset
ID Feature ID Feature
1 Age 8 Maximum heart rate achieved
2 Sex 9 Exercise induced angina
3 Chest pain type (four values) 10 Old peak = ST depression induced by exercise relative to rest 4 Resting blood pressure 11 The slope of the peak exercise ST segment
5 Serum cholesterol in mg/dl 12 Number of major vessels (0–3) colored by fluoroscopy 6 Fasting blood sugar >120 mg/dl 13 Thal: 3 = normal; 6 = fixed defect and 7 = reversible defect 7 Resting electrocardiographic results (values 0, 1 and 2)
data have been taken from healthy people with no liver disorder. The remaining 145 samples have been obtained from individuals with liver disorder. Five features are blood test results and daily alcohol consumption. Features in the dataset are presented in Table 3.
Table 2. The features of the Hepatitis disease dataset
Feature Number Feature Description Values
1 Age 10, 20, 30, 40, 50, 60, 70, 80
2 Sex Male, Female
3 Steroid No, Yes
4 Antivirals No, Yes
5 Fatigue No, Yes
6 Malaise No, Yes
7 Anorexia No, Yes
8 Liver Big No, Yes
9 Liver Firm No, Yes
10 Spleen Palpable No, Yes
11 Spiders No, Yes
12 Ascites No, Yes
13 Varices No, Yes
14 Bilirubin 0.39, 0.80, 1.20, 2.00, 3.00, 4.00
15 Alk Phosphate 33, 80, 120, 160, 200, 250
16 Sgot 13, 100, 200, 300, 400, 500
17 Albumin 2.1, 3.0, 3.8, 4.5, 5.0, 6.0
18 Protime 10, 20, 30, 40, 50, 60, 70, 80, 90
19 Histology No, Yes
Table 3. The features of the BUPA liver disorder dataset.
Feature Number Feature Description Values
1 MCV (mean corpuscular volume) Numeric value
2 Alkphos (alkaline phosphatase) Numeric value
3 SGPT (alanine aminotransferase) Numeric value
4 SGOT (aspartate aminotransferase) Numeric value
5 Gamma GT (gamma-glutamyltranspeptidase) Numeric value
Complex-Valued Radial Basis Function Networks (CVRBF)
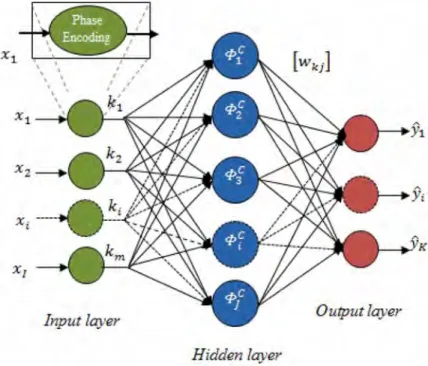
CVRBF was first proposed by Chen et al. (1994). Initially, it was applied to a non-linear signal processing, which includes complex signals. After this, it was used in different classification problems which have complex and real-valued input features (Chen et al., 2008; Babu, Suresh & Savitha, 2012; Savitha, Suresh & Sundararajan, 2012). CVRBF is the complex-valued version of the real-valued RBF neural network. It is structurally similar to the RBF neural network except that the parameters are complex-valued here. The CVRBF sample with a single hidden layer is given in Figure 1.
A complex-valued input data can be represented as shown in Equation (1). Here, the input value is composed of real and imaginary values.
xC x ix
R I
= + (1)
where i = −1 . xCis the complex input value, x
R is the real value and xl is the imaginary value. Real-valued feature values in the input layer are normalized between the range of [0, 1] at the initial phase. Normalisation formula has been given in Equation (2).
Figure 1. Structure of the CVRBF classifier
Input layer Output layer
x x x x x i C i min max min = − − ( ) ( ) ( ) (2)
where xi is the input value. x( )min is the minimum and x(max) is the maximum value. At this stage, as can be seen in the attached small picture in Figure 1, normalised values are converted to complex space with phase encoding [0, π] by using the equation ‘exp i x
( )
π ’. The phase encoding method, which assures the conversion of real-valued input values to complex valued number format, has been given in Equation (3). aiC exp i x i C =(
π)
(3) where xiC is the real-valued input feature normalised between the range of [0, 1].
aiCis the complex-valued input feature calculated based on x i C.
The example has been given in Figure 1 is a hidden layer with CVRBF structure. The CVRBF has ‘ j ’ hidden neurons. These hidden neurons in the hidden layer have a real radially symmetric response around the node centre. The centres of hidden nodes are some of the complex vectors in the input domain. The non-linearity of hidden node is a real function. Equation (4) is used to determine the response of each hidden node.
ΦCj j i C j C H i C j C exp a c a c = −
(
−)
(
−)
1 2 σ (4)where
σ
j is the width of Gaussian function.a
iC representsi
th complex-valuedinput vector.
c
Cj is the complex-valued centre of gravity of jth Gaussian CVRBF.• •
*
( )
H =( )
T operator is the Hermitian operation. •( )
Tindicates vector or matrix transpose, while •( )
* indicates complex conjugate.The output value of each output neuron is computed as the linear total of weights from the hidden layer to the output layer and the response of each hidden layer neuron. In the study, weights are real-valued in the CVRBF neural network. The response of output neurons is also real-valued. Equation (5) is used for the response of the output neuron.
yk w w exp a c a c j J kj j C j J kj j i C j C H i C j C = = −
(
−)
(
−)
= =∑
∑
1 1 2 1 Φ σ (5)where wkj is linkage value between k th output neuron and j th hidden neuron. φj C is the radial basis function of the j th hidden node.
The error function is given in Equation (6) for CVRBF.
e=eR +ieI =yt − ˆyt (6)
where eR and eI are respectively real and complex components of complex-valued error value e , ˆyt is the calculated output value and yt is the real output value. In this study, the mean squared error has been used as the error function. The error function is defined as Equation (7).
E e e t N tH t =
( )
=∑
1 2 1 (7)whereH denotes the complex Hermitian operator. To minimise the deviations of the mean squared error, a gradient descent-based learning algorithm has been used. Updating rules based on this learning algorithm are as follows.
∆vkj = µv k he yj; k =1 2, , ,… n; j =1 2, , ,…h (8) ∆σ µ σ σ j h j k n kj R k R kj I k I j j y v e v e z c =
(
+)
− =∑
1 2 3 . (9) ∆cj c hyj k v e re z c iv e im z c n kj R k R j kj I k I j j =(
−)
+(
−)
=∑
µ σ 1 22 (10)where µv, µc and µσ are, respectively, the learning rate parameters for weight, centre and width of Gaussian function. vkj
Randv kj
I are, respectively, the real and imaginary components of
v
kj weight value.Ensemble of CVRBF
When ensemble learning methods are used, a single decision is made for the ensemble by gathering the results revealed by multiple classifiers. These methods put the class estimations made by the many different classifiers through voting. As a result of this voting, the best rated class is then presented as class estimation of the ensemble.
Ensemble learning methods increase the accuracy rate of predictions revealed by basic or singular learning algorithms and, for this reason, they are usually more successful than singular/individual learning methods. Bagging and Boosting are the most known and studied ensemble learning algorithms amongst them (Breiman, 1996; Freund & Schapire, 1997). In this study, these two methods are used for the ensemble version of CVRBF algorithm. The ensemble of CVRBF is named as ECVRBF.
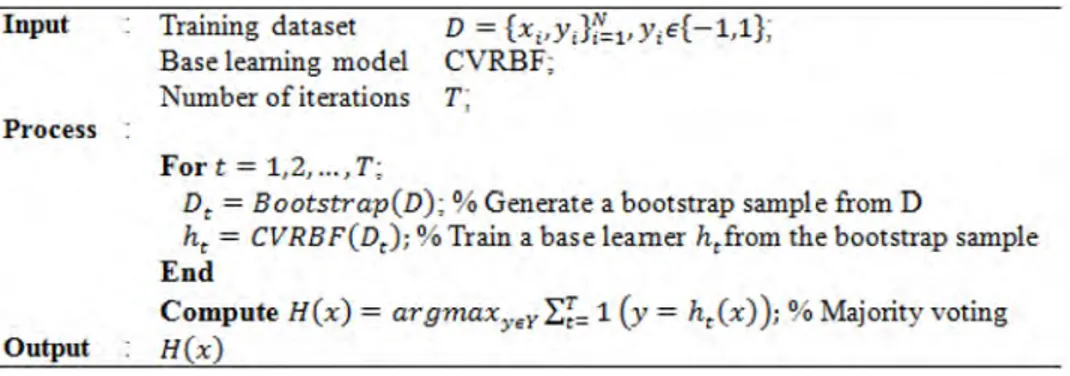
Bagging is basically a bootstrap ensemble algorithm (Das & Sengur, 2010). The bootstrap element ensures separation during training using copies of a dataset. In other words, it means extracting and using data subsets of the dataset by relocation. Each data subset is used in the training of CVRBF. The trained CVRBFs compose an ensemble. The real result is obtained based on an absolute majority of the results of the algorithm. Bagging is simple but powerful ensemble method recommended for improving the stability and accuracy of learning algorithms (Das, Turkoglu & Sengur, 2009). The pseudo-code for the CVRBF ensemble with the Bagging algorithm is given in Figure 2.
In Boosting, as in Bagging, each CVRBF is trained on a different bootstrap sample. However, in Boosting, the existing CVRBF focuses more on previously misclassified data points. A typical application of the Boosting method is the AdaBoost method (Freund & Schapire, 1997). In the AdaBoost method, classification is usually performed by aggregating CVRBFs via weighted voting with the weight
Figure 2. The bagging algorithm for ECVRBF
Input Process Output Training dataset Base learning model Number of iterations Fort= 1,2, ... , T; D
=
{x,,y,}f'=1, Y;E{-1,1}; CVRBF; T;Dt
=
Bootstrap(D)~ % Generate a bootstrap sample from Dht
=
CVRBF(D<); % Train a base learner htfrom the bootstrap sample EndCompute H(x) = argmaxyeY ~ = 1
(y
= ht(x) ); % Majority voting H(x)in the formula. The pseudo-code for the CVRBF ensemble with Boosting algorithm is given in Figure 3.
The Proposed Method
In the initial step, features were converted into a complex number format using the phase encoding method. The features obtained have been classified by the ensemble of the CVRBF algorithm. The block diagrams of the proposed method based on Bagging and Boosting ensemble learning algorithm are given in Figures 4 and 5, respectively.
EXPERIMENTAL RESULTS AND DISCUSSIONS
All experiments were performed under MATLAB environment using a computer with an Intel(R) Core™ i7-2670QM (2.2 GHz) processor and 8 GB RAM. 10-fold cross-validation method was used for training and testing data. The experiments have been repeated 5 times for the reliability of the results and the averages of obtained results have been reported.
The required parameter values to obtain high efficiency from CVRBF algorithm were found by experimentally. Accordingly, the optimal multi-layer network structures
Figure 3. The boosting algorithm for ECVRBF
Input
Process
Output
Training dataset
Base learning model Number ofiterations
D
=
{x,,y;};';,1,y,E{-1,1};CVRBF; T;
D1 (i) = 1/ N; % Initialize the weight distribution
Fort = 1,2, ... ,T;
hr= CVRBF(D, D,); % Train a base learner h, from D using Dt
Er = Pr,~o; [hr(X; =t= y;)]; % Measure the error of h,
Ur=! ln t-,,; % Determine the weight of hr
2 Et
D ()- Dr(i) {exp(-ar) if h,(x;) = Yi
<+1 t -
z,
x exp(a,) if h/x;) =;=y,
% Update the distribution, whereD,(i)exp( -a,y,h,(x1)) % Z, is a normalization factor which enables D,(i) to
; % be a distribution
End
Compute H(x) = sign(f(x)) = signI;;=t a,h.(x); % Weighted majority voting
(the number of input-hidden and output neurons) have been determined as 11-10-1, 9-5-1 and 7-10-1 for heart disease, Hepatitis and BUPA liver disorder datasets, respectively. The learning rate during training process has been determined as 0.25, 0.5 and 0.15, respectively. The maximum number of iterations is set to 1000 for all
Figure 4.ECVRBF method with bagging
Figure 5. ECVRBF method with boosting
Bootstrap
=piing with Step2 repl-aeement Generate sample bued on data di!tribution Step l
~
:.e~ cVRBFr•
~
··
,·
'
Update Distributiondatasets. The real and imaginary parts of the complex-valued weights have been initiated with the random numbers taken from a uniform distribution U −
(
(
0 5 0 5. , .)
)
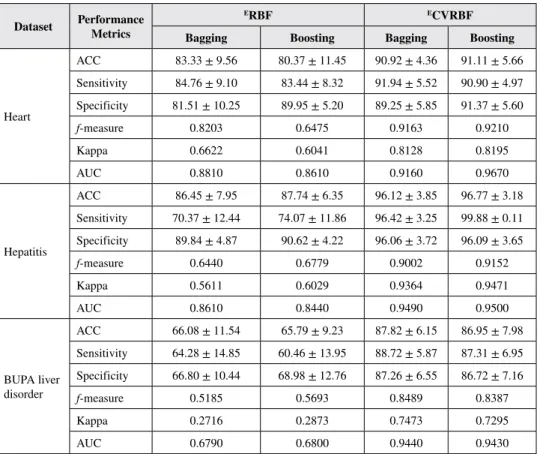
. A gauss activation function was used. In the ensemble of CVRBF to select data subsets, a 75% random sample has been selected with a replacement of the original training dataset. That is, if a training dataset consists of 1000 parts, 750 parts will be drawn randomly with a replacement to create a subset.The success of the ECVRBF method has been tested using six different performance evaluation criterions. These are accuracy, specificity, sensitivity, f-measure, the area under an ROC curve (AUC), and kappa statistic values. In order to see the effect of the classifiers, comparative analysis has been performed. The results obtained for each dataset are given in Table 4.
Table 4. The comparative analysis of ERBF and ECVRBF ensembles with bagging
and boosting
Dataset Performance Metrics ERBF ECVRBF
Bagging Boosting Bagging Boosting
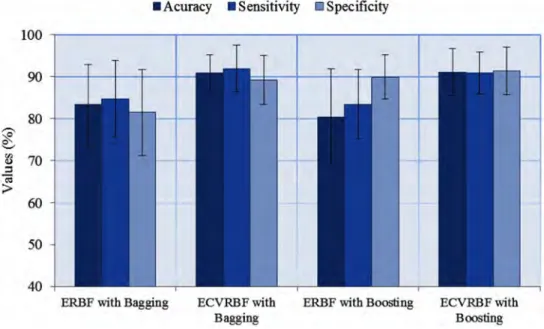
Heart ACC 83.33 ± 9.56 80.37 ± 11.45 90.92 ± 4.36 91.11 ± 5.66 Sensitivity 84.76 ± 9.10 83.44 ± 8.32 91.94 ± 5.52 90.90 ± 4.97 Specificity 81.51 ± 10.25 89.95 ± 5.20 89.25 ± 5.85 91.37 ± 5.60 f-measure 0.8203 0.6475 0.9163 0.9210 Kappa 0.6622 0.6041 0.8128 0.8195 AUC 0.8810 0.8610 0.9160 0.9670 Hepatitis ACC 86.45 ± 7.95 87.74 ± 6.35 96.12 ± 3.85 96.77 ± 3.18 Sensitivity 70.37 ± 12.44 74.07 ± 11.86 96.42 ± 3.25 99.88 ± 0.11 Specificity 89.84 ± 4.87 90.62 ± 4.22 96.06 ± 3.72 96.09 ± 3.65 f-measure 0.6440 0.6779 0.9002 0.9152 Kappa 0.5611 0.6029 0.9364 0.9471 AUC 0.8610 0.8440 0.9490 0.9500 BUPA liver disorder ACC 66.08 ± 11.54 65.79 ± 9.23 87.82 ± 6.15 86.95 ± 7.98 Sensitivity 64.28 ± 14.85 60.46 ± 13.95 88.72 ± 5.87 87.31 ± 6.95 Specificity 66.80 ± 10.44 68.98 ± 12.76 87.26 ± 6.55 86.72 ± 7.16 f-measure 0.5185 0.5693 0.8489 0.8387 Kappa 0.2716 0.2873 0.7473 0.7295 AUC 0.6790 0.6800 0.9440 0.9430
When the results in Table 4 are examined, we may observe that the ECVRBF methods give better results in terms of accuracy, sensitivity and specificity values than the ERBF methods for all three datasets. ECVRBF method also gives better results in f-measure, AUC, and kappa statistic values, as well. The superiority of the Bagging to the Boosting method can also vary in the ERBF methods. The standard deviations of ECVRBF methods are lower than the ERBF methods, demonstrating that the proposed method is more robust and reliable. In addition, the same results are given graphically in Figures 6-8.
Figures 9-11 shows ROC curves with different methods were incorporated in the evaluation for heart disease dataset, Hepatitis disease dataset and BUPA liver disorder dataset, respectively. In this phase, the number of algorithms for the comparisons are also increased. These methods are: typical CVRBF; ECVRBF with Bagging; ECVRBF with Boosting; original dataset + SVM; original dataset + RBF; and original dataset + Decision Tree. When these graphics are examined, we have seen that the best results have been obtained with ECVRBF method for three different datasets. We have also seen that, with the ECVRBF algorithm, in some cases better results were obtained with Bagging, while in some cases better results were obtained
Figure 6. The results for the heart disease dataset
100 90 80 'o' ~ .._, ~ 70 :I «i
>
60 50 40•
Acuracy•
Sensitivity cSpecificityERBF with Bagging ECVRBFwith Bagging
ERBF with Boosting ECVRBFwith
Figure 7. The results for the Hepatitis disease dataset
Figure 8. The results for the BUPA liver disorder dataset
110 100 90 'o' ~ 80 a'.J ::, -;;;
>
70 60 50 40•
Acuracy•
Sensitivity l!JSpeci.ficityERBF with Bagging ECVRBFwith Bagging
ERBF with Boosting
•
A curacy•
Sensitivity•
SpecificityERBF with Bagging ECVRBFwith
Bagging
ERBF with Boosting
ECVRBFwitb Boosting
ECVRBFwitb Boosting
Figure 9. ROC curves for the Statlog heart disease dataset
Figure 10. ROC curves for the Hepatitis disease dataset *For a more accurate representation see the electronic version.
*For a more accurate representation see the electronic version.
1 0.9 0.8 0.7 Q) '§ 0.6 Q) .;,:
"'
0 0.5 a. Q) 0.4 2 I -0.3 , , 0.2 , , , , 0.1 , , 0 0 0.2 0.9 0.8 0.7 Q) ~ 0.6 CD-
-
~
0.5"'
0 a. Q) 0.4 2 I -0.3 , 0.2 , , 0.1 0 0 0.2 , , , , , , ,' , , ,' , , , , , ,- -Decision Tree (AUC: 0.74) - -SVM (AUC: 0.832) - -RBF (AUC: 0.893) - -~HBF (AUC: 0.881) - -CVRBF (AUC: 0.915) - -~CVRBF (AUC; 0.967) 0.4 0.6 False positive rate 0.8 , , , , , , , , , , , , , , , , , ,
, - -Decision Tree (AUC: 0.708)
, , - -SVl,1 (AUC: 0.713) - -RBF (AUC: 0.835) - -E.RBf (AUC: 0.861) - -CVRBF (AUC: 0.934) - -~CVRBF (AUC: 0.950} 0.4 0.6 0.8 False positive rate , , 1
with Boosting. Better results have been obtained with complex valued classifiers, compared to real-valued classifiers. Considering the real-valued classifiers, we have seen that the RBF algorithm is more effective for three datasets.
The performance analysis of the proposed method was then compared with the previous studies from the literature, as listed in Tables 5 to 7. In Table 5, the analysis for the heart disease dataset is given. When the table is examined, we may observe that accuracy values in the range of 80-88% have generally been achieved by other researchers. A 91.11% accuracy rate has been obtained with the developed method for the dataset. In Table 6, the comparative analysis carried out with previous studies for the Hepatitis disease dataset is given. As seen in the table, accuracy values, generally in the range of 79-96%, have been obtained by other researchers. Compared to the other studies, the proposed method has yielded a better result with a 96.77% accuracy value. In Table 7, the comparative analysis for the BUPA liver disorder dataset is given. When we examine the table, we see that an 87.82% classification accuracy has been obtained in this study, while accuracy values in the 60-85% range have generally been obtained by other researchers. In general, the proposed method has provided better results compared to the existing methods from the literature.
*For a more accurate representation see the electronic version. Figure 11. ROC curves for the BUPA liver disorder dataset
0.9 0.8 0-7 Q) ~ 0.6 Q)
·
-5
·oo 0.5 0 Q_ Q) 0.4 2... - -Decision Tree (AUC: 0.66.5)
0.3 - -SVl,1 (AUC: 0.5) - -RBF (AUC: 0.672) 02 --ERBF (AUC: 680) 0.1 - -CVRBF (AUC: 0.868) _ _ :r:CVRBF (AUC: 0.944) 0 0 0.2 0.4 0.6 0.8
CONCLUSION
In this study, ensembles of complex-valued radial basis function networks have been proposed. To investigate the effect of the proposed method, three benchmark medical datasets were used. The common characteristics of these datasets are having a distribution, which cannot be separated linearly and a large amount of missing data. In turn, 91.11%, 96.77% and 87.82% accuracy values were achieved respectively for Statlog heart disease, Hepatitis disease and BUPA liver disorder datasets using
Table 5. Performance comparison for the Statlog heart disease dataset
Study Method Classification Accuracy (%)
Kahramanli and Allahverdi
(2008) Hybrid system using ANN and FNN (10-fold CV) 86.80
Subbulakshmi et al. (2012) Extreme learning machine (70-30% training-testing) 87.50 Shao and Deng (2015) Coordinate descent margin based-twin SVM (10 fold CV) 84.44 Mantas and Abellán (2014) Decision tree based on imprecise probabilities (Credal C4.5)
(10 fold CV) 80.33 Duch et al. (2001) k-NN, k=28, 7 features (10-fold CV) k-NN, k=28, Manhattan (10-fold CV) FSM, 27 fuzzy rules SSV, 3 rules 84.60–85.60 82.20–83.40 82 80.20–83.40 Tian et al. (2009) Cooperative coevolutionary algorithm - elliptical basis function neural network (50-25-25%
training-validation-testing) 82.45
Ahmad et al. (2013) Improved hybrid genetic algorithm-multilayer perceptron network (75- 25% training-testing) 86.30 Torun and Tohumoglu (2011) Simulated annealing and subtractive clustering based fuzzy classifier (10 fold CV) 81.11 Al-Obeidat et al. (2011) Particle swarm optimization for PROAFT (10 fold CV) 84.27 Jaganathan and Kuppuchamy
(2013) Neural network threshold selection (10 fold CV) 85.19 Lim and Chan (2015) Bandlerkohout-interval-valued fuzzy sets (BK-IVFS weighted)
(5 fold CV) 85.56
Yang et al. (2013) Fuzzy class – label SVM (yi - SVM) and Fuzzy SVM
(F-SVM) 85.19
Our study CVRBF ensemble with Bagging 90.92
Table 6. Performance comparison for the Hepatitis dataset
Study Method Classification Accuracy (%)
Shao et al. (2015) Weighted linear loss twin support vector machine – 10 fold CV 84.39 Mantas and Abellán (2014) Decision tree based on imprecise probabilities (Credal C4.5) (10 fold CV) 79.99 Yang et al. (2013) Fuzzy class – label SVM (y
i - SVM) and Fuzzy SVM (F-SVM) 85.19 De Bock et al. (2010) Generalized additive models (GAM) ensemble classifiers – 2 fold CV 89.20 Bascil and Oztekin (2012) Probabilistic Neural Network – 10 fold CV 91.25 Bascil and Temurtas (2011) Multilayer Neural Network with Levenberg Marquardt Training Algorithm - 10 fold CV 91.87 Moradi and Rostami (2015) Integration of graph clustering with ant colony optimization (GCACO) and SVM - training set (2/3 of dataset) and test set (1/3 of dataset). 84.52 Pan et al. (2015) K-nearest neighbor based structural twin support vector machine (KNN-STSVM) – 5 fold CV 87.54 Zhang et al. (2015) Sparse-response backpropagation algorithm (SRBP) – 10 fold CV 84.25
Our study CVRBF ensemble with Bagging 96.12
Our study CVRBF ensemble with Boosting 96.77
Table 7. Performance comparison for the BUPA liver disorder dataset
Study Method Classification Accuracy (%)
Goncalves et al. (2006) Inverted hierarchical neuro-fuzzy binary space partitioning system 73.33 Lee and Mangasarian (2001) Reduced SVMs (10-fold CV) 74.90 Dehuri et al. (2012) Improved swarm optimized functional link artificial neural network (10-fold CV) 76.80 Shao and Deng (2012) Coordinate descent margin based-twin SVM (10-fold CV) 72.80 Savitha et al. (2012) Fully complex valued RBF (10 fold CV) 74.60 Mantas and Abellán(2014) Decision tree based on imprecise probabilities (Credal C4.5) 64.53
López et al. (2014) Mahalanobis SVM 72.17
Torun and Tohumoglu
(2011) Simulated annealing and subtractive clustering based fuzzy classifier (10 fold CV) 74.13 Al-Obeidat et al. (2011) Particle swarm optimization for PROAFT (10 fold CV) 69.31 Yang et al. (2013) Fuzzy class – label SVM (yi - SVM) and fuzzy SVM (F-SVM) 74.78 Van Gestel et al. (2002) SVM with GP (10-fold CV) 69.70 Wang et al. (2014) Spiking neural networks (SNNs) 56.60 Li et al. (2011) A fuzzy-based nonlinear transformation method + SVM 70.85
Our study CVRBF ensemble with Bagging 87.82
the ECVRBF algorithm. The received results in this study are higher than the results obtained in many studies, carried out for the same data in the literature. In an important issue such as medical diagnosis, even a slight increase in classification accuracies is very important. Hence, the method proposed here will contribute significantly to the medical diagnostics. In conclusion, the system can also be used as computer-aided medical diagnosis system to help doctors.
REFERENCES
Ahmad, F., Isa, N. A. M., Hussain, Z., & Osman, M. K. (2013). Intelligent medical disease diagnosis using improved hybrid genetic algorithm-multilayer perceptron network. Journal of Medical Systems, 37(2), 9934. doi:10.100710916-013-9934-7 PMID:23479268
Al-Obeidat, F., Belacel, N., Carretero, J. A., & Mahanti, P. (2011). An evolutionary framework using particle swarm optimization for classification method PROAFTN.
Applied Soft Computing, 11(8), 4971–4980. doi:10.1016/j.asoc.2011.06.003
Aldape-Pérez, M., Yáñez-Márquez, C., Camacho-Nieto, O., & Argüelles-Cruz, A. J. (2012). An associative memory approach to medical decision support systems.
Computer Methods and Programs in Biomedicine, 106(3), 287–307. doi:10.1016/j.
cmpb.2011.05.002 PMID:21703713
Amin, M. F., Islam, M. M., & Murase, K. (2009). Ensemble of single-layered complex-valued neural networks for classification tasks. Neurocomputing, 72(10), 2227–2234. doi:10.1016/j.neucom.2008.12.028
Amin, M. F., & Murase, K. (2009). Single-layered complex-valued neural network for real-valued classification problems. Neurocomputing, 72(4), 945–955. doi:10.1016/j. neucom.2008.04.006
Asuncion, A., & Newman, D. (2007). UCI machine learning repository. Academic Press.
Babu, R. V., Suresh, S., & Savitha, R. (2012). Human action recognition using a fast learning fully complex-valued classifier. Neurocomputing, 89, 202–212. doi:10.1016/j.neucom.2012.03.003
Bascil, M. S., & Oztekin, H. (2012). A study on Hepatitis disease diagnosis using probabilistic neural network. Journal of Medical Systems, 36(3), 1603–1606. doi:10.100710916-010-9621-x PMID:21057884
Bascil, M. S., & Temurtas, F. (2011). A study on Hepatitis disease diagnosis using multilayer neural network with levenbergmarquardt training algorithm. Journal of
Medical Systems, 35(3), 433–436. doi:10.100710916-009-9378-2 PMID:20703548
Bashir, S., Qamar, U., & Khan, F. H. (2016). IntelliHealth: A medical decision support application using a novel weighted multi-layer classifier ensemble framework.
Journal of Biomedical Informatics, 59, 185–200. doi:10.1016/j.jbi.2015.12.001
PMID:26703093
Breiman, L. (1996). Bagging predictors. Machine Learning, 24(2), 123–140. doi:10.1007/BF00058655
Chen, L. F., Su, C. T., Chen, K. H., & Wang, P. C. (2012). Particle swarm optimization for feature selection with application in obstructive sleep apnea diagnosis. Neural
Computing & Applications, 21(8), 2087–2096. doi:10.100700521-011-0632-4
Chen, S., Hong, X., Harris, C. J., & Hanzo, L. (2008). Fully complex-valued radial basis function networks: Orthogonal least squares regression and classification.
Neurocomputing, 71(16), 3421–3433. doi:10.1016/j.neucom.2007.12.003
Chen, S., McLaughlin, S., & Mulgrew, B. (1994). Complex-valued radial basis function network, Part II: Application to digital communications channel equalisation.
Signal Processing, 36(2), 175–188. doi:10.1016/0165-1684(94)90206-2
Cheung, N. (2001). Machine learning techniques for medical analysis (Doctoral dissertation). University of Queensland.
Das, R. (2010). A comparison of multiple classification methods for diagnosis of Parkinson disease. Expert Systems with Applications, 37(2), 1568–1572. doi:10.1016/j.eswa.2009.06.040
Das, R., & Sengur, A. (2010). Evaluation of ensemble methods for diagnosing of valvular heart disease. Expert Systems with Applications, 37(7), 5110–5115. doi:10.1016/j.eswa.2009.12.085
Das, R., Turkoglu, I., & Sengur, A. (2009). Diagnosis of valvular heart disease through neural networks ensembles. Computer Methods and Programs in Biomedicine, 93(2), 185–191. doi:10.1016/j.cmpb.2008.09.005 PMID:18951649
De Bock, K. W., Coussement, K., & Van den Poel, D. (2010). Ensemble classification based on generalized additive models. Computational Statistics & Data Analysis,
Dehuri, S., Roy, R., Cho, S. B., & Ghosh, A. (2012). An improved swarm optimized functional link artificial neural network (ISO-FLANN) for classification. Journal
of Systems and Software, 85(6), 1333–1345. doi:10.1016/j.jss.2012.01.025
Duch, W., Adamczak, R., & Grabczewski, K. (2001). A new methodology of extraction, optimization and application of crisp and fuzzy logical rules. IEEE Transactions on
Neural Networks, 12(2), 277–306. doi:10.1109/72.914524 PMID:18244384
Freund, Y., & Schapire, R. E. (1995, March).A desicion-theoretic generalization of on-line learning and an application to boosting. In European conference on
computational learning theory (pp. 23-37). Springer. 10.1007/3-540-59119-2_166
Gonçalves, L. B., Vellasco, M. M. B. R., Pacheco, M. A. C., & de Souza, F. J. (2006). Inverted hierarchical neuro-fuzzy BSP system: A novel neuro-fuzzy model for pattern classification and rule extraction in databases. IEEE Transactions on
Systems, Man and Cybernetics. Part C, Applications and Reviews, 36(2), 236–248.
doi:10.1109/TSMCC.2004.843220
Jaganathan, P., & Kuppuchamy, R. (2013). A threshold fuzzy entropy based feature selection for medical database classification. Computers in Biology and Medicine,
43(12), 2222–2229. doi:10.1016/j.compbiomed.2013.10.016 PMID:24290939
Jin, B., Tang, Y. C., & Zhang, Y. Q. (2007). Support vector machines with genetic fuzzy feature transformation for biomedical data classification. Information Sciences,
177(2), 476–489. doi:10.1016/j.ins.2006.03.015
Kahramanli, H., & Allahverdi, N. (2008). Design of a hybrid system for the diabetes and heart diseases. Expert Systems with Applications, 35(1), 82–89. doi:10.1016/j. eswa.2007.06.004
Karabulut, E. M., & İbrikçi, T. (2012). Effective diagnosis of coronary artery disease using the rotation forest ensemble method. Journal of Medical Systems, 36(5), 3011–3018. doi:10.100710916-011-9778-y PMID:21912972
Lee, Y. J., & Mangasarian, O. L. (2001). SSVM: A smooth support vector machine for classification. Computational Optimization and Applications, 20(1), 5–22. doi:10.1023/A:1011215321374
Li, D. C., Liu, C. W., & Hu, S. C. (2011). A fuzzy-based data transformation for feature extraction to increase classification performance with small medical data sets.
Artificial Intelligence in Medicine, 52(1), 45–52. doi:10.1016/j.artmed.2011.02.001
Li, M. B., Huang, G. B., Saratchandran, P., & Sundararajan, N. (2006). Complex-valued growing and pruning RBF neural networks for communication channel equalisation. IEE Proceedings. Vision Image and Signal Processing, 153(4), 411–418. doi:10.1049/ip-vis:20050217
Lim, C. K., & Chan, C. S. (2015). A weighted inference engine based on interval-valued fuzzy relational theory. Expert Systems with Applications, 42(7), 3410–3419. doi:10.1016/j.eswa.2014.12.025
López, F. M., Puertas, S. M., & Arriaza, J. T. (2014). Training of support vector machine with the use of multivariate normalization. Applied Soft Computing, 24, 1105–1111. doi:10.1016/j.asoc.2014.08.020
Mantas, C. J., & Abellán, J. (2014). Credal-C4. 5: Decision tree based on imprecise probabilities to classify noisy data. Expert Systems with Applications, 41(10), 4625–4637. doi:10.1016/j.eswa.2014.01.017
Moradi, P., & Rostami, M. (2015). Integration of graph clustering with ant colony optimization for feature selection. Knowledge-Based Systems, 84, 144–161. doi:10.1016/j.knosys.2015.04.007
Pan, X., Luo, Y., & Xu, Y. (2015). K-nearest neighbor based structural twin support vector machine. Knowledge-Based Systems, 88, 34–44. doi:10.1016/j. knosys.2015.08.009
Peker, M. (2016). An efficient sleep scoring system based on EEG signal using complex-valued machine learning algorithms. Neurocomputing, 207, 165–177. doi:10.1016/j.neucom.2016.04.049
Sartakhti, J. S., Zangooei, M. H., & Mozafari, K. (2012). Hepatitis disease diagnosis using a novel hybrid method based on support vector machine and simulated annealing (SVM-SA). Computer Methods and Programs in Biomedicine, 108(2), 570–579. doi:10.1016/j.cmpb.2011.08.003 PMID:21968203
Savitha, R., Suresh, S., Sundararajan, N., & Kim, H. J. (2012). A fully complex-valued radial basis function classifier for real-complex-valued classification problems.
Neurocomputing, 78(1), 104–110. doi:10.1016/j.neucom.2011.05.036
Shao, Y. H., Chen, W. J., Wang, Z., Li, C. N., & Deng, N. Y. (2015). Weighted linear loss twin support vector machine for large-scale classification. Knowledge-Based
Shao, Y. H., & Deng, N. Y. (2012). A coordinate descent margin based-twin support vector machine for classification. Neural Networks, 25, 114–121. doi:10.1016/j. neunet.2011.08.003 PMID:21890319
Subbulakshmi, C. V., Deepa, S. N., & Malathi, N. (2012, August).Extreme learning machine for two category data classification. In Advanced Communication Control
and Computing Technologies (ICACCCT), 2012 IEEE International Conference on
(pp. 458-461). IEEE. 10.1109/ICACCCT.2012.6320822
Tian, J., Li, M., & Chen, F. (2009). A hybrid classification algorithm based on coevolutionary EBFNN and domain covering method. Neural Computing &
Applications, 18(3), 293–308. doi:10.100700521-008-0182-6
Torun, Y., & Tohumoğlu, G. (2011). Designing simulated annealing and subtractive clustering based fuzzy classifier. Applied Soft Computing, 11(2), 2193–2201. doi:10.1016/j.asoc.2010.07.020
Van Gestel, T., Suykens, J. A., Lanckriet, G., Lambrechts, A., De Moor, B., & Vandewalle, J. (2002). Bayesian framework for least-squares support vector machine classifiers, Gaussian processes, and kernel Fisher discriminant analysis.
Neural Computation, 14(5), 1115–1147. doi:10.1162/089976602753633411
PMID:11972910
Wang, J., Belatreche, A., Maguire, L., & Mcginnity, T. M. (2014). An online supervised learning method for spiking neural networks with adaptive structure.
Neurocomputing, 144, 526–536. doi:10.1016/j.neucom.2014.04.017
Yang, C. Y., Chou, J. J., & Lian, F. L. (2013). Robust classifier learning with fuzzy class labels for large-margin support vector machines. Neurocomputing, 99, 1–14. doi:10.1016/j.neucom.2012.04.009
Zhang, J., Ji, N., Liu, J., Pan, J., & Meng, D. (2015). Enhancing performance of the backpropagation algorithm via sparse response regularization. Neurocomputing,
153, 20–40. doi:10.1016/j.neucom.2014.11.055
KEY TERMS AND DEFINITIONS
Classification: It is a kind of supervised machine learning in which an algorithm
“learns” to classify novel observations from samples of labeled data.
Complex-Valued Neural Network: It is a variety of neural network and its
Decision Support System: It is a computer-based information system that
supports organizational or business decision-making activities.
Ensemble Methods: It is a set of classifiers whose individual decisions are
integrated in some way to classify novel examples.
Machine Learning: It is the notion that a computer program can learn and adapt
to novel data without human interference.
Medical Diagnosis: It is a classification operation including the decision-making
process based on available medical data.
ROC Curve: It is a graphical method which assess the success of a binary