T.C
(MASTER THESIS) YAŞAR UNIVERSITY
GRADUATE SCHOOL OF NATURAL AND APPLIED SCIENCE
AUTOMATIC ELECTROCARDIOGRAM (ECG) BEAT
CLASSIFICATION SYSTEM USING HYBRID
TECHNIQUE
Sani SAMINU
Thesis Advisor: Asst. Prof. Dr. Nalan ÖZKURT Department of Electrical and Electronics Engineering
Bornova -İZMİR 2014
YAŞAR UNIVERSITY
GRADUATE SCHOOL OF NATURAL AND APPLIED SCIENCE (MASTER THESIS)
AUTOMATIC ELECTROCARDIOGRAM (ECG) BEAT
CLASSIFICATION SYSTEM USING HYBRID
TECHNIQUE
Sani SAMINU
Thesis Advisor: Asst. Prof. Dr. Nalan ÖZKURT Department of Electrical and Electronics Engineering
Bornova -İZMİR 2014
APPROVAL PAGE
This study titled “AUTOMATIC ELECTROCARDIOGRAM (ECG) BEAT CLASSIFICATION SYSTEM USING HYBRID TECHNIQUE” and presented as M.Sc Thesis by Sani Saminu has been evaluated in compliance with the relevant provision of Y.U Graduate Education and Training Regulations of Y.U institute of Science Education and Training Directions. The jury members below have decided for the defense of this thesis, and it has been declared by consensus/ majority of votes that the candidate has succeeded in his thesis defense examination dated ………
Jury Members: Signature: Head: ……….. ………
Rapporteur Member: ……….. ……….
ABSTRACT
AUTOMATIC ELECTROCARDIOGRAM (ECG) BEAT CLASSIFICATION SYSTEM USING HYBRID TECHNIQUE
Sani SAMINU
MSc in Electrical and Electronics Engineering Supervisor: Asst. Prof. Dr. Nalan ÖZKURT
June 2014
Heart is one of the critical organs in the human body. Electrocardiography (ECG) signal is a bioelectrical signal which record the electrical activity of the heart, it is a technique used primarily as a diagnostic tool for various cardiac diseases by providing necessary information on the electrophysiology and changes that may occur in the heart. To reduce mortality rate associated with cardiac diseases, early detection of these diseases is of paramount important. In this thesis, automated ECG beat detection system using a hybrid technique has been proposed for classifying four ECG beats as normal, right bundle branch block (Rbbb), paced beat and left bundle branch block (Lbbb) using the signals from Massachusetts Institute of Technology Beth Israel Hospital (MIT-BIH) arrhythmia database and processed using signal processing toolbox, wavelet toolbox and neural network toolbox found in Matlab 2013 environment.
In the preprocessing and QRS detection stage, a well known and acceptable Pan-Tompkins algorithm has been used to remove noise and detect R-peaks. Equivalent R-T interval samples between R-R intervals have been extracted as a time domain features, these features have been decomposed using discrete wavelet transform (DWT) and stationary wavelet transform (SWT) as time-frequency features, statistical parameters have been calculated as mean, median, standard deviation, maximum, minimum, energy and entropy using time-frequency features and classification has been performed using neural network. The hybrid method gives a promising result as equivalent R-T interval features gives average accuracy of 98.22% and 94.18%, the DWT with statistical features gives average accuracy of 99.84% and 97.59% for reduced and large number of samples respectively. However, an improvement was recorded when employing SWT for wavelet decomposition using large number of samples with average accuracy of 98.33%. Also comparative performance has been carried out between different wavelet families in which db4, coif5 and sym8 give higher performance. Wavelet time and frequency entropy using SWT have been calculated as a new feature; based on the classification results wavelet time entropy gives average accuracy of 98.21% against frequency entropy of 97.77%. Based on the comparative analysis among all the proposed methods combined SWT with statistical features gives higher and satisfactory results.
ÖZET
KARMA BİR TEKNİK KULLANARAK OTOMATİK ELEKTROKARDİOGRAM VURU SINIFLANDIRMA SİSTEMİ
Sani SAMINU
Elektrik ve Elektronik MühendisliğiYüksek Lisans Danışman: Yard.Doç. Dr. Nalan ÖZKURT
Haziran 2014
Kalp insan vücudundaki kritik organlardan biridir. Elektrokardiografi (EKG) işareti kalbin elektriksel aktivitesini kaydeden biyoelektrik bir işarettir ve bu teknik kalbin elektrofizyolojisi ve meydana çıkabilecek değişiklikler hakkında gerekli bilgileri toplayarak birçok kalp hastalığı için birincil tanı aracı olarak kullanılmaktadır. Kalp hastalıklarından kaynaklanan ölüm oranını azaltmak için bu hastalıkların erken tanısı büyük önem taşımaktadır. Bu tezde, Massachusetts Teknoloji Enstitüsü Beth Israel Hastanesi (MIT-BIH) ritm bozukluğu veri tabanından alınan işaretler kullanılarak EKG vurularını normal, sağ dal bloğu (Rbbb), kalp pili vurusu, sol dal bloğu (Lbbb) olmak üzere dört sınıfa ayırmak için Matlab 2013 ortamında bulunan işaret işleme, dalgacık dönüşümü ve yapay sinir ağları araç kutularını kullanan karma bir sistem önerilmektedir.
Önişleme ve QRS kompleksinin sezilmesi aşamasında, gürültüyü azaltmak ve R-tepelerini tespit etmek amacıyla Pan-Tompkins algoritması kullanılmıştır. Zaman ortamı öznitelikleri olarak R-R aralıkları arasındaki R-T eşdeğer aralığı örnekleri alınmış ve bu örneklere ayrık dalgacık dönüşümü (ADD) ve durağan dalgacık dönüşümü (DDD) uygulanarak zaman-frekans öznitelikleri elde edilmiş, bu büyüklüklerin ortalama, medyan, standart sapma, en büyük, en küçük, enerji ve entropi gibi istatistiksel parametreleri hesaplanarak yapay sinir ağları ile sınıflandırılmıştır. Sırasıyla azaltılmış ve geniş veri seti için R-T eşdeğer aralığı öznitelikleriiçin %98.22 ve %94.18 ortalama doğruluk elde edilirken, ADD öznitelikleri için %99.84 ve%97.59 ortalama doğruluk elde edilmiştir. Geniş veri setinde DDD için %98.33 ortalama doğruluk oranı ile bir iyileştirme sağlanmıştır. Ayrıca, farklı dalgacık aileleri arasında da karşılaştırma yapılmış ve db4, coif5 ve sym8 dalgacıkları için daha yüksek başarım elde edilmiştir. Yeni bir öznitelik olarak DDD zaman ve frekans entropisi önerilmiş, %98.21 ile zaman entropisi %97.77 doğruluk oranı olan frekans entropisinden daha iyi bir sonuç vermiştir. Tüm öznitelikler karşılaştırıldığında, DDD istatistiksel parametreleri daha iyi sonuçlar vermiştir.
ACKNOWLEDGEMENTS
All praises and thanks be to Almighty ALLAH for giving me the grace and opportunity to carry out this thesis work. I would like to sincerely express my appreciation and gratitude to the kind gesture of my wonderful supervisor Dr. Nalan Özkurt for her constant and continuous support, guidance, encouragement, corrections and nice suggestions which have been the essential keys in the completion of this work.
Special thanks to my fellow research colleague and closed friend Ibrahim Abdullahi Karaye, Hikmet Gumuş of faculty of medicine Dokuz Eylul University Izmir and my course mates for their friendship, support and thoughtful and motivating discussions we had, throughout my programme.
I would like to acknowledge the academic and technical support of Electrical and Electronic Engineering Department staffs for their support and assistance since the start of my postgraduate work in 2012, especially the head of department, Prof. Dr. Mustafa GÜNDÜZALP.
Thanks to Kano State Government of Nigeria under the leadership of His Excellency Dr. Rabi’u Musa Kwankwaso for awarding me scholarship grant for this masters program.
Last but not least, my sincere gratitude goes to my family for their patience, encouragement and parental care right from the genesis of my life.
TEXT OF OATH
I declare and honestly confirm that my study titled “AUTOMATIC ELECTROCARDIOGRAM (ECG) BEAT CLASSIFICATION SYSTEM USING HYBRID TECHNIQUE”, and presented as Master’s Thesis has been written without applying to any assistance inconsistent with scientific ethics and traditions, that all sources from which I have benefited listed in bibliography, and that I have benefited from these sources by means of making references.
12/6/2014 ………. Student Name & Signature
DEDICATION
This thesis work is dedicated to Engr. Dr. Rabi’u Musa
Kwankwaso, the executive governor of Kano
TABLE OF CONTENTS
APPROVAL PAGE ... iii
ABSTRACT ... v
ÖZET ... iv
TEXT OF OATH ... vi
TABLE OF CONTENTS ... viii
INDEX OF FIGURES ... xi
INDEX OF TABLES ... xiv
INDEX OF ABBREVIATIONS ... xvi
CHAPTER ONE ... 1
INTRODUCTION ... 1
1.1 Background ... 1
1.2 Significance of the Study ... 6
1.3 Aim and Objectives ... 6
1.4 Organization of the Report ... 7
CHAPTER TWO ... 9
ANATOMY OF THE HEART AND ELECTROCARDIOGRAPHY... 9
2.0 Overview ... 9
2.1 The Heart Anatomy ... 9
2.2 Electrocardiogram... Error! Bookmark not defined. 2.3 Leads in ECG ...14
2.4 ECG waves and interval ...16
2.5 Heart Diseases ...19
CHAPTER THREE ...25
WAVELET TRANSFORM AND NEURAL NETWORK ...25
3.0 Overview ...25
3.1 Mathematical Transformation ...25
3.2 Stationarity of a Signal ...27
3.3 The Short Term Fourier Transforms (STFF) ...29
3.4 Wavelet Theory ...30
TABLE OF CONTENTS (cont'd)
3.6 Artificial Neural network ...40
CHAPTER FOUR ...51
EXPERIMENTS AND SYSTEM DESIGN ...51
4.0 Overview ...51
4.1 Experimental Tools: The Matlab Environment ...52
4.2 ECG Data Acquisition ...56
4.3 Signal Pre-processing ...60
4.4 QRS Detection ...64
4.5 Feature Extraction using Pan Tompkins Algorithm ...68
4.6 Statistical feature Extraction ...72
4.7 Wavelet Time-Frequency Entropy ...73
4.8 Output Target Vector Formation ...74
4.9 Designing the Neural Network ...76
4.10 Testing the Neural Network ...77
CHAPTER FIVE ...78
RESULTS AND DISCUSSION ...78
5.0 Overview ...78
5.1 Performance Parameters Measure ...79
5.2 Performance Analysis of Equivalent R-T Interval Features ...80
5.3. Performance Analysis of Larger Number of Samples and ECG Beats ...86
5.4 Performance of SWT with Large Number of Samples ...91
5.5 Performance of Combined R-R-time Interval and R-T Interval...93
5.6 Performance of SWT Entropy ...98
5.7 Comparative Performance Analysis... 101
CHAPTER SIX ... 104
WIRELESS ECG ACQUISITION DEVICE ... 104
6.0 Overview ... 104
6.1 ECG Hardware Acquisition Module ... 105
6.2 Analog Front End Design ... 107
TABLE OF CONTENTS (cont'd)
6.4 SimpliciTI Network Protocol ... 110
6.5 Software Design ... 111 6.6 Result ... 114 CHAPTER SEVEN ... 116 CONCLUSIONS ... 116 6.1 Summary ... 116 6.2 Future Works ... 117 BIBLIOGRAPHY ... 119 APPENDICES ... 126
INDEX OF FIGURES
Figure 1.1: Normal ECG wave ... 2
Figure1.2: Main phases of ECG signal processing and analysis ... 3
Figure 2.1: A full view of Human Heart, with chambers and valves ...10
Figure2.2: Conduction system of the heart ...13
Figure 2.3: (a)The Einthoven Triangle for 3-lead ECG configuration(Klabunde, 2008) (b)12-lead ECG configuration ...15
Figure 2.4 Typical shape of ECG signal and its essential waves and characteristic points ....16
Figure 2.5: Right bundle branch block ...20
Figure 2.6: Right bundle branch block with markup ...21
Figure 2.7: Sinus rhythm with intermittent Right bundle branch block ...21
Figure 2.8: Right bundle branch block and left anterior fasicular block ...21
Figure 2.9: Left bundle branch block...23
Figure 2.10: Left bundle branch block with markup ...24
Figure 2.11: Sinus tachycardia with Left bundle branch block...24
Figure 2.12: Atrial fibrillation with Left bundle branch block ...24
Figure 3.1: Time domain plot of signal in equation 3.1 ...27
Figure 3.2: Fourier transform plot of signal in equation 3.1 ...27
Figure 3.3: Time domain plot of non-stationary signal ...28
Figure 3.4: Fourier transform of figure 3.3 ...28
Figure 3.5: Sinusoidal signal and Deubecheis wavelet ...30
Figure 3.6: Filter banks signal decomposition ...32
Figure 3.7: Three level Wavelet decomposition tree ...32
Figure 3.8: A 3 level SWT filter bank ...35
Figure 3.9: SWT filters ...35
Figure 3.10: Fundamental of wavelet time-frequency entropy. ...39
Figure 3.11: Neural Network adjust system ...40
Figure 3.12: Log-Sigmoid Transfer Function ...42
Figure 3.13: Tan-Sigmoid Transfer Function ...42
Figure 3.14: Linear Transfer Function...43
Figure 3.15 Single-layer feed-forward network ...43
Figure 3.16: A neuron with a single R-element input vector ...44
INDEX OF FIGURES (cont'd)
Figure4.1: Automatic ECG Beat Detection System Development Flow Chart ...52
Figure 4.2(a) and (b): Raw ECG signal Obtained from MIT-BIH Database ...59
Figure 4.3: A Section of noisy ECG Records Obtained from MIT-BIH Database ...61
Figure 4.4: Low Pass Filter ...62
Figure4.5: High Pass Filter ...63
Figure 4.6: Comb Filter ...64
Figure 4.7: Sample filtered ECG signal after preprocessing ...64
Figure 4.8: ECG signal with R peaks detected...67
Figure 4.9: Method of R-T intervals Feature Extraction ...69
Figure 4.10: R-T Intervals Features (200*1937) for Training ...69
Figure 4.11: R-T Intervals Features (200*807) for Testing ...70
Figure 4.12: Feature extraction technique using DWT ...71
Figure 4.13: Wavelet and Statistical Analysis ...73
Figure 5.1: Best Run Network for reduced R-T interval samples ...81
Figure 5.2: Test Data Confusion Matrix for reduced R-T interval samples...82
Figure 5.3: Best Run Network for DWT features with reduced samples ...84
Figure 5.4: Test Data Confusion Matrix for DWT with reduced samples ...85
Figure 5.5: Best Run Network for R-T interval features with large samples ...87
Figure 5.6: Test Data Confusion Matrix for R-T interval with large samples ...87
Figure 5.7: Best Run Network for DWT features with large samples ...89
Figure 5.8: Test Data Confusion Matrix for DWT with large samples ...90
Figure 5.9: Best Run Network for SWT features with large samples ...92
Figure 5.10: Test Data Confusion Matrix for SWT with large samples ...92
Figure 5.11: Best Run Network for combined R-R time and R-T features with large samples ...94
Figure 5.12: Test Data Confusion Matrix for combined R-R time and R-T interval with large samples ...94
Figure 5.13: Best Run Network for combined R-R time and R-T features with DWT ...96
Figure 5.14: Test Data Confusion Matrix for combined R-R time and R-T interval with DWT ...97
Figure 5.15: Best Run Network for Frequency Entropy using SWT ...99
INDEX OF FIGURES (cont'd)
Figure 5.17: Best Run Network for Time Entropy using SWT ... 100
Figure 5.18: Test Data Confusion matrix for Time Entropy ... 101
Figure 6.1: General block diagram of wireless ECG acquisition module ... 106
Figure 6.2: AD620 pinsou ... 107
Figure 6.3: AD620 Instrumentation amplifier... 108
Figure6.4: CA3140 Op-Amp and filters connection... 109
Figure 6.5: eZ430-RF2500 Access point and USB debugging interface ... 110
Figure 6.6: eZ430-RF2500 End device Battery Board ... 110
Figure 6.7: End device software flowchart... 112
Figure 6.8: Access point program flowchart ... 113
Figure 6.9: First ECG result via an oscilloscope... 114
Figure 6.10: complete setup of ECG analog front end ... 114
INDEX OF TABLES
Table 2.1: types of leads used in ECG monitoring ...14
Table 2.2 Amplitude and duration of waves, intervals and segments ...18
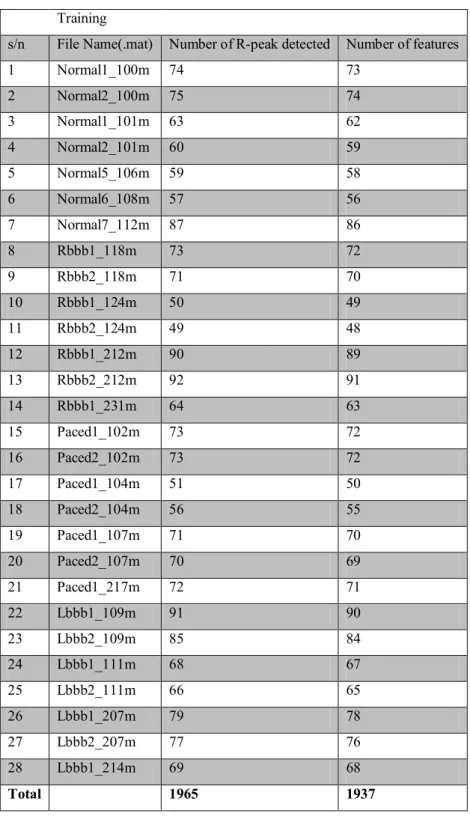
Table 4.1: ECG .mat files used for training in this thesis ...57
Table 4.2: ECG .mat files used for testing in this thesis...58
Table 4.3:Target Vector Formation ...75
Table4.4: Output TargetVector ...75
Table 5.1: Performance of R-T interval features with reduced samples ...81
Table 5.2: Extracted parameters from figure 5.2 ...82
Table 5.3: Performance measures for reduced R-T interval samples ...83
Table 5.4: DWT features performance for reduced number of samples ...83
Table 5.5: Extracted parameters from figure 5.4 ...85
Table 5.6: Performance measures for DWT with reduced samples ...86
Table 5.7: Performance of R-T interval features with large samples ...86
Table 5.8: Extracted parameters from figure 5.6 ...88
Table 5.9: Performance measures for R-T interval with large samples ...88
Table 5.10: DWT features performance for large number of samples ...89
Table 5.11: Extracted parameters from figure 5.8 ...90
Table 5.12: Performance measures for DWT with large samples ...90
Table 5.13: SWT features performance for large number of samples ...91
Table 5.14: Extracted parameters from figure 5.10 ...92
Table 5.15: Performance measures for SWT with large samples ...93
Table 5.16: Performance of combined R-R time and R-T features with large samples ...94
Table 5.17: Extracted parameters from figure 5.12 ...95
Table 5.18: Performance measures for combine R-R time and R-T interval with large samples ...95
Table 5.19: R-R time and R-T with DWT features performance for large number of samples ...95
Table 5.20: Extracted parameters from figure 5.14 ...97
Table 5.21: Performance measures for combine R-R time and R-T interval with DWT ...97
Table 5.22: Frequency Entropy features performance for large number of samples...98
INDEX OF TABLES (cont'd)
Table 5.24: Performance measures of frequency Entropy with large number of samples100
Table 5.26: Extracted parameters from figure 5.18 ... 101
Table 5.27: Performance measures of Time Entropy features with large number of samples ... 101
Table 5.28 Comparison between reduced sample and large sample set ... 102
Table 5.29 Comparison of different methods ... 102
Table 5.30: Comparison between wavelet families ... 102
Table 5.31: Comparison between Time and Frequency Wavelet Entropy ... 103
Table 6.1: eZ430-RF2500T Target Board Pinouts ... 111
INDEX OF ABBREVIATIONS
A/D Analog to digital
ANN Artificial Neural network
AV Atrio Ventricular
BP Back propagation
CDV Cardiovascular disease
CWT Continuous wavelet transform DBNN Decision based neural network DSP Digital signal processing DCT Discrete cosine transform DWT Discrete wavelet transform
ECG Electrocardiogram
EMG Electromyogram
FFT Fast Fourier transform FIR Finite impulse response GUI Graphical user interface
HBR Heart beat rate
I/O Input/Output
ICA Independent component analysis IIR Infinite impulse response
ISO Isoelectric line
LA Left arm
Lbbb Left bundle branch block
LL Left leg
LMS Least Mean Square
LVQ Linear vector quantization
MIT-BIH Massachusetts Institute of Technology Beth Israel Hospital database
MSE Mean Squared Error
N Normal
INDEX OF ABBREVIATIONS (cont’d) NPV Negative predictive value
P Paced beats
PAD Peripheral atrial disease PCA Principal component analysis PLI Power line interference PPV Positive predictive value PSD Power spectral density R Right bundle branch block
RA Right arm
Rbbb Right bundle branch block
RL Right leg
SA Sino Atrial
SNR Signal to noise ratio STD Standard deviation
SWT stationary wavelet transform
TN True negative
TP True positive
WE Wavelet entropy
WHO World Health Organization WTFE Wavelet time frequency entropy
CHAPTER ONE INTRODUCTION
This chapter discusses the general background information about the principles, benefits and challenges associated with electrocardiogram (ECG) acquisition, processing and classification. Also this part discusses the general health issues in ECG analysis especially in terms of wireless acquisition, ECG features extraction techniques and automatic beats detection system which encourages the present research. Then a brief review and problem definition from the previous studies, the research significance, its aim and objectives, scopes of the present works and thesis outlines are presented.
1.1 Background
Human body consists of different organs that are interconnected together for proper and efficient body function. Heart is one of the most critical organs in the human body because it supply blood to different part of the body organs, therefore there is highly need in the development of methods and systems for monitoring its functionality. One of the most powerful diagnostic tools in medical application that is commonly used for the assessment of the functionality of the heart is Electrocardiography. The ECG is a real-time non-invasive and conventional method for interpretation of the electrical activity of the heart. By attaching electrodes at different outer surface of the human skin, electrical cardiac signals can be recorded by an external device. These currents cause the contractions and relaxations of heart by stimulating cardiac muscle (Guyton and Hall, 2006) and travel as electrical signals through the electrodes to the ECG device, which records them as characteristic waves. Different waves and fiducial points of ECG reflect the activity of different parts of the heart which generate the respective flow of electrical currents. Figure 1 shows a schematic representation of a normal ECG and its various waves.
Generally, healthcare is one of the emerging areas of research in this century and in hospital and health care community, there are considerable commercial interests in the wireless and automatic classification of the ECG signals. Because cardiovascular diseases (CDV) remains as the dominant causes of death all over the world with an estimated of 17.3 million people died from CDV in 2008 which account to 30% of all global death and 23.6 million people will die from these diseases by the year 2030 based on the prediction and statistics from World Health Organization (WHO). Also, according to a recently published (2014) report by Heart failure Working Group of the Turkish Society of Cardiology (TDK), there are 15 million heart-failure patients in Europe and 6 million in the United States (US), in Turkey there are 1 million patients suffering from heart failure. With another 2 million people who are at serious risk of this disease and those figures will increase about two fold within 10 years (Yuksel, 2014). It is very important to detect and diagnose as early as possible and accurately these cardiac arrhythmias since they usually cause sudden cardiac death. It is tedious and time consuming to used visual inspection in ECG analysis even for an expert cardiologist. Therefore, the usage of computer software to automatically detect the ECG beats and diagnose the ECG classes as well as simple and low cost acquisition system is cost effective and significantly improves diagnostic accuracy and patient healing outcomes (Bruce, 1996;Krummen et al., 2010).
In order to address some of the challenges mentioned above, This thesis has focused on developing cost effective, intelligent and easy-to-use ECG wireless acquisition and automatic diagnostic system based on a hardware and software that
uses signal processing and search for effective ECG features extraction techniques to obtain the critical characteristics and useful clinical signatures of ECG waves which can represents different cardiac conditions and classifying these conditions by using application of pattern recognition in artificial neural networks. Unification and implementing of this system in the future will be able to provide patients and doctors with self diagnosis systems that can be used to minimize mortality rates associated with CDVs especially in developing and underdeveloped countries where there is poor doctor to patient ratio, improper health care policies, inadequate of qualified medical experts and lack of health care equipments.
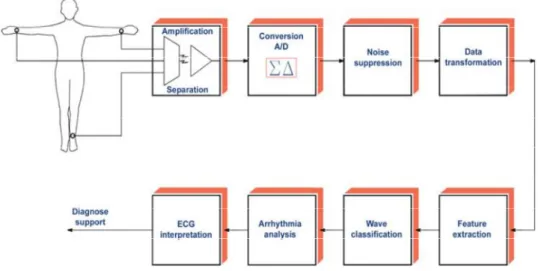
Figure 1.2 below shows a block diagram of a general process of ECG signal processing and analysis.
ECG signal processing and analysis comprises a sequence of steps among which the most essential include
Amplification of signal and its Analog to digital (A/D) conversion Noise elimination
Feature extraction and selection Arrhythmia classification.
The quality of the overall process of acquisition, classification and interpretation of ECG signals depends on the quality and effectiveness of the methods used at these steps. Both signal amplification and A/D conversion are realized in hardware while all filtering and noise elimination are realized through the use of advanced technologies of information processing.
Different unwanted signals called artifacts heavily affect the recording process. In addition, the ECG signals collected from different people are heterogeneous, generally reflected by the variations in the different clinical signatures of the beats. Hence, computationally intensive preprocessing is required for beat detection and feature extraction. The most important features include the information lying in the P, Q, R, S, and T waves of the ECG signal (Wolter, 2011). ECG beats should be classified based on these features in order to detect different types of CVD. Different kinds of noises interfere with ECG signals are
Baseline wandering,
Electromyogram (EMG) noise, Motion artifact,
Power-line interference (PLI), and Electrode pop or contact noise etc.
After ECG acquisition by suitable electrode, instrumentation amplifiers and filters, the next step is preprocessing which generally takes care of eliminating or minimizing the unwanted signal; a process called denoising. Several works have been reported in the area of ECG denoising. Prior to 1980s noise filtering was based on digital filters (Hirano et al., 1974), to reduce PLI (Hamilton, 1996) makes a comparative analysis between adaptive and non-adaptive notch filters. (Tompkins and Ahlstrom, 1985) implemented an adaptive filtering which was found to be more effective than non-adaptive counterpart. Long computation time as a result of large number of multiplication is a common problem in linear phase filtering. (Mneimneh et al., 2006) proposed a method for baseline removal using adaptive Kalman technique. Other ECG denoising techniques includes using Principal component analysis (PCA) and Independent component analysis (ICA) (Chawla, 2011), Neural
network method (Farahabadi et al., 2009) and multi resolution wavelet based analysis (Pal and Mitra, 2010).
The studies in computerized interpretation of ECG was started with the introduction of digital computer by Caseres and others (Milliken et al., 1969) was able to acquire ECG data from a patient using portable machine. Microprocessor standalone units for automated interpretation were in used in 1970s (Murray, 1982). Gradient –based algorithm and time domain morphology was presented (Mazomenos et al., 2012). Also, (Chatterjee et al., 2011) described statistical method of comparison between relative magnitudes of ECG samples and their time domain slope. Another classifier based on ECG morphological features was reported in (Chazal et al., 2004) and (Chazal and Reilly, 2006). Wavelet transform finds application in ECG beats detection and feature extraction as reported in (Li et al., 1995), (Saxena et al., 2003) and (Martinez et al., 2004). Also, (Mahesh, 2010) used wavelet and Pan-Tompkins to extract time-frequency features for ECG beat detection system. In (Marlar and Aung, 2014), they presented classification of normal and abnormal signal using R-R interval features of ECG waveform. Wavelet entropy analysis of high resolution ECG signal using continuous wavelet transform (CWT) and discrete wavelet transform was presented (Natwong et al., 2006).
So far, several techniques such as support vector machines (Martis et al., 2012), neural networks (Inan et al., 2006), self organizing map (Lagorholm et al., 2000), hybrid fuzzy neural network (Osowski and Linh, 2001) and probabilistic neural network (Martis et al., 2013) have been introduced for the ECG beat classification. The area of automated arrhythmia detection system is still an active area of research in order to provide high classification accuracy for inter and intra patient variation cases due to the fact that these machine learning techniques map new data instances based on the information extracted from the annotated training data in the learning phase and provide a global classifier that may not be always accurate for patient-specific cardiac variations.
1.2 Significance of the Study
Information about the behavior of the heart can be extracted from P, QRS, and T peaks, time domain amplitude and ECG clinical features. Subtle changes in these peaks and their positions however cannot be clearly deciphered by the naked eye. The time domain features cannot provide high discrimination among different normal and abnormal beats. In order to increase the discrimination among classes, various transform domains need to be used .Various contributions have been made in literature regarding beat detection and classification of ECG signal. Most of them use either time or frequency domain representation of the ECG waveforms, on the basis of which many specific features are defined, allowing the recognition between the beats belonging to different classes. The most difficult problem faced by today’s automatic ECG analysis is the large variation in the morphologies of ECG waveforms. Moreover, we have to consider the time constraints as well. Thus our basic objective is to come up with a simple method having less computational time without compromising with the efficiency. With this objective in mind, various techniques of ECG preprocessing, R-peak detection, future extraction, feature enhancement and classification has been searched and experimented. In this thesis, R-peak detection of ECG signal is implemented using Pan-Tompkins algorithm and the features were extracted from time, frequency and statistical domain for a precise and robust feature extraction and classification. The classification has been done using neural network back propagation algorithm, taking the features as temporal features, heart beat interval features and ECG statistical features.
1.3 Aim and Objectives
The main aim of this thesis is to develop a simple and reliable automatic ECG beat detection and classification system using a hybrid algorithm by combining a well known Pan Tompkins algorithm with discrete wavelet and stationary wavelet decomposition combined with statistical parameters in order to increase the accuracy of detection and classification, the ECG diagnostic system can recognized four ECG waveforms (Normal, Paced, Rbbb and Lbbb) and classify them accordingly. The above aim would be achieved through the following objectives
1. To review the literature on ECG preprocessing, feature extraction, and classification techniques
2. To extract morphological features from Pan-Tompkins algorithm as R-T interval after QRS detection
3. To apply wavelet transform for extraction of the transform coefficients using DWT and SWT as well as to search for a suitable wavelet.
4. To calculate statistical parameters from the DWT and SWT coefficients as a new feature for classification
5. To search for other feature extraction methods by looking at other ECG characteristics like R-R time intervals and R-peak amplitude
6. To use artificial neural networks for ECG waveform classification
7. To carry out comparative performance analysis with different methods developed in order to find a robust and efficient feature extraction and classification technique 8. To explore the features of eZ430-RF2500 wireless development tool by designing
simple low cost wireless ECG acquisition system
9. To make suggestions on the feature improvement of the system and the development of the system into a real time diagnostic system.
1.4 Organization of the Report
In order to provide a continuous and smooth flow of information about the whole work, this thesis consists of seven chapters and organized as follows:
Chapter one is an introduction of the project. This chapter discusses the general research background information, challenges and problems associated with the study and proposed solution. Thesis significance, aim and objectives were presented. Chapter two presents the anatomy of human heart, its physiology, ECG leads and theories of arrhythmias used in the thesis. Chapter three gives a theoretical background information about wavelet transform including discrete wavelet transform and stationary wavelet transform, it also discuss a literature of wavelet entropy and artificial neural networks. Chapter four presents all the methods developed in realizing the feature sets. Also, it explains the tools used in this thesis
including Matlab toolboxes. Chapter five presents the results of the proposed system, discussion and comparative analysis. Chapter six gives information on hardware implementation of wireless ECG acquisition circuit, including background information, features of the components used, design and the result of the system. Lastly, chapter seven concludes the research and gives further suggestions and recommendations for future development and improvement.
CHAPTER TWO
ANATOMY OF THE HEART AND ELECTROCARDIOGRAPHY 2.0 Overview
A main study of this research is to detect abnormal signals generated by the human heart; hence, a substantial understanding of the source of this signal is essential. The human heart is at the center of the cardiovascular system, which is responsible for oxygenating blood and delivering it to different parts of the human body. Electrodes placed on the body’s surface can detect electrical activity, which occurs in the heart. The recording of these electrical events comprises an electrocardiogram. Comparison of the information obtained from electrodes, placed in different positions on the body, enables electrical activity to be monitored and so the performance of different areas of cardiac tissue. This chapter commences with a review of the cardiovascular system and electrophysiology. This is followed by an examination of the conduction system of the heart, electrocardiogram, ECG leads, heart problems, and the brief information about the arrhythmias used in this study with their related literature.
2.1 The Heart Anatomy
The heart contains four chambers that is right atrium, left atrium, right ventricle, left ventricle and several atrioventricular and sinoatrial node as shown in Figure 2.1. The two upper chambers are called the left and right atria, while the lower two chambers are called the left and right ventricles. The atria are attached to the ventricles by fibrous, non-conductive tissue that keeps the ventricles electrically isolated from the atria. The right atrium and the right ventricle together form a pump to circulate blood to the lungs. Oxygen-poor blood is received through large veins called the superior and inferior vena cava and flows into the right atrium. The right atrium contracts and forces blood into the right ventricle, stretching the ventricle and maximizing its pumping (contraction) efficiency. The right ventricle then pumps the blood to the lungs where the blood is oxygenated. Similarly, the left atrium and the
left ventricle together form a pump to circulate oxygen-enriched blood received from the lungs (via the pulmonary veins) to the rest of the body (Acharya re al., 2012).
2.1.1 Heart valves
There are 4 heart valves that dictate the blood flow through the human heart. The valves are unidirectional to prevent back flow of blood into the atria or ventricles. The valves open when there is a change of pressure in the chambers. The valves can be distinguished as two groups, the atrioventricular (AV) and the semilunar (SL) valves. Atrioventricular (AV) valves are relatively small compared to the semilunar valves. Their function is to ensure that blood does not flow back into the atrium from the ventricles during systole, the contraction of the heart. The mitral valve, in the left chamber, and the tricuspid valve, in the right chamber are considered as atrioventricular (AV) valves. The Aortic and Pulmonary valve are considered to be the Semilunar (SL) valves, which prevents blood flowing back from the arteries into the ventricles during systole. The Aortic valve is located between the left ventricle and the aorta, as the pulmonary valve is between the right ventricle and the pulmonary artery (Texas, 2014).
2.1.2 Circulatory system
A single cardiac cycle is the time between the start of one heartbeat and the beginning of the next. It, therefore, includes alternating periods of contraction and relaxation. For each of the heart chambers the cardiac cycle can be divided into two phases. During contraction, or systole, the chamber contracts and blood is pushed into an adjacent chamber or arterial trunk. Diastole follows systole. During diastole, the chamber fills with blood and prepares for the next cardiac cycle. The pressure within each chamber rises during systole and falls during diastole. The valves help to ensure that the blood flows in the correct direction. However, blood will only flow from the first to the second chamber, if the pressure in the first chamber is greater than that of the second. The correct pressure relationship is dependent on the timing of contractions. Blood movement would not occur if the atria and ventricle contacted together.
The heart, like other organs, also requires an adequate supply of oxygen and nutrients. These are supplied from arterial branches that arise from the ascending aorta. The flow of blood that supplies the heart tissue itself is called the coronary circulation. The heart pumps about 380 litres of blood to its own muscle tissue every day (Molly, 2000).
2.1.3 The Electrical Conduction System of the Heart
During a single heartbeat, the entire heart contracts in a coordinated manner. Thus blood flows in the right direction at the proper time. Contractile cells, and the conducting system, are the cardiac muscle cells involved in a normal heartbeat. Gap junctions connect all heart muscle cells, including the cells of the conduction system, to each other. These gap junctions make it easier for impulses to spread between adjacent cells. So, immediately after a heart cell depolarizes, the cells around it depolarize. In this way, a wave of excitation and contraction spreads over the entire heart (Wolters, 2011).
The conduction system of the heart shown in Figure 2.2 consists of the sinoatrial (SA) node, bundle of His, atrioventricular (AV) node, the bundle branches, and Purkinje fibers.
The SA node serves as a pacemaker for the heart, and it provides the trigger signal. It is a small bundle of cells located on the rear wall of the right atrium, just below the point where superior vena cava is attached. The SA node fires electrical impulses through the bioelectric mechanism. It is capable of self-excitation (firing on its own).
When the SA node discharges a pulse, the electrical current spreads across the atria, causing them to contract. Blood in the atria is forced by the contraction through the valves to the ventricles. There is a band of specialized tissue between the SA node and the AV node, however, in which the velocity of propagation is faster than it is in atrial tissue. This internal conduction pathway carries the signal to the ventricles.
It would not be desirable for the ventricles to contract in response to an action potential before the atria are empty of their contents. A delay is needed, therefore, to prevent such an occurrence; this is the function of the AV node. The action potential will reach the AV node 30 to 50 ms after the SA node discharges, but another 110 ms will pass before the pulse is transmitted from the AV node. The AV node operates like a delay line to retard the advance of the action potential along the internal electroconduction system toward the ventricles. Conduction into the bundle branches is rapid, consuming only another 60 ms to reach the furthest Purkinje fibers. The muscle cells of the ventricles are actually excited by the Purkinje fibers. The action potential travels along these fibers at a much faster rate, on the order of 2 to 4 m/s. The fibers are arranged in two bundles, one branch to the left and one to the right.
The normal rhythm of the heart is disturbed if the conducting pathways are damaged. If the SA or internodal pathways are damaged, the AV node will take over. The heart will beat at a slower rate. If a conducting cell or ventricular muscle cell generates an action potential more rapidly than the SA or AV node, then this is called
an ectopic pacemaker. This will bypass the conducting system and disrupt the timing of ventricular contraction. This will result in a reduction of the efficiency of the heart, and may be diagnosed with an electrocardiogram (Molly, 2000).
2.2 Electrocardiogram
Electrocardiogram (ECG) is a diagnosis tool that reported the electrical activity of heart recorded by skin electrode. The morphology and heart rate reflects the cardiac health of human heart beat (Acharya, 2012). It is a noninvasive technique that means this signal is measured on the surface of human body, which is used in identification of the heart diseases (Germann, 2002). Any disorder of heart rate or rhythm, or change in the morphological pattern, is an indication of cardiac arrhythmia, which could be detected by analysis of the recorded ECG waveform. The amplitude and duration of the P-QRS-T wave contains useful information about the nature of disease afflicting the heart. The electrical wave is due to depolarization and repolarization of Na+ and k ions in the blood. The ECG signal provides the following information of a human heart (Moss, 1996):
heart position and its relative chamber size impulse origin and propagation
heart rhythm and conduction disturbances
extent and location of myocardial ischemia changes in electrolyte concentrations drug effects on the heart.
2.3 Leads in ECG
There are 3 general types of ECG, the 3-Lead, 5-Lead and 12-Lead, each type differs in the number of electrodes used and the positioning of the electrodes.
The 3-lead ECG is the most basic type of monitoring, adopting the Einthoven’s triangle arrangement where 3 electrodes are required. This group of electrodes is known as limb lead. According to the American Heart Association (AHA), the 3 electrodes are colored: white, black and red, and is labeled as the right-arm (RA), the left-arm (LA) and the left-limb (LL), respectively. Each electrode has different electrical polarity; hence, the direction of the current flow has to be addressed for each lead. The RA electrode has negative polarity and it is physically placed at the right collarbone area of the subject. The LL electrode has positive polarity and it is placed at the bottom left area of the ribcage. The LA electrode is negative polarity when paired with LL and positive polarity when paired with RA; it is physically placed at the right collarbone area of the subject. RA-LA (lead 1), RA-LL (lead 2) and LA-LL (lead 3) denotes the 3 lead pairings, each monitors different parts of the heart, as shown in Figure 2.3.
Table 2.1: types of leads used in ECG monitoring
Standard leads Limb leads Chest leads Bipolar leads Unipolar leads Unipolar leads
Lead I Lead II Lead III AVR AVF AVL V1 V2 V3 V4 V5 V6
Einthoven leads:
Lead I: records potentials between the left and right arm, Lead II: between the right arm and left leg, and
Lead III: those between the left arm and left leg
Another ECG monitoring type is the 5-lead ECG. This method uses the limb leads (RA, LA and LL) with two additional electrodes lead pairings. The additional electrodes are the chest lead (V1) and the right-limb (RL). The chest lead (V1) electrode is colored brown and has negative polarity; it is physically placed at the 4th interscostal space on right sternal border. Lead V1 captures the best waveform that can be used reliably to determine between SVT and VT. The right-limb (RL) electrode is colored green and has positive polarity; it is physically placed on the opposite side of the left-limb (LL) electrode. Lead RL is used as a complement to lead V1, to provide positive polarity. The advantages of the 5-lead ECG are that it provides a more comprehensive electrical view of the heart with additional leads; another advantage is that it helps to increase detection of an episode in ischemic monitoring.
Figure 2.3: (a)The Einthoven Triangle for 3-lead ECG configuration(Klabunde, 2008) (b)12-lead ECG configuration(Tompkins, 2008)
The 12-lead ECG monitoring of the heart is the most comprehensive technique, it allows the electrical activity of the heart to be observed from three areas, anterior, interior and lateral. It uses the 3 limb leads (RA, LA, LL) and the 6 chest leads (V1-6) to acquire the ECG signal. The limb leads are used as bipolar and unipolar leads to complete 6 orientation of the frontal plane. The chest leads are unipolar and are placed across the patient mid-chest area; this lead placement captures the horizontal plane electrical activity of the heart. The placement for 12-lead ECG is shown in Figure 2.3b. The advantage of the 12-lead ECG is that medical experts can diagnose more specific arrhythmias with the full observation of the heart from three areas. Another advantage is that changes in the ECG segments from different lead can help to locate the cause of the arrhythmia (Fook, 2012).
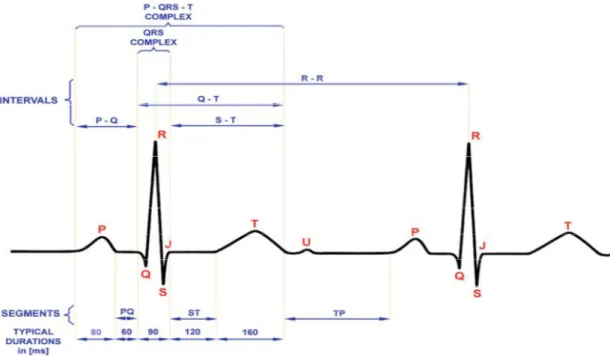
2.4 ECG waves and interval
Figure 2.4 shows useful clinical signatures of ECG, durations and intervals commonly used for clinical diagnosis.
Figure 2.4: Typical shape of ECG signal and its essential waves and characteristic points (Adam and Witold 2012)
2.4.1 The P wave
The propagation of the SA action potential through the atria results in contraction of the atria, producing the P wave. The magnitude of the P wave is normally low (50-100uV) and 100msec in duration.
2.4.2 The PR interval
The PR interval begins with the onset of the P wave and ends at the onset of the Q wave. It represents the duration of the conduction through the atria to the ventricles. Normal measurement for PR interval is 120ms-200ms.
The PR segment begins with the endpoint of the P wave and ends at the onset of the Q wave. It represents the duration of the conduction from the atrioventricular node, down the bundle of its end through the bundle branches to the muscle.
2.4.3 The QRS complex
The QRS complex corresponds to the period of ventricular contraction or depolarization. The atrial repolarization signal is swamped by the much larger ventricular signal. It is the result of ventricular depolarization through the Bundle Branches and Purkinje fibre.
The QRS complex is much larger signal than the P wave due to the volume of ventricular tissue involved. If either side of the heart is not functioning properly, the size of the QRS complex may increase.QRS can be measured from the beginning of the first wave in the QRS to where the last wave in the QRS returns to the baseline. Normal measurement for QRS is 60ms-100ms.
2.4.4 The ST segment
The ST segment represents the time between the ventricular depolarization and the repolarization. The ST segment begins at the end of the QRS complex (called J point) and ends at the beginning of the T wave. Normally, the ST segment measures 0.12 second or less. The precise end of the depolarization (S) is difficult to determine as some of the ventricular cells are beginning to repolarise.
2.4.5 The T wave
The T wave results from the repolarization of the ventricles and is of a longer duration than the QRS complex because the ventricular repolarization happens more slowly than depolarization. Normally, the T wave has a positive deflection about 0.5mv, although it may have a negative deflection. It may, however, be of such low amplitude that it is difficult to read. The duration of the T wave normally measures 0.20 sec or less.
2.4.6 The QT interval
The QT interval begins at the onset of the Q wave and ends at the endpoint of the T wave, representing the duration of the ventricular depolarization/repolarization cycle.
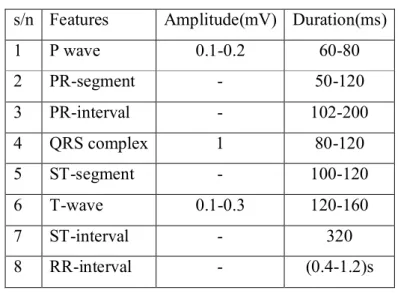
Table 2.2 Amplitude and duration of waves, intervals and segments (Frank, 2014)
The normal QT interval measures about 0.38 second, and varies in males and females and with age. As a general rule, the QT interval should be about 40 percent of the measured R-R interval (Dubowik, 1999).
s/n Features Amplitude(mV) Duration(ms)
1 P wave 0.1-0.2 60-80 2 PR-segment - 50-120 3 PR-interval - 102-200 4 QRS complex 1 80-120 5 ST-segment - 100-120 6 T-wave 0.1-0.3 120-160 7 ST-interval - 320 8 RR-interval - (0.4-1.2)s
2.5 Heart Diseases
In the early 1980, according to the Centers for Disease Control and Prevention, United States (2007), heart disease is the leading cause of death for both women and men almost in the world and it is also a major cause of disability. In the worldwide, coronary heart disease kills more than 7 million people each year. Heart disease is a broad term that includes several more specific heart conditions which are coronary heart disease, heart attack, ischemia, arrhythmias, cardiomyopathy, congenital heart disease, peripheral arterial disease (PAD). The most common heart condition is coronary heart disease, which can lead to heart attack and other serious conditions and the research from PubMed Central Journals (2007) shows that the Ischemia is the most common cause of death in the industrialized countries. So the earliest diagnosis and treatment using electrocardiography (ECG) has been developed to observe the disease signal. (Papaloukas et al. 2003) has indicated that the development of suitable automated analysis techniques can make this method very effective in supporting the physician’s diagnosis and in guiding clinical management.
2.5.1 Heart Problems in This Thesis
Changes from the normal morphology of the ECG can be used to diagnose many different types of arrhythmia or conduction problems. ECG can be split into different segments and intervals, which relate directly to phases of cardiac conduction. Limits can be set on these to diagnose abnormality.
There are lots of heart problems which can be diagnosed from different ECG waveforms. This thesis aims at classifying 4 different waveforms. They are: Normal (N), Right Bundle Branch Block (R or RBBB) Paced Beats (P) and Left Bundle Branch Block (L or LBBB). They will be explained as follows (Wartak J., 1978).
2.5.2 Normal Waveform
This is the normal adult human waveform with features described as in previous section.
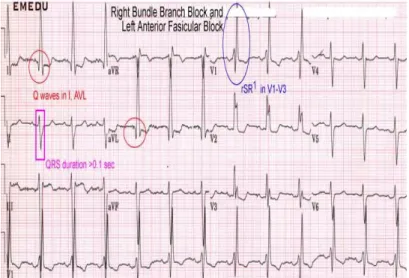
2.5.3 Right Bundle Branch Block
Right Bundle Branch Block (RBBB) shown in Figure 2.5 has the following ECG characters (KCUMB, 2006):
The QRS duration between 0.10 and 0.11 sec (incomplete RBBB) or 0.12sec or more (complete RBBB) as shown in Figure 2.6 and 2.7.
Prolonged ventricular activation time or QR interval (0.03sec or more in V1-V2) Right axis deviation (Figure 2.8).
Incomplete RBBB often produce patterns similar to those of right ventricular hypertrophy.
The ECG pattern of RBBB is frequently associated with ischemic, hypertensive, rheumatic and pulmonary heart disease, right ventricular hypertrophy and some drug intoxication; occasionally it may be found in healthy individuals.
Figure 2.6: Right bundle branch block with markup (Emedu, 2012)
Figure 2.7: Sinus rhythm with intermittent Right bundle branch block (Emedu, 2012)
2.5.4 Paced Beats
This is the artificial beat form from the device called pacemaker. A pacemaker is a treatment for dangerously slow heart beats. Without treatment, a slow heart beat can lead to weakness, confusion, dizziness, fainting, shortness of breath and death. Slow heart beats can be the result of metabolic abnormalities or occur as a result of blocked arteries to the heart’s conduction system. These conditions can often be treated and a normal heart beat will resume. Slow heart beats can also be a side effect of certain medications in which case discontinuation of the medicine or a reduction in dose may correct the problem. It can be characterized in ECG by a large peak after QRS complex.(intelligent recognition)
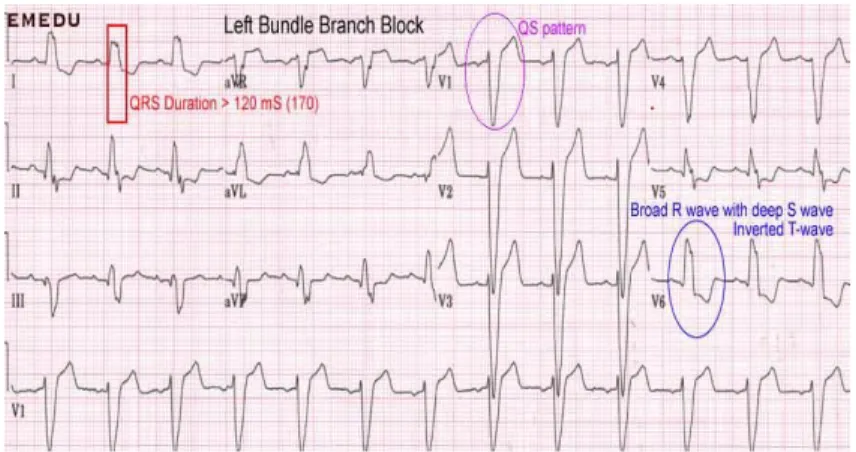
2.5.5 Left bundle branch block
In this condition, activation of the left ventricle is delayed, which causes the left ventricle to contract later than the right ventricle as shown in Figure 2.9. It has the following characteristics (KCUMB, 2006):
A complete LBBB has a QRS of greater than 0.12sec (Figure 2.10)
Normally the septum is activated from left to right, producing small Q waves in the lateral leads.
As the ventricles are activated sequentially (right, then left) rather than simultaneously, this produces a broad or notched (‘M’-shaped) R wave in the lateral leads as shown in Figure 2.11.
Normally the septum is activated from left to right, producing small Q waves in the lateral leads.
Amongst the causes of LBBB are: Aortic stenosis
Dilated cardiomyopath Acute myocardial infarction
Extensive coronary artery disease
Primary disease of the cardiac electrical conduction system
Long standing hypertension leading to aortic root dilatation and subsequent aortic regurgitation
Lyme disease Treatment
Patients with LBBB require complete cardiac evaluation, and those with LBBB and syncope or near-syncope may require a pacemaker.
Some patients with LBBB, a markedly prolonged QRS (usually > 150 ms), and systolic heart failure may benefit from a biventricular pacemaker, which allows for better synchrony of heart contractions (Stevenson et al., 2011).
Figure 2.10: Left bundle branch block with markup (Emedu, 2012)
Figure 2.11: Sinus tachycardia with Left bundle branch block (Emedu, 2012)
CHAPTER THREE WAVELET TRANSFORM AND NEURAL NETWORK
3.0 Overview
Wavelet Transform has been proposed as an alternative way to analyze the non-stationary biomedical signals, which expands the signal onto the basis functions. The wavelet method act as a mathematical microscope in which we can observe different parts of signal by just adjusting the focus. A conventional application of wavelet methods to processing of a medical waveform uses a wavelet transform based on the application of a single wavelet, rather than a basis set constructed from a family of mathematically related wavelets. Again, the choice of a wavelet with appropriate morphological characteristics relative to the physiological signal under consideration is crucial to the success of the application. Therefore this chapter gives a brief review of wavelet transforms and its application to biomedical signals. Also, the chapter discusses the theory of wavelet entropy and artificial neural network.
3.1 Mathematical Transformation
Mathematical transformations are applied to signals to obtain further information from that signal that is not readily available in the raw signal. There are a number of transformations that can be applied, among which the Fourier transforms are probably by far the most popular. When we plot time-domain signals, we obtain a time-amplitude representation of the signal. This representation is not always the best representation of the signal for most signal processing related applications. In many cases, the most distinguished information is hidden in the frequency content of the signal. The frequency spectrum of a signal is basically the frequency components (spectral components) of that signal. The frequency spectrum of a signal shows what frequencies exist in the signal.
The Fourier transform is defined mathematically as:
( ) = ∫ ( ) (3.2) 3.1.1 Why do we need the frequency information?
Often times, the information that cannot be readily seen in the time-domain can be seen in the frequency domain. Let's give an example from biological signals. Suppose we are looking at an ECG signal (ElectroCardioGraphy, graphical recording of heart's electrical activity). The typical shape of a healthy ECG signal is well known to cardiologists. Any significant deviation from that shape is usually considered to be a symptom of a pathological condition.
This pathological condition, however, may not always be quite obvious in the original time-domain signal. Cardiologists usually use the time-domain ECG signals which are recorded on strip-charts to analyze ECG signals. Recently, the new computerized ECG recorders/analyzers also utilize the frequency information to decide whether a pathological condition exists. A pathological condition can sometimes be diagnosed more easily when the frequency content of the signal is analyzed.
The big disadvantage of a Fourier expansion however is that it has only frequency resolution and no time resolution. This means that although we might be able to determine all the frequencies present in a signal, we do not know when they are present. To overcome this problem in the past decades several solutions have been developed which are more or less able to represent a signal in the time and frequency domain at the same time.
Although FT is probably the most popular transform being used (especially in electrical engineering), it is not the only one. There are many other transforms that are used quite often by engineers and mathematicians. Hilbert transform, short-time Fourier transform, Wigner distributions, the Radon Transform, and of course our featured transformation, the wavelet transform, constitute only a small portion of a huge list of transforms that are available at engineer's and mathematician's disposal. Every transformation technique has its own area of application, with advantages and disadvantages, and the wavelet transform (WT) is no exception.
3.2 Stationarity of a Signal
Signals whose frequency content does not change in time are called stationary signals. In other words, the frequency content of stationary signals does not change in time. In this case, one does not need to know at what times frequency components exist, since all frequency components exist at all times.
For example, consider the following signal
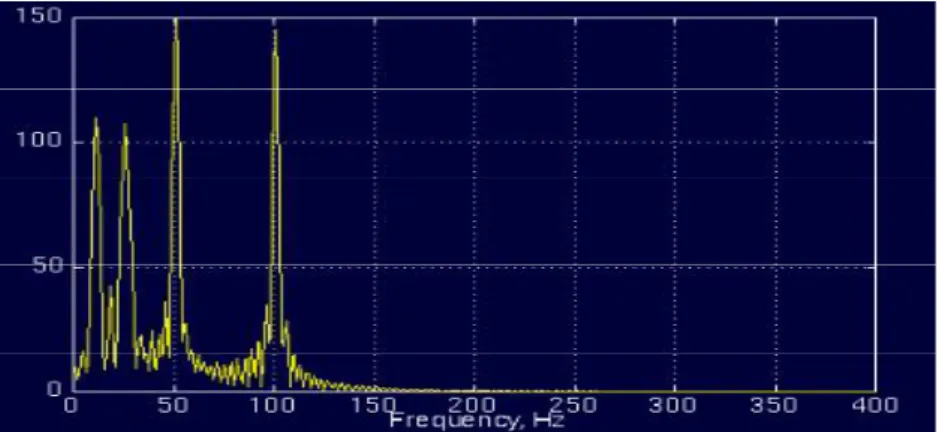
( ) = cos(2 10 ) + cos(2 25 ) + cos(2 50 ) + cos (2 100 ) (3.3)
is a stationary signal, because it has frequencies of 10, 25, 50, and 100 Hz at any given time instant. This signal is plotted below:
Figure 3.1: Time domain plot of signal in equation 3.1 (Robi, 2006)
And the following is its FT:
Figure 3.3: Time domain plot of non-stationary signal (Robi, 2006)
Contrary to the signal in the Figure above, Figure below plots a signal with four different frequency components at four different time intervals, hence a non-stationary signal. The interval 0 to 300 ms has a 100 Hz sinusoid, the interval 300 to 600 ms has a 50 Hz sinusoid, the interval 600 to 800 ms has a 25 Hz sinusoid, and finally the interval 800 to 1000 ms has a 10 Hz sinusoid.
And the following is its FT:
Figure 3.4: Fourier transform of figure 3.3 (Robi, 2006)
FT gives the spectral content of the signal, but it gives no information regarding where in time those spectral components appear. Therefore, FT is not a suitable technique for non-stationary signal, with one exception: FT can be used for non-stationary signals, if we are only interested in what spectral components exist in the signal, but not interested where these occur. However, if this information is
needed, i.e., if we want to know, what spectral component occur at what time (interval), then Fourier transform is not the right transform to use (Robi, 2006).
For practical purposes it is difficult to make the separation, since there are a lot of practical stationary signals, as well as non-stationary ones. Almost all biological signals, for example, are non-stationary. Some of the most famous ones are ECG (electrical activity of the heart, electrocardiograph), EEG (electrical activity of the brain, electroencephalograph), and EMG (electrical activity of the muscles, electromyogram).
3.3 The Short Term Fourier Transforms (STFF)
The STFT is obtained by calculating the Fourier transform of a sliding windowed version of the time signal s(t). The location of the sliding window adds a time dimension and one gets a time-varying frequency analysis.
The mathematical representation of STFT is:
( , ) = ∫ ∞ ( ) ( − ) (3.2)
Where ( − ) it is the sliding window applied to the signal s(t) , f is the frequency and t is the time.
The length of the window is chosen so that to maintain signal stationary in order to calculate the Fourier transform. To reduce the effect of leakage (the effect of having finite duration), each sub-record is then multiplied by an appropriate window and then the Fourier transform is applied to each record. As long as each sub-record does not contain rapid changes the spectrogram will give an excellent idea of how the spectral composition of the signal has changed during the whole time record. However, there exist many physical signals whose spectral content is so rapidly changing that finding an appropriate short-time window is problematic, since there may not be any time interval for which the signal is stationary. To deal with these time changes properly it is necessary to keep the length of the time window as short
as possible. This, however, will reduce the frequency resolution in the time-frequency plane. Hence, there is a trade-off between time and time-frequency resolutions.
3.4 Wavelet Theory
Wavelet theory is the mathematics associated with building a model for a signal, system, or process. A wavelet is a wave which has its energy concentrated in time. It has an oscillating wavelike characteristic but also has the ability to allow simultaneous time and frequency analysis and it is a suitable tool for transient, non-stationary or time-varying phenomena. WT has a varying window size, being broad at low frequencies and narrow at high frequencies, thus leading to an optimal time-frequency resolution in all time-frequency ranges.
Figure 3.5: Sinusoidal signal and Deubecheis wavelet (Michel et al. 1996)
From the figure above, the signals with sharp changes might be better analyzed with an irregular wavelet than with a smooth sinusoid, as quoted in (Mahmoodabadi et al. 2005). Also, local features can be described better with wavelets that have local extent.
3.4.1 Continuous Wavelet Transform (CWT)
The continuous wavelet transform was developed as a method to obtain simultaneous, high resolution time and frequency information about a signal. The CWT rather than the STFT uses a variable sized window region .Because the wavelet may be dilated or compressed; different features of the signal are extracted. While a narrow wavelet extracts high frequency components, a stretched wavelet picks up on the lower frequency components of the signal.
The CWT is computed by correlating the signal s(t) with families of time-frequency atoms Ψ (t), it produce a set of coefficients C( ,s) given by :
( , ) =
√ ∫ ( )Ψ ∗ ( )
∞
(3.3)
Where
is the time location(translation parameter)
s is called scale factor and it is inversely proportional to the frequency (s > 0) *dénotes a complexe conjugate.
Ψ (t) is the analysing wavelet (mother wavelet).
The term mother implies that the functions with different region of support that are used in the transformation process are derived from one main function, or the mother wavelet. In other words, the mother wavelet is a prototype for generating the other window functions.
The analyzing wavelet function Ψ(t) should satisfy some properties. The most important ones are continuity, integrability, square integrability, progressivity and it has no d.c component (Hannu, 2011).
3.4.2 Discrete Wavelet Transform
The Discrete Wavelet Transform (DWT), which is a time-scale representation of the digital signal is obtained using digital filtering techniques, is found to yield a fast computation of wavelet transform. It is easy to implement and adopts dyadic scales and translations in order to reduce the amount of computation time, which results in better efficiency of calculation.
The DWT which also referred to as decomposition by wavelet filter banks is computed by successive low pass filter (LPF) and high pass filtering (HPF) of the discrete time-domain signal as the process shown graphically in figure below
Figure 3.6: Filter banks signal decomposition (Nor, 2010)
The different cutoff frequencies are used for the analysis of the signal at different scales to measure the amount of detail information in the signal and the scale is determined by upsampling and downsampling process where D and A denoting for details and approximations, while c representing coefficients. The approximations of the signal are what define its identity while the details only imparts nuance.
Figure 3.7: Three level Wavelet decomposition tree (Nor and Binti, 2010)
Figure 3.7 show the decomposition process is iterative. It connects the continous-time multiresolution to the discrete-time filters. The signal is denoted by the sequence input signals [ ], where n is an integer passed through a series of high-pass filters to analyze the high frequencies, and through a series of low-pass filters to analyze the low frequencies. Each stage consists of two digital filters and