Allocation of Component Types to Machines in
the Automated Assembly of Printed Circuit
Boards
1
Mehmet Bayram Yildirim
Wichita State University, Industrial and Manufacturing Engineering Department, 1845 Fairmount Wichita, KS 67260-0035, USA
bayram.yildirim@wichita.edu
Ekrem Duman2
Dogus University, Industrial Engineering Department, Zeamet Sok. No.21, Acibadem, Istanbul, Turkey
eduman@dogus.edu.tr
Dilek Duman
Intertech Information Technology and Marketing Inc., Kasap Sok. No.15, Esentepe, Istanbul, Turkey
dilek.duman@intertech.com.tr
Coskun Cetinkaya
Wichita State University, Department of Electrical and Computer Engineering, 1845 Fairmount Wichita, KS 67260-0044, USA
coskun.cetinkaya@wichita.edu
1 An earlier version of this paper which has been presented at ISCIS'06: The 21st International Symposium on Computer and Information Sciences, November 1-3, 2006 Istanbul, Turkey, has been published in Lecture Notes in Computer Science [18].
2 The corresponding author
Abstract— Although the use of electronic component placement machines has brought reliability and speed to the printed circuit board (PCB) assembly process, to get higher utilization, one needs to solve the resulting complex operations research problems efficiently. In this study, the problem of distributing the assembly workload to two machines deployed on an assembly line with two identical component placement machines to minimize the line idle time is considered. This problem is NP-Complete even in its simplest form. A mathematical model and several heuristics have been proposed to solve this problem efficiently.
Index Terms— Printed Circuit Board Assembly, Load Balancing, Heuristics
I. INTRODUCTION
The use of numerically or computer controlled electronic component placement machines in assembling printed circuit boards (PCB) brings major gains in productivity and efficiency through their fast, error free and reliable component placement operations. To utilize these automatic machines efficiently, serious planning and scheduling decisions should be made on the production floor. Some of these decisions are 1) allocation of component types to machines, 2) determination of board production sequence, 3) allocation of component types to feeder cells (feeder configuration) and 4) optimization of component placement sequence. All these problems are
interdependent, i.e., the solution of any problem affects the solution of others. Such interdependency is more evident between the first two and last two problems. When a global optimal production strategy is sought, all four problems should be solved simultaneously. However, since each of these problems is quite complex by itself (i.e., they are generally NP-hard), trying to build and solve a monolithic model is quite difficult and intractable. Hence, usually, these problems are solved separately and iterative solution methods are deployed to cope with the interaction between them.
In this study, the component allocation problem, the first one of the four major problem classes of the automated assembly of PCBs, is considered. Note that, component allocation problem can be classified as machine load balancing problem in the broad sense.
The literature on PCB assembly problems is quite extensive. However, most of the literature is related to the feeder configuration and placement sequencing problems. A general overview of PCB assembly problems is given by McGinnis et al. [2] and Ji and Wan [3]. Francis and Horak [4] consider the problem of choosing the numbers of reels of each type of components to be used in populating a printed circuit board by a SMT machine. The objective is to maximize the length of an uninterrupted machine production run, while using no more slots for reels than are available. Carmon et al. [5] minimize the total setup time to change the feeder
configuration and propose the group set-up (GSU) method (grouping similar boards), which can significantly reduce set-up times. Askin et al. [6] address the problem of minimizing the makespan for assembling a batch of boards with a secondary objective of reducing the mean flow time. Ben-Arieh and Dror [7] study the problem of assigning component types to insertion machines with the aim of balancing the workload assigned to machines. The study of Ho and Ji [8] is one of the few studies attempting to solve two PCB assembly problems (feeder configuration and placement sequencing) simultaneously.
Sadiq et al. [9] propose an iterative approach that minimizes the total production time for a group of PCB assembly jobs on a single machine when the sequencing and allocation of different component reels to feeder carriage are considered together. Ahmadi et al. [10] consider a placement machine, which features two fixtures for the delivery of components to the placement heads. They investigate the case where all components are accessible and the case of a static pick sequence. Crama et al. [11] propose a heuristic hierarchical approach to optimize the throughput rate of a line of several component placement machines with three placement heads, all devoted to the assembly of a single type of PCB. Given a line of placement machines and given a family of boards Klomp et al. [12] propose a heuristic for the feeder rack assignment problem. Hillier and Brandeu [13] develop the Cost Minimizing Workload Balancing Heuristic to balance the workload among the semi-automatic placement machines and the manual assembly stations. Some of the other related studies can be found in [14, 15, 16].
In the next section, the description and formulation of the problem setting considered in this study are given. The description of the full set of solution procedures investigated can be found in section three. In section four, the results and performances of these algorithms on randomly generated test problems are discussed. One of the most promising algorithm is discussed in details. The results of the algorithms are improved significantly using an exchange procedure. Finally, in section five, the concluding remarks are given.
II.PROBLEM DESCRIPTION AND FORMULATION
The form of the load balancing (component allocation) problems in automated PCB assembly shows a large variability. Some of the parameters that determine the underlying component allocation problem setting are differences in machine architecture (type), characteristics of the production processes and engineering preferences. More specifically these parameters could be the speed of machines, the number and type of feeder cells on each machine, nozzle types that each machine can use, batch or continuous processing, set-up time requirements to change feeder configurations, product mix and volume, the number of machines of each type, demand structure, component replenishment time, the number of placement machines a PCB visits during assembly, frequency and duration of changes in feeder configuration. As a result,
the number of different load balancing problems can be as large as the number of PCB assembly facilities.
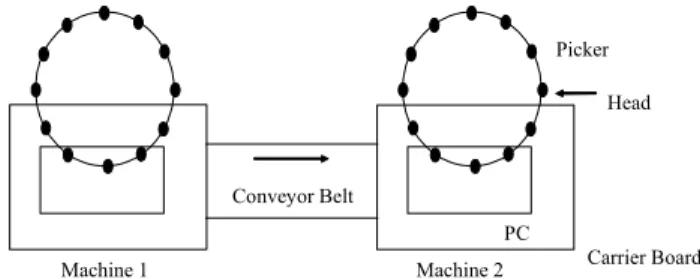
In this study, the machine type considered is one with a component pickup device, stationary placement head and moving carrier board. In this machine, circular shaped turning component pickup device takes the role of the sequencer machine. The component tape is placed along the perimeter of the device and performs each placement just after the desired precise placement location is aligned beneath the head currently over the carrier board. The pickup device, which usually has 20 to 120 heads, picks up the components to its heads in the placement order from the component tapes. The placement sequencing problem turns out to be a Chebyshev Traveling Salesman Problem and the layout of the component tapes can be formulated as a simple allocation problem [1]. Two examples of this type of machines are the Universal 6287A and the Dynapert Intellisert V12000 axial component placement machines.
Figure 1. Two Placement Machines on a Line.
The boards are populated by two machines sequentially. There is a conveyor belt between the machines, which carries the partially completed boards from machine 1 to machine 2 (see figure 1). For this assembly environment case, the following assumptions are undertaken regarding the load balancing problem:
A1. Machines are identical. In other words, they have the same speed, the same nozzle sets and the same number of feeder locations.
A2. Component types are also identical in regard to their slot requirements in the feeder area and the same nozzle can be used for all component types in the assembly process.
A3. Assembly of a new board cannot start unless both machines are cleared by the currently assembled board. A4. The total number of component types is equal to the total number of feeder locations on two machines.
A5. There is no sequence dependent setup time when production switches between different board types. A6. The total number of component types to be populated on any PCB type is larger than the feeder capacity of either machine, so that each board type requires both machines to be fully assembled.
A7. The demand for PCB types are known and fixed for the planning period under consideration.
A8. The placement of each component takes unit time. A9. The production environment is high-mix, low-volume.
Machine 1 Carrier Board PC
Picker Head
Machine 2 Conveyor Belt
A10. The setup times incurred in changing a component type in the feeder are very high.
A11. Since the boards are reliably transferred by the conveyor belt, there is no engineering preference regarding population of the PCBs on a single machine. A12. Buffer of partially completed boards is not desired due to the engineering preferences.
The objective is to partition the set of component types into two to maximize the average production rate. In other words, our objective is to distribute the component types to the two machines so that, the workload among the machines has a good balance regarding each particular board type.
The problem stated above can be formulated as an integer program. First, we will introduce the notation. Let i be the component type index (i=1,..,n), j be the board type index (j=1,..,m), aj be the number of boards of type
j to be produced, Pij be the number of components of type
i to be placed on board type j and F be the feeder capacities of machine 1 and machine 2
In this problem, the decision is to assign the components to different machines in such a way that the total processing time required to process all of the demand on a machine is as close to the total amount of processing on the other machine. Note that we assume the
total processing time is proportional to the total number of components placed. The decision variables are
1 if component type is assigned to machine 1 0 otherwise
i
i X = ⎨⎧
⎩
Now, the problem can be formulated similar to [7] as follows: where 1 1 (1 ) n n i ij i ij i i X P X P = = − −
∑
∑
reflects the total waiting(idle) time or imbalance of the machines for a particular board type j. As a result, in the above formulation, the objective function (1) shows the sum of the machine workload imbalances resulting from the assembly of each particular board type. Using constraint (2), it is ensured that the workload assigned to machine 1 is greater than or equal to the workload assigned to machine 2. This guarantees that a smaller amount of work-in-process inventory is accumulated between two machines. Constraint (3) is the feeder capacity constraint. Since
1 1 1 1 1 (1 ) 2 m n n m n j i ij i ij j i ij j j i i j i a X P X P a X P N = = = = = ⎛ ⎞ − − = ⎜ − ⎟ ⎝ ⎠
∑ ∑
∑
∑
∑
(4) where 1 n j ij i N P ==
∑
is the number of components required for board type j, the objective function and constraint (2)can further be simplified to the second term in equation (4).
When aj =1, j=1..n(i.e., a special case of our problem), Ben-Arieh and Dror [7] prove that the resulting problem is NP-Complete. As a result, the problem formulated above is also NP-Complete. Below, we summarize the heuristic methods considered to solve the component allocation model presented above.
III.SOLUTION PROCEDURES DEVELOPED
A total of 28 heuristics were developed to find a good quality solution for the component allocation problem defined in the previous section. All of these algorithms have two mechanisms in their structure: component sorting and component assignment. Component sorting rules determine the order of the component assignment to the machines. On the other hand, component assignment rules decide which machine a given component type is to be assigned. Below, we present five component sorting and three component assignment rules:
A. Component Sorting Rules
i- Component Popularity (CP): The popularity of a component is measured by the number of board types on which it is used, i.e.,
1 = m i ij j CP Y =
∑
where1, if component type is placed on board type = 0, otherwise. ij i j Y ⎧⎨ ⎩ .
In this sorting scheme, components are sorted in non-increasing CP values. If there are more than one component types with the same popularity, the one which is consumed more in the planning period gets higher priority.
ii- Component Usage (CU): The total number of placements of each component type over all boards is calculated (i.e., 1 m i j ij j CU a P =
=
∑
) and the components are sorted in non-increasing order of CU values. This way, component types having higher usage are assigned to machines in a balanced manner in the earlier stages and it is hoped that the balance will not be much deteriorated by the least used component types.iii- Standard Error (SE): The standard error of a component type i is given by the following equation:
2 1 1 = m ij ij j i m ij j P P m SE P m = = ⎛ − ⎞ ⎜ ⎟ ⎝ ⎠
∑
∑
(4) Min ij n i i n i ij i m j j X P X P a (1 ) 1 1 1∑
∑
∑
= = − = − (1) s.t. 0 ) 1 ( 1 1 1 ≥ ⎟ ⎠ ⎞ ⎜ ⎝ ⎛ − −∑
∑
∑
= = = ij n i i n i ij i m j j X P X P a (2) 1 n i i X F = ≤∑
(3) Xi = 0 or 1 i=1,..,nwhere, m is the number of board types. Under this rule, the component types are ordered according to non-decreasing order of their SE values.
The logic for CP and CU rules is quite intuitive. SE sorting rule ensures that the component types which have a homogenous usage over all board types (which may imply component types used by most of the board types) are more important than the others and they should be handled first and distributed to machines as equally as possible. The numerator of the above expression (sum of squared errors) reflects this. On the other hand, among the component types, which have similar usage homogeneity, the ones with larger average usage are more important which is reflected by the expression in the denominator.
iv- Board-component Usage (BU): This is a two step component sorting rule; first, board types are ordered according to the number of components to be populated on them. Board types requiring more components (higher Nj) are more important and come earlier in the list. First
board type in the list is picked up and the component types that exist on that board are ordered in non-increasing order of their usage on that board. Then, the second board type is picked and the component types that exist on that board but not yet included in the ordered list before, are added at the end of the list with the same logic. This procedure continues until the ordered list contains all component types.
v- RN (random): Component types are ordered in a random manner. This rule will be used as a benchmark for comparisons with other sorting rules.
B. Component Assignment Rules
i- Less Work Rule A (LWA): This rule picks up the component types from the component sort list one by one and assigns them to the less work assigned machine. While processing the BU list, the assigned work of a machine is the total number of component placements for the board type being handled at that time.
ii- Less Work Rule B (LWB): This rule is similar to LWA and differs only in the algorithms related to the BU component sort rule. During the processing of the BU list, the assigned work of machines is taken as the total work related to all board types.
iii- Greedy Optimization (GR): This rule seeks a partial load balance at each step. Each time a new component type is picked up from a sorting list, the value of the objective function for the partial feeder configurations attained so far is calculated for both possible machine assignments, and the machine corresponding to a lower objective function value (imbalance) is chosen for assignment.
C. Heuristics Procedures Considered
In this research, 28 load balancing algorithms are experimented with for the two identical machines case. A naming convention is used to identify the individual algorithms with respect to the sort and assignment rules deployed: A two letter code for component sort rule is first written in upper case and it is followed by the component assignment rule code in lower case (e.g. CUgr). The letters "a" and "b" are used to denote component assignment rules LWA and LWB, respectively. With RAN, component types in the RN sort list are assigned to machines in an alternating manner.
If the algorithm uses one component sort list partially and then another one, both sort rules are written one after the other and this is followed by a number (1, 2 or 3) which denotes the filling ratio of total feeder locations on both machines upon which the algorithm switches from the first sort list to the second: "1" denotes 25 per cent filling ratio, whereas "2" and "3" denote 50 per cent and 75 per cent, respectively. If the filling ratio does not lead to an integer value for the number of feeder locations, it is rounded off to the nearest integer.
For example, if we have two identical machines, each having 15 feeder locations and if we are trying to assign 30 component types to these machines using CUBU1a algorithm, it will work as follows: A total of eight component types will be picked from the CU ordered list and will be assigned to either of the machines according to the LWA assignment rule. After this, the BU ordered list will be considered up and starting from the first component type in this list that has not already been assigned to a machine, the assignment of all component types that are not assigned to a machine will proceed.
Below is the list of the algorithms we experimented with for two identical machines case:
Here RAN is the short name for random. With RAN, component types in the RN sort list are assigned to machines in an alternating manner
IV. COMPUTATIONAL EXPERIMENTATION
In this section, we will first present the experimentation setup. Next, we will briefly compare the effectiveness of the proposed heuristics, Later, we will concentrate on CUgr algorithm, which seems to be the most effective one and discuss the results obtained to gain a better insight to the component allocation problem.
A. Experimental Setup
In the test problems generated, the number of component types varies between 20 and 120. The number of different board types assembled is either 10 or 20. The lot size for
CPa CUa SEa BUa BUb CPgr CUgr SEgr BUgr RAN CPBU1a CPBU2a CPBU3a CPBU1b CPBU2b CPBU3b CUBU1a CUBU2a CUBU3a CUBU1b CUBU2b CUBU3b SEBU1a SEBU2a SEBU3a SEBU1b SEBU2b SEBU3b
each board type is uniformly distributed between 1,000 and 10,000.
In real world problems, most of the component types are populated on boards in small quantities (1 or 2), while few are populated in larger numbers. Regarding this fact, the elements of the placement matrix (P), are generated using the following procedure:
Range pij Assumed Percentage
1-40 0 40 41-55 1 15 56-70 2 15 71-78 3 8 79-85 4 7 86-91 5 6 92-96 6 5 97-100 7 4
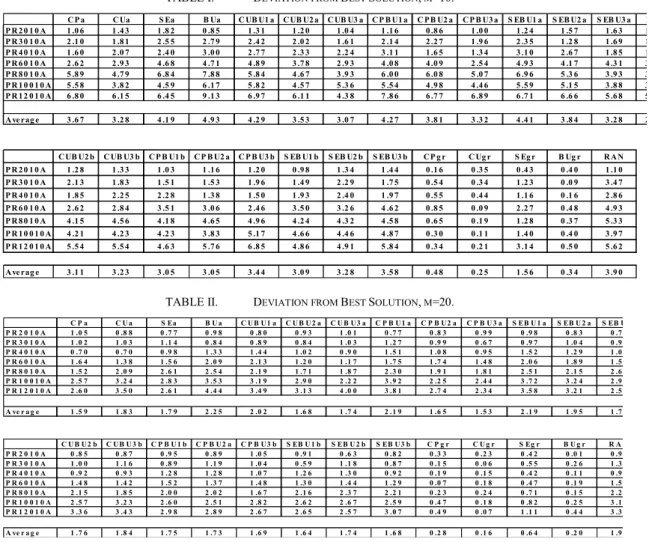
The following naming convention has been utilized for the randomly generated test problems. PRnm is a problem with n components (the problem size), and m boards. In our experimental setting, test problems are generated for n=20, 30, 40, 60, 80, 100 and 120 and m=10 and 20. For each (n, m) combination, heuristics are tested on six randomly generated test problems. For all algorithms the percent deviations of the algorithms from the best solution are calculated and displayed on tables 1 and 2 (i.e., each entry in these tables shows the average imbalance deviation from the best solution of six
problems having the same parameters). In these tables, also, the overall average for all problems (Average) is displayed.
B. Comparison of the Proposed Heuristics
As can be seen in table 1, CUa, which is very similar to the algorithm proposed by Ben-Arieh and Dror [7], on the average, behaves 328% worse than the best solution found by 28 algorithms when m=10. Among 28 algorithms, other than the greedy ones, when m=10, the best average solution obtained is worse than 285%. The greedy algorithms perform much better than the construction algorithms. On the average SEgr finds solutions which are 156% worse then the best solution (SE’s performance is 419%). The other greedy algorithms, on the average find solution 35.6% worse than the best solution. Similar observations can be found when m=20 (see table 2). Among the greedy algorithms, BUgr provides better solutions when n is small. When n gets larger, CUgr is the most efficient algorithm. Another interesting point to note is that some algorithms perform worse than the random allocation.
To summarize, when average deviations are considered, it can be observed that the greedy algorithms certainly outperform the others: CUgr and BUgr are the first best and second best heuristics for both m=10 and m=20 problems. Also, note that the performance of CUgr algorithm gets better as the problem size increases.
TABLE I. DEVIATION FROM BEST SOLUTION, M=10.
C P a C Ua S Ea B Ua C UB U1 a C UB U2 a C UB U3 a C P B U1 a C P B U2 a C P B U3 a S EB U1 a S EB U2 a S EB U3 a B P R 2 0 1 0 A 1 .0 6 1 .4 3 1 .8 2 0 .8 5 1 .3 1 1 .2 0 1 .0 4 1 .1 6 0 .8 6 1 .0 0 1 .2 4 1 .5 7 1 .6 3 1 P R 3 0 1 0 A 2 .1 0 1 .8 1 2 .5 5 2 .7 9 2 .4 2 2 .0 2 1 .6 1 2 .1 4 2 .2 7 1 .9 6 2 .3 5 1 .2 8 1 .6 9 1 P R 4 0 1 0 A 1 .6 0 2 .0 7 2 .4 0 3 .0 0 2 .7 7 2 .3 3 2 .2 4 3 .1 1 1 .6 5 1 .3 4 3 .1 0 2 .6 7 1 .8 5 1 P R 6 0 1 0 A 2 .6 2 2 .9 3 4 .6 8 4 .7 1 4 .8 9 3 .7 8 2 .9 3 4 .0 8 4 .0 9 2 .5 4 4 .9 3 4 .1 7 4 .3 1 3 P R 8 0 1 0 A 5 .8 9 4 .7 9 6 .8 4 7 .8 8 5 .8 4 4 .6 7 3 .9 3 6 .0 0 6 .0 8 5 .0 7 6 .9 6 5 .3 6 3 .9 3 3 P R 1 0 0 1 0 A 5 .5 8 3 .8 2 4 .5 9 6 .1 7 5 .8 2 4 .5 7 5 .3 6 5 .5 4 4 .9 8 4 .4 6 5 .5 9 5 .1 5 3 .8 8 3 P R 1 2 0 1 0 A 6 .8 0 6 .1 5 6 .4 5 9 .1 3 6 .9 7 6 .1 1 4 .3 8 7 .8 6 6 .7 7 6 .8 9 6 .7 1 6 .6 6 5 .6 8 5 A ve rag e 3 .6 7 3 .2 8 4 .1 9 4 .9 3 4 .2 9 3 .5 3 3 .0 7 4 .2 7 3 .8 1 3 .3 2 4 .4 1 3 .8 4 3 .2 8 2 C UB U2 b C UB U3 b C P B U1 b C P B U2 a C P B U3 b S EB U1 b S EB U2 b S EB U3 b CP g r C Ug r S Eg r B Ug r R A N P R 2 0 1 0 A 1 .2 8 1 .3 3 1 .0 3 1 .1 6 1 .2 0 0 .9 8 1 .3 4 1 .4 4 0 .1 6 0 .3 5 0 .4 3 0 .4 0 1 .1 0 P R 3 0 1 0 A 2 .1 3 1 .8 3 1 .5 1 1 .5 3 1 .9 6 1 .4 9 2 .2 9 1 .7 5 0 .5 4 0 .3 4 1 .2 3 0 .0 9 3 .4 7 P R 4 0 1 0 A 1 .8 5 2 .2 5 2 .2 8 1 .3 8 1 .5 0 1 .9 3 2 .4 0 1 .9 7 0 .5 5 0 .4 4 1 .1 6 0 .1 6 2 .8 6 P R 6 0 1 0 A 2 .6 2 2 .8 4 3 .5 1 3 .0 6 2 .4 6 3 .5 0 3 .2 6 4 .6 2 0 .8 5 0 .0 9 2 .2 7 0 .4 8 4 .9 3 P R 8 0 1 0 A 4 .1 5 4 .5 6 4 .1 8 4 .6 5 4 .9 6 4 .2 4 4 .3 2 4 .5 8 0 .6 5 0 .1 9 1 .2 8 0 .3 7 5 .3 3 P R 1 0 0 1 0 A 4 .2 1 4 .2 3 4 .2 3 3 .8 3 5 .1 7 4 .6 6 4 .4 6 4 .8 7 0 .3 0 0 .1 1 1 .4 0 0 .4 0 3 .9 7 P R 1 2 0 1 0 A 5 .5 4 5 .5 4 4 .6 3 5 .7 6 6 .8 5 4 .8 6 4 .9 1 5 .8 4 0 .3 4 0 .2 1 3 .1 4 0 .5 0 5 .6 2 A ve rag e 3 .1 1 3 .2 3 3 .0 5 3 .0 5 3 .4 4 3 .0 9 3 .2 8 3 .5 8 0 .4 8 0 .2 5 1 .5 6 0 .3 4 3 .9 0
TABLE II. DEVIATION FROM BEST SOLUTION, M=20.
C P a C U a S Ea B U a C U B U 1 a C U B U 2 a C U B U 3 a C P B U 1 a C P B U 2 a C P B U 3 a S EB U 1 a S EB U 2 a S EB U P R 2 0 1 0 A 1 .0 5 0 .8 8 0 .7 7 0 .9 8 0 .8 0 0 .9 3 1 .0 1 0 .7 7 0 .8 3 0 .9 9 0 .9 8 0 .8 3 0 .7 P R 3 0 1 0 A 1 .0 2 1 .0 3 1 .1 4 0 .8 4 0 .8 9 0 .8 4 1 .0 3 1 .2 7 0 .9 9 0 .6 7 0 .9 7 1 .0 4 0 .9 P R 4 0 1 0 A 0 .7 0 0 .7 0 0 .9 8 1 .3 3 1 .4 4 1 .0 2 0 .9 0 1 .5 1 1 .0 8 0 .9 5 1 .5 2 1 .2 9 1 .0 P R 6 0 1 0 A 1 .6 4 1 .3 8 1 .5 6 2 .0 9 2 .1 3 1 .2 0 1 .1 7 1 .7 5 1 .7 4 1 .4 8 2 .0 6 1 .8 9 1 .5 P R 8 0 1 0 A 1 .5 2 2 .0 9 2 .6 1 2 .5 4 2 .1 9 1 .7 1 1 .8 7 2 .3 0 1 .9 1 1 .8 1 2 .5 1 2 .1 5 2 .6 P R 1 0 0 1 0 A 2 .5 7 3 .2 4 2 .8 3 3 .5 3 3 .1 9 2 .9 0 2 .2 2 3 .9 2 2 .2 5 2 .4 4 3 .7 2 3 .2 4 2 .9 P R 1 2 0 1 0 A 2 .6 0 3 .5 0 2 .6 1 4 .4 4 3 .4 9 3 .1 3 4 .0 0 3 .8 1 2 .7 4 2 .3 4 3 .5 8 3 .2 1 2 .5 A ve r a g e 1 .5 9 1 .8 3 1 .7 9 2 .2 5 2 .0 2 1 .6 8 1 .7 4 2 .1 9 1 .6 5 1 .5 3 2 .1 9 1 .9 5 1 .7 C U B U 2 b C U B U 3 b C P B U 1 b C P B U 2 a C P B U 3 b S EB U 1 b S EB U 2 b S EB U 3 b C P g r C U g r S Eg r B U g r R A P R 2 0 1 0 A 0 .8 5 0 .8 7 0 .9 5 0 .8 9 1 .0 5 0 .9 1 0 .6 3 0 .8 2 0 .3 3 0 .2 3 0 .4 2 0 .0 1 0 .9 P R 3 0 1 0 A 1 .0 0 1 .1 6 0 .8 9 1 .1 9 1 .0 4 0 .5 9 1 .1 8 0 .8 7 0 .1 5 0 .0 6 0 .5 5 0 .2 6 1 .3 P R 4 0 1 0 A 0 .9 2 0 .9 3 1 .2 8 1 .2 8 1 .0 7 1 .2 6 1 .3 0 0 .9 2 0 .1 9 0 .1 5 0 .4 2 0 .1 1 0 .9 P R 6 0 1 0 A 1 .4 8 1 .4 2 1 .5 2 1 .3 7 1 .4 8 1 .3 0 1 .4 4 1 .2 9 0 .0 7 0 .1 8 0 .4 7 0 .1 9 1 .5 P R 8 0 1 0 A 2 .1 5 1 .8 5 2 .0 0 2 .0 2 1 .6 7 2 .1 6 2 .3 7 2 .2 1 0 .2 3 0 .2 4 0 .7 1 0 .1 5 2 .2 P R 1 0 0 1 0 A 2 .5 7 3 .2 3 2 .6 0 2 .5 1 2 .8 2 2 .6 2 2 .6 7 2 .5 9 0 .4 7 0 .1 8 0 .8 2 0 .2 5 3 .1 P R 1 2 0 1 0 A 3 .3 6 3 .4 3 2 .9 8 2 .8 9 2 .6 7 2 .6 5 2 .5 7 3 .0 7 0 .4 9 0 .0 7 1 .1 1 0 .4 4 3 .3 A ve r a g e 1 .7 6 1 .8 4 1 .7 5 1 .7 3 1 .6 9 1 .6 4 1 .7 4 1 .6 8 0 .2 8 0 .1 6 0 .6 4 0 .2 0 1 .9
C. Further Analysis of CUgr Solutions
In this section, the results obtained by the CUgr algorithm are further explored. Specifically, the change in the imbalance values obtained when the number of component types or board types are changed is analyzed. The Effect of the Number of Components on the Total Imbalance
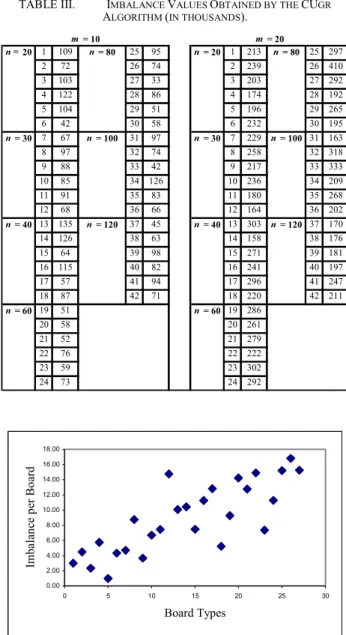
Referring to the imbalance values obtained by the algorithms we observe that especially for the best performing algorithm CUgr, the objective function values of different problems seem to be independent of the problem size (see table 3). The objective function values obtained by CUgr algorithm are displayed in table 3 below when m=10 and m=20 for 42 randomly generated problems. The average imbalance value when m=20, seems to be distinctly larger than that of problems having m=10 (for CUgr, the average objective function value is 80,000 for m=10 and 238,000 for m=20).
We have applied regression to test the existence of a linear relationship between the imbalance values and the number of components on a board. When m=10, the regression results in IMBALANCE = (91,400 - 150n). When the confidence level is chosen to be 95%, the coefficient of n has a confidence interval of [-340, 40]. The r2 for this regression is 0.057. On the other hand when m=20, IMBALANCE = 229,600 + 110n. For the same confidence level, the coefficient of n has a confidence interval of [-330, 540]. Furthermore the r2 is 0.006. Given very low r2 values and the confidence interval for the coefficient of n in the regression equation, one can not conclude that there is a linear relationship between the imbalance and the number of components on a board. Thus, our claim of independence of the imbalance value from the problem size is supported statistically and we state the following important observation:
For problems having the same number of board types and random generation parameters, the total imbalance is around a specific value independent of problem size.
This statement can also be intuitively explained as follows: Given a partial solution (optimal or near optimal) for a particular problem size, addition of a new component type may increase the workload imbalance between the machines, since it will be assigned to either one of the machines. But a second additional component will probably be assigned to the other machine and it will have an overall balancing effect on the imbalance value. As more component types are added, it is reasonable to expect that these increasing and decreasing effects will lead to a minimal change in the total imbalance level. This observation may also be valid for the true optimal values based on the several problems whose optimal solutions were found.
The Effect of the Number of Board Types on the Total Imbalance
To analyze the impact of the number of board types on the objective function value, 28 randomly generated problems having m=1 to m=28 are solved using the CUgr algorithm. In figure 2, the scatter diagram show a linear increasing relation between imbalance per board (ipb) and the number of board types. This linear trend is validated using regression by which the following linear relation is obtained:
ipb = 2.58 + 0.45 * m, with r2 value of 0.65.
TABLE III. IMBALANCE VALUES OBTAINED BY THE CUGR
ALGORITHM (IN THOUSANDS). n = 20 1 109 n = 80 25 95 n = 20 1 213 n = 80 25 297 2 72 26 74 2 239 26 410 3 103 27 33 3 203 27 292 4 122 28 86 4 174 28 192 5 104 29 51 5 196 29 265 6 42 30 58 6 232 30 195 n = 30 7 67 n = 100 31 97 n = 30 7 229 n = 100 31 163 8 97 32 74 8 258 32 318 9 88 33 42 9 217 33 333 10 85 34 126 10 236 34 209 11 91 35 83 11 180 35 268 12 68 36 66 12 164 36 202 n = 40 13 135 n = 120 37 45 n = 40 13 303 n = 120 37 170 14 126 38 63 14 158 38 176 15 64 39 98 15 271 39 181 16 115 40 82 16 241 40 197 17 57 41 94 17 296 41 247 18 87 42 71 18 220 42 211 n = 60 19 51 n = 60 19 286 20 58 20 261 21 52 21 279 22 76 22 222 23 59 23 302 24 73 24 292 m = 10 m = 20 0.00 2.00 4.00 6.00 8.00 10.00 12.00 14.00 16.00 18.00 0 5 10 15 20 25 30 Board Types Imb a lan ce p er Bo ard
Figure 2. Imbalance per Board vs. Number of Board Types.
This result has also an intuitive explanation: the introduction of each board type to the problem brings a new imbalance term to the objective function value and this causes a linear increase in total imbalance value by the increasing number of board types.
The imbalance values for m=10 and m=20 estimated using equation six are 70,800 and 231,600, respectively. It is interesting to note that, these values are not very much different from the average values (80,000, 238,000) mentioned above.
D. Improving the Results from the CUgr Algorithm Though the results indicate that, the CUgr algorithm is the best heuristic among all experimented in this study, on the average, it finds solutions 25% and 16% worse than the best solution for m=10 and m=20 cases respectively. This indicates that there is still room for improvement: Consequently, for the smaller size problems (n = 20, 30, 40 and m = 10, 20) we apply an exchange heuristic (2-opt procedure) to improve the CUgr solution. When 2-opt is applied, the exchange heuristic results in an average improvement of 43%, which is quite impressive.
In addition to this, we solved six problems (from n=20, 30 and 40 when m=10, two problems each) to optimality using GAMS (General Algebraic Modeling System) CPLEX. According to the results of these six runs, the total imbalance values found by CUgr+2-opt are decreased by 5.2 per cent on the average.
The results obtained by CUgr+2-opt comply with the observation made in section 4.C. That is, independent of the problem size, the imbalance values obtained seem to be constant (average values are 43,000 and 141,000 for m=10 and m=20 cases respectively). Although, it is not suitable to drive a statistical conclusion using only six problems, a similar behavior seems also valid for the problems solved to optimality.
As a result of the considerable improvement brought by 2-opt, the best solution methodology in minimizing the total imbalance value is the combined heuristic CUgr+2-opt. However, the application of 2-opt is a very time consuming task and it is not easy to apply to larger size problems. Actually, this may not even be necessary based on the discussion given below.
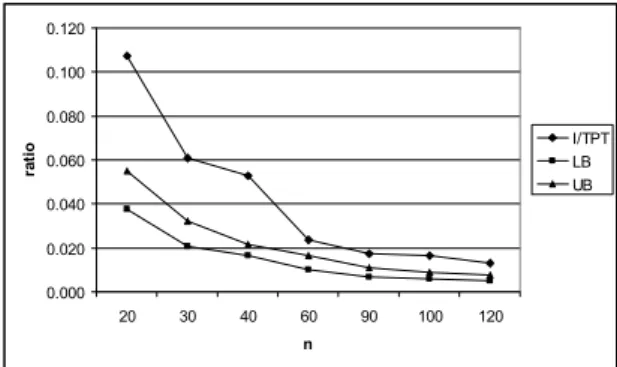
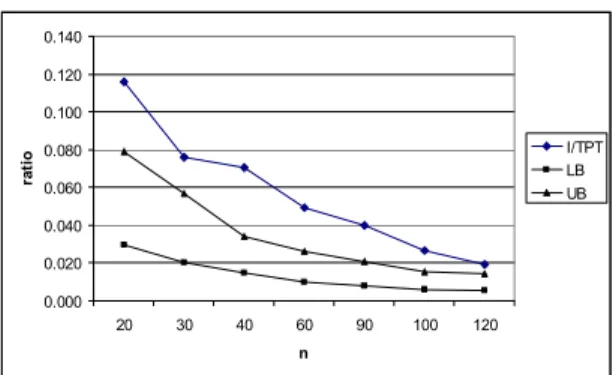
Recall that, in our problem formulation, the objective function value reflects the total waiting (idle) time (I) of the machines. In these formulations, we do not give any consideration to the ratio of this idle time to the total production time (TPT). TPT is calculated as the total number of components to be populated on two machines plus the total imbalance value. The importance of the percentage of imbalance in total production time (I/TPT) is obvious. It gives the percentage of time that the machine capacities cannot be utilized. The calculations of I/TPT values for 10 and 20 board types are made and averaged for the six problems generated with the same scheme. The average I/TPT values with respect to the problem sizes are depicted in figures 3 and 4.
A lower bound (LB) on actual I/TPT values is calculated as follows: Taking a particular board type into consideration, the total number of components is either even or odd. When it is odd, that particular board will bring at least one imbalance. On the other hand, when it is even, there might be no imbalance at all. For the experimentation that has been made, the lower bounds obtained are divided by TPT and tabulated in the LB
columns of table 4. The imbalance values obtained by CUgr+2-opt are also divided by TPT and these values are shown in UB (upper bound) columns. For the larger problem sizes where 2-opt was not applied (n≥60), based on the observation of section 4.3.1, the average imbalance value of 43,000 is assumed and it is divided by TPT.
TABLE IV. SOURCE DATA OF FIGURES 3 AND 4.
m=10 m=20 n I/TPT LB UB I/TPT LB UB 20 0.107 0.038 0.055 0.116 0.030 0.079 30 0.061 0.021 0.032 0.076 0.020 0.057 40 0.053 0.016 0.021 0.070 0.015 0.034 60 0.024 0.010 0.017 0.049 0.010 0.026 90 0.017 0.007 0.011 0.040 0.008 0.021 100 0.016 0.006 0.009 0.027 0.006 0.015 120 0.013 0.005 0.007 0.019 0.006 0.014
The UB values (CUgr+2-Opt values) are the upper bounds for the optimal values. However, since the imbalance values obtained by CUgr+2-opt could only be improved by 5.2% (based on six problems) and as the denominator of I/TPT gets even larger when n increases, the gap between the UB and LB decreases significantly implying that the quality of the solution gets better significantly. 0.000 0.020 0.040 0.060 0.080 0.100 0.120 20 30 40 60 90 100 120 n ra tio I/TPTLB UB
Figure 3. Imbalance versus Total Production Time (m=10).
Regarding the difference between the I/TPT and the UB values (the post 2-opt values), we see that, for problem sizes greater than 60, the solutions generated by CUgr algorithm can only be improved by 0.6 to 1.0 per cent for m=10, and 0.5 to 1.9 per cent for m=20 by the 2-opt implementation. This small room for the improvement leads us to an important conclusion:
For smaller problems it is a good idea to apply 2-opt to the CUgr solution but for larger problems CUgr itself is sufficient.
Another strength of the CUgr algorithm is its speed. The greedy rule finds a solution in n iterations and thus has a complexity of O(n). Considering also the O(nlogn) complexity of the CU sort rule, the overall complexity of CUgr algorithm is O(nlogn).
0.000 0.020 0.040 0.060 0.080 0.100 0.120 0.140 20 30 40 60 90 100 120 n ra ti o I/TPT LB UB
Figure 4. Imbalance versus Total Production Time (m=20).
V.CONCLUDING REMARKS
In this study, the problem of allocating component types to machines for PCB assembly is considered. The focus is on two identical machines case. Based on the assumptions given in section 2, for this load balancing problem, the objective is to minimize the total load imbalance on machines. This problem, in its simplest form is a very difficult problem. As a result, twenty eight different algorithms are developed and their performances are tested. It is shown that, when the number of boards of each type to be produced are not equal (the problem setup considered in this study) the CUa algorithm of Ben-Arieh and Dror [7] performs quite poor. Among these algorithms, the greedy algorithm, CUgr, performed the best and its performance is considerably improved by applying an exchange heuristic (2-opt).
The solution procedures proposed here can also be extended to handle more complex problems where there are restrictions on allocating certain components to specific machines or when the slot requirements of component types are not the same, or when the machines have different nozzle sets that they can handle. On the other hand, component allocation problem in the existence of more than two machines or two non identical machines are the main further research areas of this study.
REFERENCES
[1] Duman, E., “Optimization issues in automated assembly of printed circuit boards,” Dissertation, Bogazici University, Turkey, 1998.
[2] McGinnis, L. F., Ammons, J. C., Carlyle, M., Cranmer, L, Depuy, G. W., Ellis, K. P., Tovey C. A., Xu, H., “Automated process planning for printed circuit card assembly,” IIE Transactions, 24/4, pp. 18-29, 1992. [3] Ji, P., Wan, Y. F., “Planning for printed circuit board
assembly: The state-of-the-art review,” Int. J. of Computer Applications in Technology 14 Nos.4/5/6, pp. 136-144, 2001.
[4] Francis, R. L., Horak, T., “A note on reel allocation problem,” IIE Transactions, 26/3, pp. 111-114, 1994. [5] Carmon, T. F., Maimon, O. Z., Dar-El, E. Z., “Group
set-up for printed circuit board assembly,” International Journal of Production Research, 27/10, pp. 1795-1810, 1989.
[6] Askin, R. G., Dror, M., Vakharia, A. J., “Printed circuit board family grouping and component allocation for a multimachine, Open-shop assembly cell,” Naval Research Logistics, 41, pp. 587-608, 1994.
[7] Ben-Arieh, D., Dror, M., “Part assignment to electronic insertion machines: Two machine case,” International Journal of Production Research, 28/7, pp. 1317-1327, 1990
[8] Ho, W., Ji, P., “Component scheduling for chip shooter machines: a hybrid genetic algorithm approach,” Computers and Operations Research, 30/14, pp. 2175-2189, 2003.
[9] Sadiq, M., Landers, T. L., Taylor, G. D., “A heuristic algorithm for minimizing total production time for a sequence of jobs on a surface mount placement machine,” International Journal of Production Research, 11/6, pp. 1327-1341, 1993.
[10] Ahmadi, J., Grotzinger, S., Johnson, D., “Component allocation and partitioning for a dual delivery placement machine,” Operations Research, 36/2, pp. 176-191, 1988.
[11] Crama, Y., Kolen, A. W. J., Oerlemans, A. G., Spieksma, F. C. R., “Throughput rate optimization in the automated assembly of printed circuit boards,” Annals of Operations Research, 26, pp. 455-480, 1990.
[12] Klomp, C., Klundert, J., Spieksma, F. C. R., Voogt, S., “The feeder rack assignment problem in PCB assembly: A case study,” International Journal of Production Economics, 6, pp. 399-407, 2000.
[13] Hillier, M. S., Brandeu, N. L., “Cost minimization and workload balancing in printed circuit board assembly,” IIE Transactions, 33, pp. 547-557, 2001.
[14] Crama, Y., Flippo, O. E., Van de Klundert, J. J., Spieksma, F. C. R., “The assembly of printed circuit boards: A case with multiple machines and multiple board types,”. European Journal of Operational Research, 98, pp. 457-472, 1997.
[15] Dikos, A., Nelson, P. C., Tirpak, T. M., Wang, W., “Optimization of high-mix printed circuit card assembly using genetic algorithms,” Annals of Operations Research, 75, pp. 303-324, 1997.
[16] Gronalt, M., Grunow, M., Günther, H. O., Zeller, R., “A heuristic for component switching on SMT placement machines,” International Journal of Production Economics; 53, pp. 181-190, 1997.
[17] Nemhauser, G. L., Wolsey, L. A., Integer and Combinatorial Optimization, New York: John Wiley and Sons, 1998.
[18] Yildirim, M. B., Duman, E. and Duman, D., “Dispatching Rules for Allocation of Component Types to Machines in the Automated Assembly of Printed Circuit Boards,” Lecture Notes in Computer Science, Volume 4263, pp. 55-64, 2006.
Mehmet Bayram Yildirim received his B.S. degree from Bogazici University, Istanbul, Turkey and M.Sc. degree from Bilkent University, Ankara, Turkey in Industrial Engineering in 1994 and 1996, respectively. He received his PhD degree from Department of Industrial and System Engineering in University of Florida in 2001. He is an assistant professor in the Industrial and manufacturing Engineering Department at Wichita State University. His research interests are optimization, scheduling, logistics and supply chain, artificial intelligence and green manufacturing.
Ekrem Duman received his B.S. degree from Bogazici University, Istanbul, Turkey in Electrical Engineering. He received his M.Sc. and PhD degrees from the same university in Industrial Engineering in years 1994 and 1994, respectively. He is an associate professor in the Industrial Engineering Department at Dogus University in Istanbul. His research interests include applied optimization, scheduling, statistics and data mining.
Dilek Duman received her B.S. degree from Bogazici University, Istanbul, Turkey in Computer Engineering in 1990. She worked as a professional in software development. Currently, she is a manager in Intertech Software Development
Company. She is an expert in software development and implementing IT systems and solutions particularly in finance sector
Coskun Cetinkaya received his B. S, degree from Anadolu University, Eskisehir, Turkey in Electrical Engineering in 1994 and M.S.E.E. degree from university of Southern California in 1998 . he received his PhD degree from Rice University in Computer Networking in 2002. His research interests include Admission Control, Quality of Service, Medium Access Control Protocols, Transport Protocols and Scheduling Algorithms.