Automatic Multimedia Cross-modal Correlation Discovery
∗Jia-Yu Pan Hyung-Jeong Yang
†Christos Faloutsos Pinar Duygulu
‡Computer Science Department, Carnegie Mellon University, Pittsburgh PA 15213, U.S.A.
{jypan, hjyang, christos}@cs.cmu.edu, [email protected]
ABSTRACT
Given an image (or video clip, or audio song), how do we automatically assign keywords to it? The general prob-lem is to find correlations across the media in a collection of multimedia objects like video clips, with colors, and/or motion, and/or audio, and/or text scripts. We propose a novel, graph-based approach, “MMG”, to discover such cross-modal correlations.
Our “MMG” method requires no tuning, no clustering, no user-determined constants; it can be applied to any multi-media collection, as long as we have a similarity function for each medium; and it scales linearly with the database size. We report auto-captioning experiments on the “standard” Corel image database of 680 MB, where it outperforms do-main specific, fine-tuned methods by up to 10 percentage points in captioning accuracy (50% relative improvement).
Categories and Subject Descriptors
H.2.8 [Database Management]: Database Applications— Data Mining
General Terms
Design, Experimentation
∗This material is based upon work supported by the Na-tional Science Foundation under Grants No. IIS-0121641, IIS-0083148, IIS-0113089, IIS-0209107, IIS-0205224, INT-0318547, SENSOR-0329549, EF-0331657, IIS-0326322, and by the Pennsylvania Infrastructure Technology Alliance (PITA) Grant No. 22-901-0001. Additional funding was provided by donations from Intel, and by a gift from Northrop-Grumman Corporation.
†Supported by the Post-doctoral Fellowship Program of Ko-rea Science and Engineering Foundation (KOSEF)
‡Pinar Duygulu’s current address: Department of Computer Engineering, Bilkent University, Ankara, Turkey, 06800
Permission to make digital or hard copies of all or part of this work for personal or classroom use is granted without fee provided that copies are not made or distributed for profit or commercial advantage and that copies bear this notice and the full citation on the first page. To copy otherwise, to republish, to post on servers or to redistribute to lists, requires prior specific permission and/or a fee.
KDD’04, August 22–25, 2004, Seattle, Washington, USA.
Copyright 2004 ACM 1-58113-888-1/04/0008 ...$5.00.
Keywords
Cross-modal correlation, automatic image captioning, graph-based model
1.
INTRODUCTION AND RELATED WORK
Given a collection of multimedia objects, we want to find correlations across media. The driving application is auto-captioning, where the problem is defined as follows:
Problem 1 (Auto-captioning). Given a set S of color images, each with caption words; and given one more, un-captioned image I, find the best t (say, t=5) caption words to assign to it.
However, the method we propose is general, and can be applied to video clips (with text scripts, audio, motion); on audio songs, with text lyrics, and so on.
Problem 2 (Informal-General). Given n
multime-dia objects, each consisting of m attributes (traditional nu-merical attributes, or multimedia ones such as text, video, audio, tisequence, etc). Find correlations across the me-dia (eg., correlated keywords with image blobs/regions; video motion with audio features).
For example, we want to answer questions of the form “which keywords show up, for images with blue top” or “which songs are usually in the background of fast-moving video clips”.
We assume that domain experts have provided us with similarity functions for all the involved media. The similar-ity function does not need to be perfect and is sufficient to our needs if it could approximately identify the neighboring objects of an object.
There are multiple research papers, attacking parts of the problem. For example, to associate words with images for automatic image captioning, people have proposed meth-ods based on classifiers [15] or information retrieval tech-niques (relevance model [10] and user feedback [26]), as well as building association models (translation model [7]; hi-erarchical model [2, 3, 4]; multi-resolution model [13]; co-occurrence model [16]). Video databases [25] spark efforts to associate script words with faces [20], and visual/auditory characteristics with video genres (news or commercial) [18]. Similarly, there are successful efforts [24]. to associate songs with their genres (like jazz, classical, etc.). Previous cor-relation discovery attempts such as LSI [19] and SDD [12] mostly consider categorical attributes. In this work, we pro-posed a general methods which consider both categorical and numerical attributes, as well as set-valued attributes.
We would like to find an unifying method, with the fol-lowing specifications:
• it should be domain independent
• it should spot correlations in any of the above sce-narios, with missing values, feature vectors, set-valued attributes, and all combinations thereof.
• it should scale up for large collections of objects, both with respect to training, as well as for responses. In the following, we define the problem and describe our proposed method in Section 2 and 3, respectively. Section 4 gives experimental results on real data. We discuss our observations in Section 5. Section 6 gives the conclusions.
2.
PROBLEM DEFINITION
We proposed a novel approach for cross-media correla-tions, and we use image captioning as an illustration. Table 1 shows the terminology we used in the paper. The problem is more formally defined as follows:
Problem 3 (Formal). Given a set S of n multime-dia objects S={O1, O2, . . . , On} , each with m multimedia
attributes, find patterns/correlations among the objects and attributes.
Symbol Description
Objects Oi the i-th training object
Oq the query object
Ai the i-th attribute of an object
V(Oi) the vertex of GM M G for object Oi.
Ii the i-th training image
Iq the query image
Matrix/vector
A the (column-normalized) adjacency matrix −→
vq the restart vector of the query object (all
ze-ros, except a single ’1’) −→
uq the steady state probability vector for the
−→
vq restart vector
Table 1: Summary of symbols used in the paper We need to elaborate on the attributes: In traditional RDBMSs, attributes must be atomic (i.e., taking single val-ues, like “ISBN”, or “video duration”). However, in our case, they can be set-valued, like a set of caption words, or, even missing altogether. Take problem 1 (auto-captioning) for example, S is a collection of captioned images, and we want to guess the (missing) caption terms of a new, uncap-tioned image. One attribute of an image is the “caption”, which is set-valued (a set of words).
We propose to gear our method towards set-valued at-tributes, because they include atomic attributes as a special case; and they also smoothly handle the case of missing val-ues (null set). Thus, we only talk about set-valued attributes from now on.
Definition 1. The domain Diof (set-valued) attribute i
is the collection of atomic values that attribute i can choose from. The values of domain Di will be referred to as the
domain tokens of Di.
Assumption 1. For each domain Di (i = 1, . . . , m), we
are given a similarity function si(∗, ∗) which assigns a score
to each pair of domain tokens.
A domain can consist of categorical values, numerical val-ues, or numerical vectors. For problem 1 (auto-captioning), we have objects of m=2 attributes. The first, “caption”, has as domain a set of categorical values (English terms); the second, “image regions”, is a set of p-dimensional nu-merical feature vectors (p=30, as we describe next). The similarity function among the caption tokens could be 1 if the two tokens are identical, and 0 otherwise; the similarity function for “regions” could be, say a function of the Eu-clidean distance between feature vectors. Let’s elaborate on image captioning, before we present the main idea.
2.1
Case Study: Automatic Image Captioning
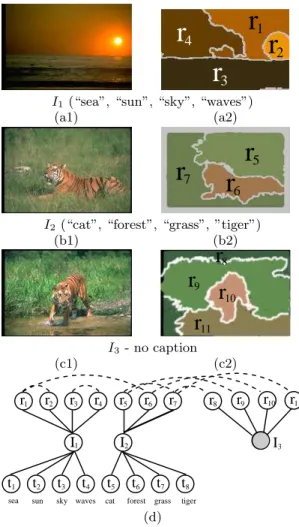
In the driving example of auto-captioning, the objects of interest are images. Each image has a set of regions ex-tracted from the image content, and some of them also have a caption. See Figure 1 for the 3 sample images, their cap-tions and their regions.
1
r
r
2r
3r
4I1(“sea”, “sun”, “sky”, “waves”)
(a1) (a2)
r
6 5r
r7
I2(“cat”, “forest”, “grass”, ”tiger”)
(b1) (b2)
r
11r
10r
9r
8 I3 - no caption (c1) (c2) r7 r6 r1 r2 r3 r4 r5 t5 t1 t2 t3 t4 t6 t7 t8 r8 r9 r10 r11 i3 I3 I2 I1sea sun sky waves cat forest grass tiger
(d)
Figure 1: Three sample images, two of them anno-tated ((a1),(b1)), and their regions ((a2),(b2),(c2)); and their “MMG”graph (d). (Figures look best in color.)
For fair comparison, we use the same data used in the previous work[2, 7]. Image regions are extracted by a stan-dard segmentation algorithm[22] (see Figure 1(d,e,f)). Each region is then mapped into a 30-dim feature vector. The p=30 features extracted from each region are the mean and standard deviation of RGB values, average responses to var-ious texture filters, its position in the entire image layout, and shape descriptors (e.g., major orientation, or bounding region to real region area ratio)[7, 8]. Note that the exact feature extraction details are orthogonal to our approach -all our “MMG”method needs is a black box that will map each color image into a set of zero or more feature vectors.
Thus, we turned specific auto-captioning problem (Prob-lem 1) into the general form (Prob(Prob-lem 2) as follows: Given n image objects, each with m = 2 set-valued attributes: “regions”, a set of numerical feature vectors; “captions”, a set of categorical terms, find correlations across modalities (regions and words). For example, which caption terms are more likely, when the image has a blue, sky-like blob.
The question is what to do next, to capture cross-media correlations. Should we use clustering on feature vectors, or should we use some classification method, as it has been suggested before? And, if yes, how many cluster centers should we shoot for? Or, if we choose classification, which classifier should we use? Next we show how to handle, and actually, bypass, all these issues, for any multimedia setting.
3.
PROPOSED METHOD - MIXED MEDIA
GRAPH (“MMG”)
The main idea is to represent all the objects, as well as their attributes (domain tokens) as nodes in a graph. For multimedia objects with m attributes, we obtain an (m+1)-layer graph GM M G. There are m types of nodes (one for
each attribute) and one more type of nodes for the objects. Next we describe (a) how to generate this GM M G graph and
(b) how to estimate cross-modal correlations using GM M G.
Graph construction.
See Figure 1 for an example. We will denote as V (O) the vertex of object O, and as V (ai)the vertex of the attribute value A = ai. We put an edge
between the node of an object and the nodes of its attributes. There is only one subtle point: For numerical and vector attributes, we need a way to reflect the similarity between two attribute token values. Our approach is to add an edge if and only if the two token values are close enough. For example, the orange “tiger” region r6 and the orange sky
region r1 have feature vectors that are closed in Euclidean
distance, and therefore, V (r1) and V (r6) are connected by
an edge.
We need to decide on a threshold for the “closeness”. There are many ways, but we decided to make the thresh-old adaptive: for each feature-vector, choose its k nearest neighbors, and add the corresponding edges. We discuss the choice of k later, as well as the sensitivity of our results to k. Computing the nearest neighbors is straight-forward, because we already have the similarity function si(∗, ∗) for
any domain Di (Assumption 1).
In summary, we have two types of links in our “MMG”graph: the nearest neighbor links (NN-links), between the nodes of two similar domain tokens; and the object-attribute-value links (OAV-links), between an object node and an attribute value node.
Example 1. Consider the image set S=I={I1, I2, I3}
(Fig-ure 1). The graph corresponds to this data set has three types of nodes: one for the image objects ij’s (j = 1, 2, 3);
one for the regions rj’s (j = 1, . . . , 11), and one for the
terms {t1, . . . , t8}={sea, sun, sky, waves, cat, forest, grass,
tiger}. Figure 1(g) shows the resulting “MMG”graph. Solid arcs indicate the object-attribute-value (OAV-links) relation-ships; dashed arcs indicate nearest-neighbor (NN-links) re-lationships.
In this example, we consider only k=1 nearest neighbor, to avoid cluttering the diagram. Note that nearest neighbor relationship is not symmetric, and we treat the edges as un-directional, which make some nodes have degree greater than 1 (for example, node V (r1): r2’s nearest neighbor is
r1, but r1’s nearest neighbor is r6).
To solve the auto-captioning problem (Problem 1), we need to develop a method to find good caption words for the uncaptioned image (e.g., image I3). This means that we
need to estimate the affinity of each term to the uncaptioned image (i.e., the affinity of nodes t1, . . . , t8 to node i3). We
discuss this next.
Correlation discovery by random walk.
We propose to turn the multimedia problem into a graph problem. Thus, we can tap the sizable literature of graph algorithms, and use off-the-shelf methods for assigning importance to ver-tices in a graph, as well as determining how related is an un-captioned image (represented by node, say “A” in the graph), to the term “tiger” (represented, say, by node “B” in the graph).We have many choices: electricity based approaches [17, 6], random walks (PageRank, topic-sensitive PageRank) [5, 9], hubs and authorities [11], and elastic springs [14]. In this work, we propose to use random walk with restart (“RWR”) for estimating the affinity of node “B” with respect to node “A”. But, again, the specific choice of method is orthogonal to our framework.
The “random walk with restarts” operates as follows: to compute the affinity of node “B” for node “A”, consider a random walker that starts from node “A”. The random walker chooses randomly among the available edges every time, except that, before he makes a choice, with probability c, he goes back to node “A” (restart). Let uA(B) denote the
steady-state probability that our random walker will find himself at node “B”. Then, uA(B) is what we want, the
affinity of “B” with respect to “A”.
Definition 2 (Affinity). The importance of node B with respect to node A is the steady-state probability uA(B)
of random walk with restarts, as defined above.
For example, to solve the auto-captioning problem for im-age I3 of Figure 1, we can estimate the steady-state
proba-bilities ui3(∗) for all nodes of the graph GM M G, we can keep
only the nodes that correspond to terms, and we can report the top few (say, 5), as caption words for I3.
Algorithms.
For the general problem, the algorithm is as follows: First, build the “MMG” graph GM M G. When theuser asks for the affinity of node “B” to node “A”, estimate the steady-state probability uA(B) defined above.
The computation of the steady-state probabilities is very interesting and important. We use matrix notation, for
com-pactness. Let Oq be the query object (e.g., image I3of
Fig-ure 1). Suppose that we want to find the most related terms to Oq. We do an RWR from node q = V (Oq), and compute
the steady state probability vector −u→q=(uq(1), . . . , uq(N )),
where N is the number of nodes in the graph GM M G.
The estimation of vector −u→q can be implemented
effi-ciently by matrix multiplication. Let A be the adjacency matrix of the graph GM M G, and let it be column-normalized.
Let −v→qbe a column vector with all its N elements zero,
ex-cept for the entry that corresponds to node q; set this entry to 1. We call −v→qthe “restart vector”. Now we can formalize
the definition of the “affinity” of a node (Definition 2). Definition 3 (Steady-state vector). Let c be the probability of restarting the random walk from node q Then, the N -by-1 steady state probability vector, −u→q, (or simply,
steady-state vector) satisfies the equation: −→
uq= (1 − c)A−u→q+ c−v→q. (1)
The pseudo code of finding cross-modal correlations is shown in Figure 2. Let E be the number of edges in the graph built from the data set. The computational cost per iteration (step 4.1) is O(E), for there are 2E non-zero el-ements in the matrix A which are involved in the matrix multiplication. If we set a constant maximum number of iterations to be executed before convergence, the overall cost for Algorithm-CCD is O(E), linear to the data set size. Building the graph GM M G is a one time cost, and can be
done efficiently using a good nearest-neighbor index (e.g., R+-tree [21]) over the objects.
Given a GM M G graph and an object Oq.
1. Let −v→q=0, for all its N entries, except a ’1’ for the
q-th entry.
2. Normalize the adjacency matrix of GM M G, A, by
column. That is, make each column sum to 1. 3. Initialize −u→q=−v→q.
4. while(−u→q has not converged )
4.1 −u→q = (1-c)A−u→q+ c−v→q (*)
Figure 2: Algorithm-CCD: Cross-modal correlation discovery
4.
EXPERIMENTAL RESULTS
In this section, we show experimental results to address the following questions:
• Quality: How does the proposed “MMG” method per-form on captioning test images?
• Parameter defaults: How to choose good default values for the k and c parameters?
• Generality: How well does “MMG” capture other cross-media correlations: for example, how well does it solve the reverse problem (given a term like, “sky”, find the regions that are likely to correspond to it). Similarly, how well does “MMG” capture same-media correla-tions (say, term-term, or region-region correlacorrela-tions) In our experiment, we use 10 image data sets from Corel, which is also used in previous works [2, 7]. On the average,
each set has 5200 captioned images (each with about 4 cap-tioned terms), 1740 test images, 160 terms for captioning. One “MMG” graph is constructed for each data set, each of which has about 55,500 nodes and 180,000 edges.
Quality.
For each test image, we compute the captioning accuracy as the percentage of terms which are correctly pre-dicted. For a test image which has m correct caption terms, “MMG” will predict also m terms. If p terms are correctly predicted, then the captioning accuracy for this test image is defined as mp. This metric is also used in previous works [2, 7].Figure 3 shows the average captioning accuracy for the 10 data sets. We compare our results with the results re-ported in [7] which builds a statistical translation model using expectation-maximization (EM) to capture correla-tion. We refer to the method as the “EM” approach. On the average, on the same data used in [7], “MMG” achieves captioning accuracy improvement of 12.9 percentage points, which corresponds to a relative improvement of 58%. The parameters are set at k=3 and c=0.8, but as shown later, the performance is insensitive to specific settings.
1 2 3 4 5 6 7 8 9 10 0 0.05 0.1 0.15 0.2 0.25 0.3 0.35 0.4 Data set ID Score EM MMG
Figure 3: (EM and “MMG”) The parameters for “MMG” are c = 0.8, and K = 3.
We also compare the captioning accuracy with even more recent machine vision methods [2]: the Hierarchical Aspect Models method (“HAM”), and the Latent Dirichlet Alloca-tion model (“LDA”). Figure 4 compares the best average captioning accuracy reported by the two methods (HAM and LDA), with those of the proposed “MMG” method. The same data sets are used for fair comparison. Although both HAM and LDA improve on the EM method, they both lose to our generic “MMG” approach (35%, versus 29% and 25%). We do not compare per data set accuracy due to the lack of such measurements from [2], but we note that “MMG” gives significantly lower performance variance over the 10 data sets, by roughly an order of magnitude: 0.002 versus 0.02 and 0.03.
Parameter defaults.
We experiment to find out how would different values of the parameters c (restart probability) and k(nearest neighbor size) affect the captioning accuracy. Fig-ure 5 shows how the captioning accuracy of “MMG” varies with different parameter settings: (a) fixed k=3, vary c; (b) fixed c=0.9, vary k. The plateaus shown in the both plots indicate that the accuracy of the proposed “MMG” is insen-sitive to the specific setting of k and c. We show only theLDA HAM MMG 0 0.05 0.1 0.15 0.2 0.25 0.3 0.35 0.4 Data set ID Accuracy
Figure 4: Comparing “MMG” with LDA and
HAM on the 10 Corel data sets. LDA: (µ,
σ2
)=(0.24,0.002); HAM: (µ, σ2
)=(0.298,0.003); MMG: (mean, variance)=(0.3503, 0.0002). µ: ac-curacy mean. σ2 : accuracy variance. 0 0.2 0.4 0.6 0.8 1 0.2 0.22 0.24 0.26 0.28 0.3 0.32 0.34 0.36 0.38 0.4 Restart probability: c Accuracy
(a) Vary restart probability c
0 2 4 6 8 10 0.2 0.22 0.24 0.26 0.28 0.3 0.32 0.34 0.36 0.38 0.4 Number of neighbors: k Accuracy
(b) Vary nearest neighbor size k
Figure 5: Plateaus in the plots show that the cap-tioning accuracy is insensitive to values of c and k. Data set “006”. c: restart probability, k: nearest neighbor size. (a) Fix k=3, vary c. (b) Fix c=0.9, vary k.
result on one data set “006”, the results on other data sets are similar.
Generality.
“MMG” works on objects of any types. We design a experiment of finding similar caption terms using “MMG”. We use the same graph GM M G constructed forautomatic image captioning. To find the similar terms of a caption term t, we do “RWR”, restarting from the node V(t). Table 2 shows the similar terms found for some of the caption terms. In the table, each row shows the caption term
in question at the first column, followed by the top 5 similar terms found by “MMG” (sorted by similarity degree).
Notice that the retrieved terms make a lot of sense: for example, the string ’branch’ in the caption is strongly re-lated to forest- and bird- rere-lated concepts (”birds”, ”owl”, ”night”), and so on. Notice again that we did nothing spe-cial: no tf/idf, no normalization, no other domain-specific analysis - we just treated these terms as nodes in our “MMG”, like everything else.
Term 1 2 3 4 5
branch birds night owl nest hawk
bridge water arch sky stone boats
cactus saguaro desert sky grass sunset
car tracks street buildings turn prototype
f-16 plane jet sky runway water
market people street food closeup buildings pillars stone temple people sculpture ruins
reefs fish water ocean coral sea
Table 2: Similar terms of selected caption terms
5.
DISCUSSION
We are shooting for a method that requires no parameter tuning. Thus, here we discuss how to choose defaults for both our parameters, the number of neighbors k, and the restart probability c.
Number of neighbors
k.
In hindsight, the results of Fig-ure 5 make sense: with only k=1 neighbor per region, the collection of regions is disconnected, missing important con-nections and thus leading to poor captioning performance. On the other extreme, with a high value of k, everybody is directly connected to everybody else. The region nodes form almost a clique, which does not distinguish clearly between really close neighbors, and just neighbors.For a medium number of neighbors k, our NN-links appar-ently capture the neighbors they should. Small deviations from that value, make little difference, probably because the extra neighbors we add, are at least as good as the previous ones.
Restart probability
c.
For web graphs, the recommended value for c is typically c=0.15 [23]. Surprisingly, our exper-iments show that good quality is achieved for c=0.8 or 0.9. We conjecture that what determines a good value for the “restart probability” is the diameter of the graph. For the web graph, the diameter is approximately d=19 [1] which implies that the probability pperipheryfor the random walkerto reach a node in the periphery is roughly (1−0.15)19
=0.045. If we demand the same pperiphery for the three-layer graph
(diameter is roughly 3) for captioning, then we have (1 − 0.15)19
= (1 − c)3
(2)
⇒ c = 0.65 (3)
which is much closer to our empirical observations. Of course, the problem requires more careful analysis - but we are the first to show that c=0.15 is not always optimal for random walks with restarts.
6.
CONCLUSIONS
We started from the image auto-captioning problem, and we developed “MMG”, a general method that can spot cor-relations across media. The proposed graph-based model can be applied to diverse multimedia data to find multi-modal correlations. Moreover, to the best of our knowledge, this is the first effort in multimedia databases, that proposes such a graph-based approach to find patterns and correla-tions across media. The method has the following desirable characteristics:
• It is domain independent - the si(∗, ∗) similarity
func-tions completely isolate our “MMG” method from the domain.
• It does not require tedious parameter tuning (in con-trast to linear/polynomial/kernel SVMs, k-means clus-tering, etc.). We give good default values for the only 2 parameters k and c, and show empirically that the performance is not too sensitive to them.
• Specifically applied for image auto-captioning, it pro-vides excellent results on real image data sets (680 MBytes), outperforming finely tuned, domain-specific methods (up to 10% absolute, 50% relative, accuracy improvement).
• It is fast, scaling up well with the database size. Future work could further exploit the promising connec-tion between multimedia databases and graph algorithms, that we propose here: imputation of missing values, outlier detection and any other data mining task that require the discovery of correlations as its first step.
7.
REFERENCES
[1] A. Albert, H. Jeong, and A.-L. Barabasi. Diameter of the world wide web. Nature, 401:130–131, 1999. [2] K. Barnard, P. Duygulu, N. de Freitas, D. A. Forsyth,
D. B. lei, and M. Jordan. Matching words and pictures. Journal of Machine Learning Research, 3:1107–1135, 2003.
[3] K. Barnard, P. Duygulu, and D. A. Forsyth. Clustering art. In IEEE Conf. on Computer Vision and Pattern Recognition, volume 2, pages 434–441, 2001.
[4] K. Barnard and D. A. Forsyth. Learning the semantics of words and pictures. In Int. Conf. on Computer Vision, pages 408–15, 2001.
[5] S. Brin and L. Page. The anatomy of a large-scale hypertextual web search engine. In Proceedings of the Seventh International World Wide Web Conference, 1998.
[6] P. G. Doyle and J. L. Snell. Random Walks and Electric Networks. Kluwer.
[7] P. Duygulu, K. Barnard, N. Freitas, and D. A. Forsyth. Object recognition as machine translation: learning a lexicon for a fixed image vocabulary. In Seventh European Conference on Computer Vision (ECCV), volume 4, pages 97–112, 2002.
[8] C. Faloutsos. Searching Multimedia Databases by Content. Kluwer, 1996.
[9] T. H. Haveliwala. Topic-sensitive PageRank. In WWW2002, May 7-11 2002.
[10] J. Jeon, V. Lavrenko, and R. Manmatha. Automatic image annotation and retrieval using cross-media relevance models. In 26th Annual International ACM SIGIR Conference, July 28-August 1, 2003, Toronto, Canada.
[11] J. Kleinberg. Authoritative sources in a hyperlinked environment. In Proc. 9th ACM-SIAM Symposium on Discrete Algorithms, 1998.
[12] T. G. Kolda and D. P. O’Leary. A semidiscrete matrix decomposition for latent semantic indexing
information retrieval. ACM Transactions on Information Systems, 16(4):322–346, 1998.
[13] J. Li and J. Z. Wang. Automatic linguistic indexing of pictures by a statistical modeling app roach. IEEE Trans. on Pattern Analysis and Machine Intelligence, 25(10):14, 2003.
[14] L. Lovasz. Random walks on graphs: A survey. Combinatorics, Paul Erdos is Eighty, 2:353–398, 1996. [15] O. Maron and A. L. Ratan. Multiple-instance learning
for natural scene classification. In The Fifteenth International Conference on Machine Learning, 1998. [16] Y. Mori, H. Takahashi, and R. Oka. Image-to-word
transformation based on dividing and vector quantizing images with words. In First International Workshop on Multimedia Intelligent Storage and Retrieval Management, 1999.
[17] C. R. Palmer and C. Faloutsos. Electricity based external similarity of categorical attributes. In PAKDD 2003, May 2003.
[18] J.-Y. Pan and C. Faloutsos. VideoCube: a novel tool for video mining and classification. In Proceedings of the Fifth International Conference on Asian Digital Libraries (ICADL 2002), 2002.
[19] C. H. Papadimitriou, P. Raghavan, H. Tamaki, and S. Vempala. Latent semantic indexing: A probabilistic analysis. In PODS 98, 1998.
[20] S. Satoh, Y. Nakamura, and T. Kanade. Name-it: Naming and detecting faces in news videos. IEEE Multimedia, 6(1), January-March 1999.
[21] T. Sellis, N. Roussopoulos, and C. Faloutsos. The R+-tree: A dynamic index for multi-dimensional objects. In 12th International Conf. on VLDB, pages 507–518, Sept. 1987.
[22] J. Shi and J. Malik. Normalized cuts and image segmentation. IEEE Trans. on Pattern Analysis and Machine Intelligence, 22(8):888–905, 2000.
[23] Taher Haveliwala, S. Kamvar and G. Jeh. An analytical comparison of approaches to personalizing PageRank. Technical report, Stanford University, 2003.
[24] G. Tzanetakis and P. Cook. MARSYAS: A framework for audio analysis. Organized Sound, 4(3), 2000. [25] H. Wactlar, M. Christel, Y. Gong, and
A. Hauptmann. Lessons learned from the creation and deployment of a terabyte digital video library. IEEE Computer, 32(2):66–73, February 1999.
[26] L. Wenyin, S. Dumais, Y. Sun, H. Zhang,
M. Czerwinski, and B. Field. Semi-automatic image annotation. In INTERACT2001, 8th IFIP TC.13 Conference on Human-Computer Interaction, Tokyo, Japan July 9-13, 2001.