AN ENGINEERED GENETIC CIRCUIT FOR PROTEIN
GLYCOSYLATION IN ESCHERICHIA COLI
A THESIS SUBMITTED TO
THE GRADUATE SCHOOL OF ENGINEERING AND SCIENCE
OF BILKENT UNIVERSITY
IN PARTIAL FULFILLMENT OF THE REQUIREMENTS FOR
THE DEGREE OF
MASTER OF SCIENCE
IN
MATERIALS SCIENCE AND NANOTECHNOLOGY
By
ERAY ULAŞ BOZKURT
I
AN ENGINEERED GENETIC CIRCUIT FOR PROTEiN GL YCOSYLATION iN ESCHERJCHIA COLI
By Eray Ulaş Bozkurt May 2021
We ceıiify that we have read this thesis and that in our opinion it is fully adequate, in scope and in quality, as a thesis for the degree of Master of Science.
Urartu Özgür Şafak Şeker (Advisor)
.
\
_Fatih inciCeren Özkul Koçak
Approved for the Graduate School of Engineering and Science:
Ezhan Karaşan
Director of the Graduate School
i
ABSTRACT
AN ENGINEERED GENETIC CIRCUIT FOR PROTEIN
GLYCOSYLATION IN ESCHERICHIA COLI
Eray Ulaş Bozkurt
M.Sc. in Materials Science and Nanotechnology
Advisor: Urartu Özgür Şafak Şeker May 2021
Protein glycosylation is one of the most crucial and common post-translational modifications. Glycosylation provides certain advantages to host organisms and extend the proteome beyond genetic material. After the discovery of bacterial
glycosylation mechanisms and especially after its transfer into laboratory work-horse
E. coli, studies utilizing this mechanism increased exponentially. It has been
previously showed that utilizing N-Linked Glycosylation, certain recombinant
proteins have been furnished with improved features, such as stability and solubility. In this study, we utilized N-linked Glycosylation to glycosylate alkaline phosphatase (ALP) enzyme in E. coli and investigate the effects of glycosylation on an enzyme.
Considering the glycosylation mechanism is highly dependent on the acceptor protein, ALP constructs carrying glycosylation tag at different locations of the gene has been created and glycosylation rates have been calculated. The most glycosylated construct has been selected for comparison with the native enzyme. Studies showed that glycosylated ALP performed better at optimal conditions. In order to extend the knowledge on the differences due to glycosylation, several conditions were applied.
ii
Both enzymes were tested at elevated temperatures for different incubation times, different pH conditions, protease treatment and under denaturing conditions. Also, secondary structure analysis was performed for each condition to elaborate on these differences. Experiments showed that glycosylated ALP performs remarkably better at all conditions tested. Therefore, N-linked Glycosylation mechanism can be
employed for enzyme engineering purposes and is a useful tool for industrial applications that require enzymatic activity.
iii
ÖZET
ESCHERICHIA COLI BAKTERİSİNDE PROTEİN
GLİKOLİZLENMESİ İÇİN DEVRE TASARIMI
Malzeme Bilimi ve Nanoteknoloji, Yüksek Lisans Tez Danışmanı: Urartu Özgür Şafak Şeker
Mayıs, 2021
Protein glikozilasyonu, proteinlerin translasyon sonrası değişimleri arasında en önemli ve en çok görülen değişimlerdendir. Glikozilasyon, hücre proteome’una büyük bir çeşitlilik ve pek çok açıdan avantaj sağlar. Bakteriyel glikozilasyon mekanizmalarının keşfedilmesi ve laboratuvarlarda en çok kullanılan E. coli bakterisine aktarılmasından sonra, bu konu üzerine yapılan çalışmalar hız kazanmıştır. Bugüne kadar yapılan çalışmalarda, bazı proteinlerin glikolizlenme mekanizması kullanılmasıyla özelliklerinin geliştirildiği not edilmiştir. Bu özelliklere proteinlerin stabilitesi ve solübilitesi örnek verilebilir. Bu çalışmada, glikolizasyon mekanizması kullanılarak glikolizlenmiş E. coli alkalin fosfataz enzimi üretilmiş ve üretim sonucu oluşan rekombinant protein, doğal hali ile kıyaslanarak incelenmiştir. Bakteriyel glikozilasyon mekanizmasının verimliliği, şeker grubunu kabul eden proteine göre yüksek değişkenlik göstermesi göz önüne alınarak, alkalin fosfataz enziminin birden fazla türevi oluşturulmuştur. Bu türevlerde alkalin fosfataz enzimi, şeker grubunu üzerinde bulunduracak olan glikolizasyon bölgesininin proteinin farklı bölgelerine konulmuştur. En fazla glikozilasyon verimliliğini gösteren türev, doğal alkalin fosfataz enzimi ile karşılaştırılmak için seçilmiştir. Yapılan çalışmalar, ideal şartlar altında, glikozile alkaline fosfataz enziminin, glikozile olmamış alkalin
iv
fosfataz enzimine göre daha iyi performans gösterdiği gözlenmiştir. Aradaki farkı daha iyi gözlemlemek için çeşitli şartlar altında enzim performansları
incelenmiştir.(farklı sürelerde ve farklı sıcaklıklarda inkübasyon, farklı pH şartları, proteaz muamelesi ve denaturasyon şartları). Her deney grubu için, proteinlerin ikincil yapılarında meydana gelen değişimler Dairesel Dikroizm (Circular
Dichroism) ile takip edilmiştir. Test edilen her durumda, glikozile alkalin fosfataz enzimi, glikozile olmayan enzime göre daha iyi çalışmıştır. Sonuç olarak,
glikozilasyon mekanizmalarının enzim mühendisliği çalışmalarında ve özellikle enzim aktivitesi gerektiren endüstriyel süreçlerde kullanılmasının avantajlı olabileceği gösterilmiştir.
Anahtar Kelimeler: Protein Mühendisliği, Enzim Kinetiği, N-bağlantılı
v
ACKNOWLEDGEMENTS
First and foremost, I would like to express my gratitude to Dr. Urartu Özgür Şafak Şeker. I started my research career in his lab as an undergraduate 4 years ago, knowing nothing. During this period, I was honored to work as a group member of his, benefitting his knowledge, experience and guidance in both research and life. I would like to thank him for giving me the opportunity to work with him and
providing an environment which I can improve myself and build my career. I would like to thank the jury members for reviewing my work and valuable comments to take my research to the next step.
During my undergraduate years and as a freshman in M.Sc., I received great help and support from Dr. Behide Saltepe and Dr. Ebru Şahin Kehribar. They were my
mentors in the lab and I am happy that I achieved the honor of having publications with both of them. I was great pleasure working alongside them and I would like to thank you for their guidance and patience. I would like to thank İrem Niran Çağıl for contributing my thesis work. She was a quick-learner and she achieved to learn and contributed a lot to my thesis. I also would like to thank to Musa Efe Işılak, Murat Alp Güngen and Nedim Hacıosmanoğlu who spent time on our work and contributed the publications. I also would like to thank to Recep Erdem Ahan for his constructive comments and suggestions on every project I was working on. He was there all the time to answer my questions. Lastly, Gizem Makas, our lab manager was working closely with us to keep things running smoothly, I would like to thank her for her cooperation and support.
During this journey, I was fortunate to build great relationships as well. Firstly, I would like to thank Behide Saltepe for her friendship. We spent lots of time together.
vi
She made tiring and long-lasting experiments fun. She was there for me when I was down and it would be much harder, if she was not around. I cannot thank her enough for her support and help. I also would like to thank Cemile Elif Özçelik for our nice conversations during breaks. Especially, I really enjoyed our coffee routines during the day which helped me to keep my mind out of work. I also would like to thank Nilsu Turay for her good companionship. We always had great conversations and had lots of fun during the little time we could spare. Çisil Köksaldı and Gökçe Özkul was very nice to me all the time and I feel lucky to have them as friends.
I also would like to thank the past and current SBL group members ( Ahmet Hınçer, Anooshay Khan, Büşre Merve Kırpat, Dr. Ebru Aras, Goozel Binte Shadid, Julian Ostaku, Merve Erden Tüçer, Merve Yavuz, Nedim Kurt, Sıla Köse, Suat Tüçer) for their cooperation. I also would like to thank my iGEM Team members (Artun Bülbül, Azra Atabay, Berk Ürgen, Büşra Nur Ata, and Ezgi Dikici). We started together to learn synthetic biology and made many contributions to each other during this process. We also worked as a team for two years and accomplished a lot. I really enjoyed being a part of such team.
Lastly, I would like to express my deepest gratitude to my family for their endless support. I would not be able to be who I am, if it was not for them. I would like to thank my mother, Nuran Bozkurt, my father, Yaşar Bozkurt and my sister, Seray Başak Bozkurt.
vii
Table of Contents
CHAPTER 1 ... 1
1. Introduction ... 1
1.1. Glycosylation as a Post Translational Modification ... 1
1.2. Bacterial Glycosylation ... 3
1.3. Campylobacter jejuni N-Linked Glycosylation ... 6
1.4. Utilization of Glycosylation Systems in Synthetic Biology ... 9
1.5. The Aim of the Study ... 10
CHAPTER 2 ... 12
2. Materials and Methods ... 12
2.1. Buffers, Media and Strains ... 12
2.2. Cloning and Transformation ... 18
2.3. Protein Expression ... 19
2.4. SDS-PAGE, Western Blot and Lectin Blot ... 20
2.5. Glycosylation Rate Calculations ... 22
2.6. Protein Purification and Buffer Exchange ... 22
2.7. Unit Enzyme Calculations... 24
2.8. Alkaline Phosphatase Activity Assays ... 24
2.8.1. Enzyme Activity at Optimal Conditions ... 24
2.8.2. Preparation of Enzymes for Assessment of Enzyme Activity at Elevated Temperatures 25 2.8.3. Preparation of Enzymes for Assessment of Enzyme Activity at Different pH Values . 25 2.8.4. Preparation of Enzymes for Assessment of Enzyme Activity upon Protease Treatment 25 2.8.5. Preparation of Enzymes for Assessment of Enzyme ... 26
Activity under Denaturant Conditions ... 26
2.9. Circular Dichroism ... 26
2.9.1. Acquisition of CD Data for ALP at Elevated Temperatures ... 27
CHAPTER 3 ... 28
3. Results and Discussion ... 28
3.1. Design and Cloning of the Constructs ... 28
3.2. Expression and Purification of ALP Variants ... 30
3.3. Glycosylation Rate Calculation ... 32
viii
3.5. Enzyme Activity Comparison of Nonglycosylated and Glycosylated ALP ... 41
3.5.1. Enzyme Activity and Secondary Structure Assessment at Elevated Temperatures .... 45
3.5.2. Enzyme Activity and Secondary Structure Assessment at Different pH ... 52
3.5.3. Enzyme Activity Assessment upon Protease Treatment ... 55
3.5.4. Enzyme Activity and Secondary Structure Assessment under Denaturant Conditions 57 CHAPTER 4 ... 58
4. Conclusion ... 58
4.1. References ... 60
4.2. Appendix A ... 63
4.2.1. DNA Sequences of Genes ... 63
4.3. Appendix B ... 84
4.3.1. List of Primers ... 84
4.4. Appendix C ... 85
4.4.1. Plasmid Maps ... 85
4.5. Appendix D ... 91
4.5.1. Sanger Sequencing Results ... 91
4.6. Appendix E ... 92
ix
LIST OF FIGURES
Figure 1: Post-Translational Modifications shared by all life forms. Created with
BioRender.com. Adapted from Wang et al.[1] ... 1
Figure 2: N-linked glycosylation mechanism in eukaryotes. Created with Biorender.com ... 3
Figure 3: C. jejuni pgl glycosylation pathway. Created with Biorender.com. Adapted from Tan et al. ... 7
Figure 4: PCR result of pglB amplification. ... 28
Figure 5: Digest Result of ALP DQNAT pET22B. ... 29
Figure 6: Colony PCR results of T7 pglB ALP-DQNAT pET22b Amp. ... 29
Figure 7: Created ALP Variants was created to assess Glycosylation Rate. ... 30
Figure 8: Western Blot Results of Created ALP Variants. ... 31
Figure 9: Lectin Blot Results of created ALP Variants. ... 31
Figure 10: Calculated glycosylation rate by Vilber Evolution Edge software. (n=3) 32 Figure 11: The representation of pglB overexpressing ALP variant, T7 pglB ALP-DQNAT + pgl-pACYC. ... 33
Figure 12: pglB Overexpressing version of ALP variant performs better in terms of glycosylation. ... 34
Figure 13: PglB overexpression enhanced the glycosylation rate. ... 35
Figure 14: Lectin Blot of pglB ALP-DQNAT indicates that ALP-DQNAT is glycosylated... 35
Figure 15: Putative N-linked glycosylation analysis results performed by GlycoPP software. ... 37
Figure 16: SDS-PAGE result of the purified DQNAT and Glycosylated ALP-DQNAT ... 39
x
Figure 17:Western Blot result of ALP-DQNAT and Glycosylated ALP-DQNAT ... 40 Figure 18: Lectin Blot results of purified DQNAT and Glycosylated ALP-DQNAT ... 40 Figure 19: Comparison of ALP and Glycosylated ALP. Glycosylated ALP obtained higher catalysis activity. ... 42 Figure 20: Normalized enzyme activities of DQNAT and Glycosylated ALP-DQNAT at optimal conditions. ... 43 Figure 21: Secondary structure analysis performed to assess the differences between non-glycosylated and glycosylated ALP and predicted secondary structures. ... 44 Figure 22: ALP-DQNAT and Glycosylated ALP-DQNAT are treated with varying temperatures. ... 45 Figure 23: Enzyme Kinetics of ALP-DQNAT and Glycosylated ALP-DQNAT at 55℃ for different treatment times. ... 47 Figure 24: Enzyme Kinetics of ALP-DQNAT and Glycosylated ALP-DQNAT at 75℃ for different treatment times. ... 48 Figure 25: Enzyme Kinetics of ALP-DQNAT and Glycosylated ALP-DQNAT at 95℃ for different treatment times. ... 49 Figure 26: Secondary structure anaylsis of DQNAT and Glycosylated ALP-DQNAT at elevated temperatures. ... 51 Figure 27: Enzyme activity results of ALP-DQNAT and Glycosylated ALP-DQNAT at different pH conditions... 52 Figure 28: Enzyme Kinetics of ALP-DQNAT and Glycosylated ALP-DQNAT at different pH values. ... 54 Figure 29: Proteinase K treatments of ALP enzymes for different incubation times. 55
xi
Figure 30: Effect of protease treatment on the enzyme activity of ALP-DQNAT and
Glycosylated ALP-DQNAT. ... 56
Figure 31: The plasmid map of pgl-pACYC... 86
Figure 32:The plasmid map of DQNAT-ALP pET22b ... 87
Figure 33: The plasmid map of ALP-DQNAT pET22b ... 88
Figure 34: The plasmid map of ALP-DQNAT (x2) pET22b ... 89
Figure 35: The plasmid map of T7 pglB ALP-DQNAT pET22b ... 90
Figure 36: Sanger sequencing result of DQNAT-ALP pET22b ... 91
Figure 37: Sanger sequencing result of ALP-DQNAT pET22b ... 91
xii
LIST OF TABLES
Table 1: Most studied bacterial glycosylation mechanisms. Adapted from Lu et al. .. 4
Table 2: LB media ingredients required for 1L. ... 12
Table 3: ZYM5052 medium ingredients required for 1L. ... 12
Table 4: 1L of 1M TAE (pH 8.6) buffer ingredients ... 13
Table 5: 50 ml of TSS buffer ingredients and preparation ... 13
Table 6: 10 mM Imidazole (pH 7.4) binding buffer ingredients ... 14
Table 7: 150 mM Imidazole (pH 7.4) elution buffer ingredients ... 14
Table 8: 1L of 0.5M MES buffer (pH 6) ingredients and preparation ... 14
Table 9: 100 ml of 1M Tris-HCl (pH 7.6) ingredients and preparation ... 15
Table 10: 50 ml of 0.1 M Sodium Phosphate buffer (pH 7.4) ingredients and preparation... 15
Table 11: 6x Loading Dye preparation ... 16
Table 12: 1L of 1X Tris Buffered Saline Tween (TBS-T) ingredients ... 16
Table 13: pNPP reaction buffer ingredients ... 17
Table 14: 100 ml of 8M Urea buffer ingredients ... 17
Table 15: Experimental groups utilized in the study . Error! Bookmark not defined. Table 16: Experimental groups for the assesment of enzyme activity upon protease treatment. ... Error! Bookmark not defined. Table 17: The enzyme behaviours calculated for ALP-DQNAT and Glycosylated ALP-DQNAT from enzyme activity assays. ... 42
Table 18: The secondary structure analysis results at different pH conditions. ... 54
Table 19: The DNA sequences of genes that was used in this work. ... 63
1
CHAPTER 1
1. Introduction
1.1. Glycosylation as a Post Translational Modification
The majority of the proteins in eukaryotes is processed after they are formed by ribosome. This process is called Post-Translational Modifications(PTMs). PTMs allow a diversification and create a variety of options in terms of what has been coded by the genome.[1] These modifications play an important role on the biochemical properties of the proteins that are newly formed. They regulate the localization, activity and the association with other molecules.Figure 1: Post-Translational Modifications shared by all life forms. Created with BioRender.com. Adapted from Wang et al.[1]
2
One of the important modifications that cells use to regulate their proteins is glycosylation. Glycosylation is a so common post-translational modification that 70% of all eukaryotic proteins are known to be glycosylated.[2] Protein
glycosylation refers to the attachment of sugar residues to proteins has been thought to be the most complex post-translational modification. Glycosylation is a common phenomenon for all domains of life. Glycosylation was first discovered by Neuberger and colleagues in ovalbumin by defining GlcNAc-β-Asn linkage in 1961 in hen’s egg. After that, in 1989 Wieland and colleagues have discovered that glycosylation in Halobacterium halobium. Furthermore, with the discovery of glycosylation mechanisms in archaea in 1997, Glycosylation is now considered a common phenomenon for all domains of life. [3]
Today, it is a well-known fact that protein glycosylation is crucial in formation of protein structure, signal transduction, immune responses, embriyonic development, interaction between cell and its environment. [4-9] Glycotransferases and
glycosidase enzymes which performs the reaction that attaches carbohydrate groups to proteins are found in endoplasmic reticulum (ER) and Golgi apparatus. [1] Glycosylation can be classified into four main categories in mammalian cells: N-linked glycosylation, O-N-linked glycosylation C-N-linked glycosylation and
3 shared by three domains of life.
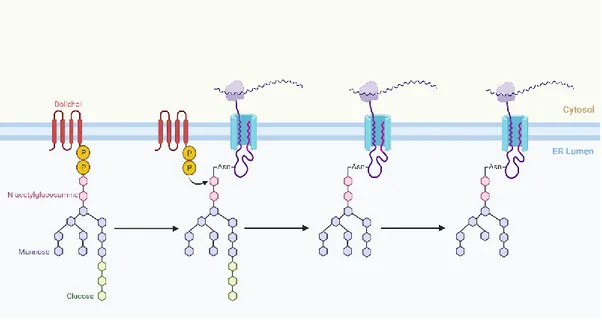
Figure 2: N-linked glycosylation mechanism in eukaryotes. Created with Biorender.com
In eukaryote, dolichol, a polymer of isoprene units that consists the lipid-linked oligosaccharide (LLO) is built on the cytoplasmic side of the cell to the ER lumen. ER lumen contains multi subunit oligosaccharyltransferase enzymes and utilize the glycans are transferred en bloc to the Asparagine residue on the nascent protein during translation.
1.2. Bacterial Glycosylation
In the past decade, protein glycosylation in bacteria has become a hot-spot for glycobiology. With the increasing evidence of protein glycosylation in bacteria, including Campylobacter jejuni, Psedomonas aeruginosa, Neisseria meningitides,
4
[11-17], it became obvious that pathogenicity was common characteristics. Therefore, glycosylation in bacteria was associated with virulence factors. Glycosylation mechanisms in bacteria contributes to adhesiveness of the outer surface. Therefore, pathogenic bacteria can hold on host surfaces.[18]
Like eurkaryotes, glycosylation occurs in variety of ways in bacteria as well:
N-Linked Glycosylation, O-N-Linked Glycosylation and S-N-Linked Glycosylation. N-N-Linked Glycosylation refers to attachment of sugar moieties to the nitrogen atoms of
asparagine or arginine amino acids. O-linked Glycosylation means that sugar groups are added to the hydroxy groups of serine or threonine residues and S-Linked
Glycosylation refers to attachment of sugars onto thiol groups on cysteines.[19]
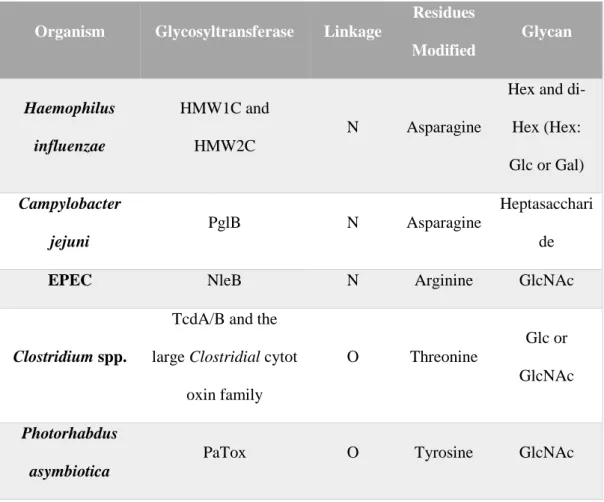
Table 1: Most studied bacterial glycosylation mechanisms. Adapted from Lu et al.
Organism Glycosyltransferase Linkage
Residues Modified Glycan Haemophilus influenzae HMW1C and HMW2C N Asparagine
Hex and di-Hex (di-Hex: Glc or Gal) Campylobacter jejuni PglB N Asparagine Heptasacchari de
EPEC NleB N Arginine GlcNAc
Clostridium spp.
TcdA/B and the large Clostridial cytot
oxin family O Threonine Glc or GlcNAc Photorhabdus asymbiotica
5 Legionella pneumophila Lgts O Serine Glc DAEC/ETEC/Cit robacter rodentium AAH/TibC/BAHTcr (t he BAHT family) O Serine Hep Streptococcus parasanguinis
Gtf1/Gtf2 complex O Serine GlcNAc
Gtf3 O GlcNAc Glc
dGT1 O Glc Glc
N-Linked Glycosylation and O-Linked Glycosylation are the most common pathways in
bacteria kingdom. One of the greatest examples of utilization of N- linked glycosylation mechanism in bacteria is Haemophilus influenza (H. influenzae). H. influenzae, the cause of the disease called nontypeable H. influenza initiates the infection by colonizing the epithelial cells of the host. H. influenzae utilizes two adhesin proteins called HMW1 and HMW2. HMW1 and HMW2 proteins are secreted to outer membrane and play significant role for attaching to the host surface.[20] Another outstanding example is how C. jejuni utilize this mechanism. On the contrary what has been taught previously, the main purpose of the C.
jejuni glycosylation is not adhesiveness. C. jejuni has over 60 proteins that has been
observed to be glycosylated. There are reports suggesting that these proteins may contribute to the fitness of the bacterium in the gut by providing protection from proteases.
Furthermore, free oligosaccharides may play role in osmotic regulation of the bacterium.[18]
O-Linked Glycosylation is also being employed by Clostridium difficile as an effective
virulence factor. C. difficile, the cause of infectiious diarrhea encodes for two toxin proteins called TcdA and TcdB. These proteins have N-terminal glucosyltransferase activity. Once these toxins were internalized by endocytosis, they confer their toxicity by inhibiting Rho GTPase activation. Therefore, they interfere with host’s membrane cycling process, leading the death of the host cell.[21]
6
1.3. Campylobacter jejuni N-Linked Glycosylation
C. jejuni was the first discovered bacterium that is found to N-glycosylate proteins. C. jejuni utilizes a heptasaccharide glycan
(GalNAc-α1,4-GalNAc-α1,4-[Glcβ1,3]-GalNAc-α1,4-GalNAc-α1,4-GalNAc-α1,3-diNAcBac-β1; where diNAcBac is N′,N′-diacetylbacillosamine [2,4-diacetamido-2,4,6 trideoxyglucopyranose]). The operon that performs N-glycosylation is called pgl (protein glycosylation). pgl pathway is composed of 12 genes that completes sequential addition of glycan onto its acceptor protein. It is initiated by formation of uridine diphosphate-di-N-acetyl-bacillosamine (UDP-diNAcBac). PglF enzyme converts UDP-GlcNAc to UDP-2- acetamido-2,6-dideoxy-a-D-xylo-4-hexulose. Then, pglE forms UDP-4-amino-4,6-dideoxy-α-D-GlcNAc. PglD enzyme transfers the acetyl group onto product of pglE, forming UDP-diNAcBac.
The formed UDP-diNAcBac is linked to Und-P by phosphoglycosyltransferase PglC by a pyrophosphate bond. PglA and PglJ perform sequential reactions and catalyze the addition of α 1,3- and α1,4-linked N-acetylgalactosamine. Then, PglH comes into play and adds three α 1,4-linked GalNAc residues on the glycan structure. PglI ends the formation of heptasaccharide that is built on Und-PP lipid carrier. The completed glycan is then flipped as an LLO from the cytoplasmic side of the cell to the
periplasmic site by the help of ABC transporter enzyme, PglK. In the final step, pglB enzyme, an oligosaccharyltransferase, the heptasaccharide is transferred to the glycosylation sequon (D/E-X1-N-X2-(S/T)).[22]
7
Figure 3: C. jejuni pgl glycosylation pathway. Created with Biorender.com. Adapted from Tan et al.
pgl pathway is a highly conserved machinery, given that all Campylobacter species,
except one, demonstrates high similarity. This conservation applies also the reducing end sugars among Campylobacter species. On the other end, through time, other end of the sugars has undergone changes with evolutionary pressure due to
immunogenicity.[23]
After gaining sufficient insights, researchers started to investigate ways to improve and adapt the mechanism to desired applications in various ways. Crystal structure and computational analysis of PglB enzyme revealed important information about the acceptor sequences and required structural features. [24] Directed evolution
8
approach has been employed to create variants of PglB enzyme in order to create better-performing oligosaccharyltransferase.
Work done on PglB uncovered that PglB enzyme has relaxed specificity over
N-glycan residues. This showed that a variety of N-glycan can be utilized to glycosylate
proteins. In 2005, after only three years the mechanism is transferred to E. coli, it has been reported that PglB enzyme can transfer different O-antigens from E. coli and
Pseudomonas aeruginosa. [25] This showed that different N-glycans can be utilized
and novel glycans can be engineered for new applications. Although novel glycan engineering work started before bacterial glycosylation systems discovered, it has been rapidly adopted and employed for bacterial systems as well. In H. pylori, native glycans were modified to include azide-containing groups.[26]
At last, but not least, high-throughput methods were also developed to screen the recombinant glycoproteins. Lectin proteins have been widely used to detect glycoproteins since they are naturally carbohydrate-binding abilities. Lectin microarrays have been developed to satisfy the need. However, they showed increased non-specificity, when they are subject to a test with bacterial glycans. [6]
An array, composed of a large library of oligosaccharides can also be used to test possible glycosylation of native or recombinant proteins. However, these assay are often lack standardization.[27]
A more recent system, called Glycophage Display, have been developed to meet the demand for high-throughput screening. As in the phage display method, phage coat protein g3p is fused to glycoprotein of interest. When phages infect E.coli carrying the N-linked Glycosylation mechanism, the end product becomes a glycosylated
9
protein, and it is displayed on the surface of the phage. Such method is extremely useful for screening, optimization and engineering of large libraries.[28]
1.4. Utilization of Glycosylation Systems in Synthetic
Biology
Shortly after the discovery of N-Linked Glycosylation pathways in bacteria and its successful transfer into E.coli , the power horse of laboratory[29], gave rise to a new discipline known as bacterial glycoengineering. As mentioned before, glycans have many fate-determining effects on proteins that they are attached to. They can regulate folding state and stability of the proteins. They can serve as a quality control check before they are sent to their final destination and have control over the protein’s molecular interactions with environment and other proteins. They also play role in cell-cell interactions and immune response of host cells. [30] Therefore, studies to understand the mechanism better also led to engineering approaches have been developed to control and tune such effects for desired applications.
One of the vaccine subtypes, called conjugate vaccines, are produced by linking polysaccharide antigens with a carrier protein. Conjugation event provides a longer T-cell memory, and such vaccines became highly effective in the battle against pathogenic bacteria. Since chemical conjugation has its drawbacks in terms of cost and time, glycoprotein engineering has been adopted. [23] C. jejuni AcrA protein was glycosylated utilizing N-Linked Glycosylation machinery and employed to fight against Shigella dysenteria.[31] Another groups, utilized C. jejuni CmeA protein and
N-Linked Glycosylation machinery to produce a conjugate vaccine against Brucella abortus. The proposed vaccine showed an IgG response but unable to preform well
10
N-Linked Glycosylation is also a good approach to produce therapeutic proteins to tune biophysical and pharmokinetic properties. Lizak et al. utilized N-linked
glycosylation in E. coli and showed the successful glycosylation of single-chain
antibody (scFv 3D5). It has been reported that N-glycan addition to the antibody increased the proteolytic stability and solubility of the antibody.[24]
1.5. The Aim of the Study
Protein glycosylation is one of the most common post-translational modifications in nature and shared by all three kingdoms of life, archaea, bacteria, and eukaryotes. It plays a fate-determining role for the protein and can alter its behavior in terms of stability, folding, activity and interaction with other molecules as well as with the environment. The discovery of bacterial glycosylation systems and its transfer into the E. coli, gave rise to a new concept in biotechnology: microbial glycobiology. One of the best studied mechanisms, C. jejuni N-Linked Glycosylation offers recombinant production of glycosylated proteins and therefore, allows protein of interest to be altered in terms of its behavior and tuned for desired applications. So far, N-Linked
Glycosylation has been employed to produce glycan-conjugated vaccines and
therapeutic proteins in order to increase their stability and solubility. In this study, we adopted the same machinery to investigate the effects of glycans on enzymes
behavior.
To show our work, we utilized alkaline phosphatase (ALP) enzyme. Since N-linked
Glycosylation is not very efficient system and efficiency changes according to
protein of interest, I first tested different variants of ALP with glycosylation tag (DQNAT) at different locations of ALP in order to investigate the most suitable structure for efficient glycosylation. After finding the best performing one, I worked
11
on improving the glycosylation rate by overexpressing pglB enzyme. After achieving significant glycosylation rate, both unglycosylated and glycosylated ALP enzymes were purified to assess their differences due to glycosylation. Both versions were subject to enzyme kinetics assays, and treated with heat, protease and buffers with different pH in order to analyze the effect of glycosylation on the enzyme and its different behavior, compared to native ALP. Nonglycosylated and glycosylated ALP were also analyzed by circular dichroism (CD) after each treatment in order to obtain a relationship between enzyme kinetics and secondary structure changes.
Overall, it has been known that glycosylation had positive impacts for the protein in terms of its stability and solubility. However, this work uncovers the effect of glycosylation on an enzyme and how glycosylation will affect the activity of the enzyme and many other factors, including but not limited to, their working
conditions in terms of pH and temperature, their resistance to denaturant conditions and protection against proteases.
12
CHAPTER 2
2. Materials and Methods
2.1. Buffers, Media and Strains
Cells were grown in Lysogeny Broth (LB) growth medium for cloning experiments. ZYM5052 autoinduction media was used to inoculate bacteria for protein production.
Table 2: LB media ingredients required for 1L. Tryptone 10 gr
Yeast Extract 5 gr
NaCl 10gr
Table 3: ZYM5052 medium ingredients required for 1L.
Tryptone 10 g
Yeast Extract 5 g
Disodium Phosphate (Na2HPO4) 3.55 g
Monopotassium Phosphate (KH2PO4) 3.4 g
Ammonium Chloride (NH4Cl) 2.67 g
Sodium Sulfate (Na2SO4) 0.71 g
13
Trace Metals (50.000x) 20 μl
Glycerol 5 ml
Glucose Monohydrate 0.5 g
Lactose 2 g
TAE buffer was used both for agarose gel preparation and as running buffer in agarose gel electrophoresis.
Table 4: 1L of 1M TAE (pH 8.6) buffer ingredients. 2M Tris Base 242 g
1M Disodium EDTA 18.61 g
1M Acetic Acid 59.955 g
Chemically competent cells were prepared by TSS buffer for cloning experiments.
Table 5: 50 ml of TSS buffer ingredients and preparation. 10% Polyethylene glycol 5 g
5% Dimethyl Sulfoxide 2.5 ml
20mM MgCl2 1 ml
Autoclaved LB to 50 ml
Different concentrations of imidazole buffer were used for protein purification in binding and elution steps.
14
Table 6: 10 mM Imidazole (pH 7.4) binding buffer ingredients. 20mM Sodium Phosphate
0.5M NaCl
10mM Imidazole
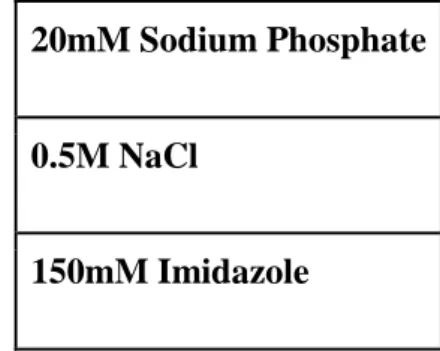
Table 7: 150 mM Imidazole (pH 7.4) elution buffer ingredients. 20mM Sodium Phosphate
0.5M NaCl
150mM Imidazole
Cobalt Resin which was used for protein purification was regenerated by MES buffer.
Table 8: 1L of 0.5M MES buffer (pH 6) ingredients and preparation.
MES (free acid) 97.6 g (dissolve in 800 ml ddH2O)
NaOH (to adjust pH to 6)
ddH2O to 1L
Proteins were buffer exchanged to Tris-HCl to determine the activity depending on the temperature and incubation time.
15
Table 9: 100 ml of 1M Tris-HCl (pH 7.6) ingredients and preparation.
Tris base 12.11 g
Deionized H2O (diH2O) 80 ml
HCl (to adjust pH to 7.6)
dH2O to 100 ml
Sodium Phosphate buffer was used to exchange the buffer of proteins to examine the activity change depending on pH to eliminate the effect of chloride ion in CD
experiments.
Table 10: 50 ml of 0.1 M Sodium Phosphate buffer (pH 7.4) ingredients and preparation.
1 M Na2HPO4 3.87 ml
1 M NaH2PO4 1.13 ml
NaOH or H3PO4 (to adjust the pH to 7.4)
16
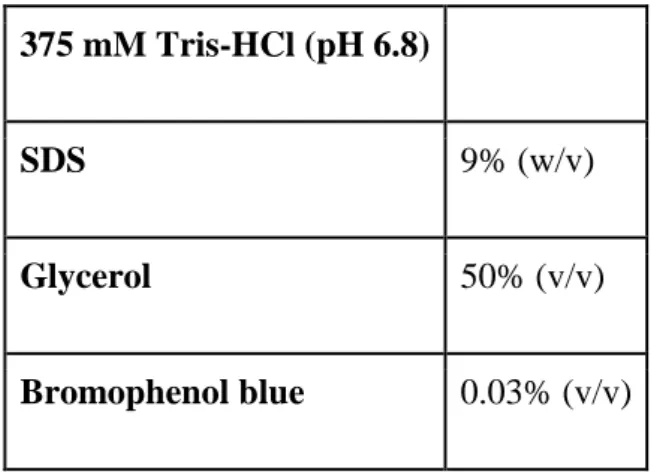
6X Loading Dye was used to visualize the samples during the run on SDS gel.
Table 11: 6x Loading Dye preparation.
375 mM Tris-HCl (pH 6.8)
SDS 9% (w/v)
Glycerol 50% (v/v)
Bromophenol blue 0.03% (v/v)
Washing and antibody incubation for immunoblotting experiments was performed with Tris Buffered Saline (TBS) containing two different amounts of Tween: 0.1% and 0.05%.
Table 12: 1L of 1X Tris Buffered Saline Tween (TBS-T) ingredients. TBS-T (0.1%) TBS-T (0.05%)
10X TBS 100 ml 100 ml
Tween 20 Detergent 1 ml 0.5 ml
diH2O 900 ml 900 ml
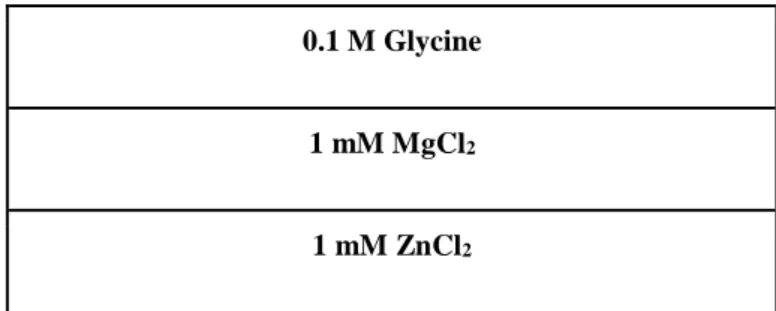
Enzyme activity is measured by catalysis of one of the substrates of Alkaline Phosphatase which is pNPP. Different concentrations of pNPP are prepared with pNPP reaction buffer.
17 Table 13: pNPP reaction buffer ingredients.
0.1 M Glycine
1 mM MgCl2
1 mM ZnCl2
Urea buffer was used to test the activity and structural change in proteins.
Table 14: 100 ml of 8M Urea buffer ingredients.
Urea 48.048 g (dissolved in 50 ml ddH2O)
ddH2O to 100 ml
E. coli DH5α strain (New England Biolabs, Inc) was used in cloning experiments.
Bacterial Growth Conditions
E. coli cell stocks were prepared with 50% sterile glycerol diluted at 1:2 in LB media
containing the cells and stored at -80 ℃. They were inoculated from the stock in LB media into falcons overnight at 200 rpm at 37 ℃ for cloning. They were also
inoculated from the stock in ZYM5052 into either falcons or Erlenmeyer’s for 20-24 hours at 200 rpm at 37 ℃ for protein purification and whole-cell immunoblotting. Corresponding antibiotics were diluted at 1:1000 in those media.
18
2.2. Cloning and Transformation
Plasmids and primers that were constructed were designed using Benchling. PCR reactions were performed using Q5 High-Fidelity DNA Polymerase (New England Biolabs Inc.) by following the manufacturer’s instructions. Primers that were used in PCR reactions were ordered from Oligomer. Annealing temperatures for PCR reactions were calculated using NEB Tm Calculator tool.
At the end of each PCR reactions, 20 µL of the amplicon was mixed 6X purple loading dye (New England Biolabs Inc) and run on 1% agarose gel. Agarose gels were prepared by dissolving 0.6g of agarose in 60 mL 1X TAE buffer. Agarose gel electrophoresis was performed at 140V for 30 min. 1 kb+ Ladder (New England Biolabs Inc) was used to track DNA fragment lengths. After electrophoresis, agarose gels were visualized using Blue light transilluminator. Desired bands were excised, and gel extracted using Macherey-Nagel GmbH & Co. kit following manufacturer’s instructions. The yield was measured using Nanodrop 2000 spectrophotometer (Thermo Fisher).
Restriction Digestion was performed using New England Biolabs enzymes and by following the instructions. At the end of each reaction, digested fragments were run on 1% agarose gel and extracted using Macherey-Nagel GmbH & Co. PCR Clean-Up kit. Ligation reactions were set up according to manufacturer’s protocols.
To prepare competent cells, glycerol stocks were incubated overnight at 37℃ 200 rpm shaking incubator. Growing cells were diluted at 1:100 and incubated at 37℃ until the cells reached OD600 0.4 and 0.6. Cells were centrifuged at 10.000 g for 10
19
min at 4℃ supernatants were removed and resuspended in 1:10 TSS buffer. The cells were aliquoted as 100 µL and stored at -80℃.
Definitive version of the constructed plasmids was transformed into competent cells. Competent cells were first thawed on ice and plasmid was added onto cells. After 20 minutes of incubation, cells were applied 42℃ heat for 30 seconds and placed on ice for 2 min to complete the heat-shock procedure. 1 mL LB was added to each tube and incubated at 37℃ for 1 hour. Cells were centrifuged at 8000 g for 5 minutes, supernatant was removed. Cells were resuspended in residual supernatant and overlaid on agar plates with appropriate antibiotics. Agar plates were incubated at 37℃ overnight. Next day, colonies were picked, and colony PCR was performed. Positive colonies were selected, inoculated into LB media, and incubated at 37℃ overnight in a shaking incubator. Plasmids were isolated from grown cultures using Gene-JET Miniprep Kit (Thermo Scientific) and plasmid concentrations were measured using Nanodrop 2000. Plasmids were sent for sequencing (Genewiz Inc) for verification.
2.3. Protein Expression
200-400 ml of cells containing ALP DQNAT and 400-600 ml of cells containing Glycosylated ALP DQNAT were inoculated from stock in ZYM5052 autoinduction media into Erlenmeyer flasks with corresponding antibodies. After 20-24 hours, cells were transferred to ultracentrifuge tubes and centrifuged at 3500 rcf for nearly 30 min. Supernatant was discarded and the pellet was resuspended by 10 mM imidazole buffer (pH 7.4). 1 mM of phenylmethanesulfonylfluoride (PMSF) (AMRESCO Inc.) was added. Lysing procedure was done via sonication. 30 seconds of pulse-on and 59 seconds of pulse-off were applied 5 times to bacteria with 0.35 amplitude. Then, they
20
were centrifuged at 12000 rpm for 1 hour. Supernatant was collected as total protein and stored at +4 ℃.
Protein Extraction from Periplasmic Space
100 ml of cells were inoculated from the stock in ZYM5052 autoinduction media into an Erlenmeyer flask. After induction was completed in nearly 20 hours, the pellet of the cells was resuspended with 5mL of 30mM Tris (pH 7.5) at 4°C. Then, they were centrifuged at 6,000g for 15 minutes at 4°C. Supernatant was discarded and pellet was resuspended again with 30mM Tris (pH 7.5) containing 20% sucrose. The solution was incubated at room temperature for 15 minutes and centrifuged at 6,000g for 20 minutes at 4°C. Supernatant was collected as the extract from periplasmic space.
2.4. SDS-PAGE, Western Blot and Lectin Blot
Whole-cell western blotting and lectin blotting were performed for verifications of recombinant protein production. Cells were inoculated from stock in ZYM5052 autoinduction media with appropriate antibiotics into falcons at 200 rpm at 37 ℃. After 20-24 hours, cells were precipitated at 3500 rpm for 5 min and the supernatant was discarded. The pellet was dissolved with different amounts of water to reach different concentrations. Heat inactivation was applied at 95℃ for 5 min. 20 ul of cell extracts were run on SDS gel prepared via BioRad SDS Gel casting system by using 6x Loading Dye. 120 V was applied to the gel when proteins were in
separating gel and the voltage was increased to 150 V for the rest of the run.
For SDS-PAGE, the gel was put into the Coomassie blue staining dye and heated but not boiled by microwave. Then, the gel was incubated on a shaker for 1 hour. After
21
washing the excess dye with water, destaining solution was added. The gel was washed again and visualized by Image Lab Software (Bio-Rad).
For the immunoblotting part, proteins were transferred into polyvinylidene difluoride (PVDF) membrane (Thermo Fisher Scientific). Filters were put into Turbo Transfer buffer (Bio-Rad) and placed on the cassette. The PVDF membrane was activated by methanol in nearly 5 min and put in buffer. By putting the membrane between filters, the sandwich was generated. Semi-dry transferring via Transblot Turbo Transfer System (Bio-Rad) was applied in 7 min.
Western Blotting
Blocking of the membrane was done for 2 hours in 1x Tris Buffer Saline Tween (TBS-T (0.1%)) and 5% skimmed milk. Then, the membrane was incubated for 1 hour with primary antibody (His-Tag Mouse McAb) (Proteintech Europe) diluted at 1:10000 in blocking solution. Wash steps were performed in 1x TBS-T (0.1%) three times for 5-, 10-, and 10-min. Incubation with secondary antibody (HRP conjugated goat anti-mouse) (Abcam) diluted at 1:10000 in blocking solution was completed in 1 hour. Finally, wash steps are performed again. Visualization of the membrane was done by HRP-conjugate secondary detection reagent. Enhanced chemiluminescence (ECL) (Bio-Rad) solution was prepared by mixing 500 μl of Clarity Western
Peroxide Reagent with 500 μl of Clarity Western Luminol/Enhancer Reagent. After pouring the ECL solution onto the membrane, it was incubated for nearly 2 min in dark. Finally, the membrane was visualized via Image Lab Software (Bio-Rad).
22 Lectin Blotting
Blocking of the membrane was done for 1 hour in filtered 1x TBS-T (0.05%) and 3% BSA. Then, the membrane was incubated for 2 hours with primary antibody diluted at 1:5000 in blocking solution. Wash steps were performed in filtered 1x TBS-T (0.05%) five times for 5 min each. Visualization of the membrane was done by ECL (Bio-Rad).
2.5. Glycosylation Rate Calculations
Western Blotting analysis was used to calculate glycosylation rate of the constructs. Cells were grown in ZYM5052 as either 3 mL exclusively western blot or as a large batch for protein purification following western blotting. Grown cultures were centrifuged, resuspended in water and 6X SDS loading dye was added. Prepared samples were heated at 95℃ for 5 minutes. Western Blotting was performed according to the Immunoblotting section. After visualization of western blot with Vilber Lourmat FUSION SOLO 6 imaging system, the analysis of bands was performed using Vilber Evolution Capt Edge software. Band intensity analysis was performed to the bands in each lane separately. By calculating each band intensity in one lane, slower migrating band intensity, which corresponds to the glycosylated ALP, was proportioned to the total intensity coming from the lane. Two replicates were used for consistency.
2.6. Protein Purification and Buffer Exchange
Cobalt resin stored at +4 ℃ with EtOH was regenerated by washing with ddH2O and MES buffer respectively after discarding EtOH. Binding buffer which is 10 mM imidazole was added to the resin and then discarded. Lysis supernatant was
23
transferred on top of the resin and the mixture was rotated for 1 hour to make the His-tagged ALP bind to the resin. Unbound proteins were collected separately, and the cobalt resin was washed three times with binding buffer. Then, elution was performed three times by elution buffer which is 150 mM imidazole buffer (pH 7.4). After each use, the cobalt resin was regenerated again by washing with ddH2O and MES buffer, and EtOH was added on top of the resin for storage.
Protein Quantification
Buffers of the proteins were exchanged with three different buffers for further experiments via Hi-Trap Desalting column (Sigma Aldrich). Proteins in 25 mM Tris (pH 8) were used to test the activity depending on temperature, incubation time, and pH. Sodium Phosphate buffer was used to observe the changes in structures of the proteins in solutions with different pH via Circular Dichroism (CD). The buffer also exchanged with 8 M urea solution to indicate both the activity and structural change of proteins. After equilibrating the column with 10 ml ddH2O and 5 ml of buffer, 1.5 ml of proteins were collected with 2 ml of buffer. Then, BCA Assay (Thermo Fisher Scientific) quantification was performed. BCA standards were prepared by diluting from 2 mg/ml of stock solution. BCA Working Reagent was prepared by mixing 50 parts of Reagent A and 1 part of Reagent B. 200 ul of working reagent was added to 25 ul of standards and proteins. After gently shaking on shaker for 30 sec, the reaction was incubated at 37℃ for 30 min. Absorbance values of standards and samples were measured at 540 nm. Finally, concentrations of the proteins were calculated by using the standard curve created by standards.
24
2.7. Unit Enzyme Calculations
Both unglycosylated and glycosylated ALP was purified, and buffer exchanged to 25 mM Tris (pH 8.0). pNP dilutions, which is the final product after ALP enzyme function, were prepared. 7 serial dilutions of both ALP enzymes were prepared and mixed with 0.5 mM pNPP. Reactions were placed into a spectrophotometer
(SpectraMax M5, Molecular Devices) which was pre-set to 37℃ and kinetic
measurement was taken for 20 minutes for 30 seconds intervals. Reaction velocities were calculated and the interpolated enzyme concentration which catalyzes 1 µM pNP / min was selected as 1 unit of enzyme.
2.8. Alkaline Phosphatase Activity Assays
Proteins were diluted to 2μg/ml to get 1 U of each. Enzymatic activity was calculated by measuring the catalysis of pNPP substrate. pNPP substrate solutions were
prepared with pNPP reaction buffer. Different pNPP concentrations (0 mM, 1 mM, 2mM, 3 mM, 4 mM, and 5 mM) were used to create the Michaelis-Menten kinetics graph.
2.8.1. Enzyme Activity at Optimal Conditions
50 μl of 2 ug/ml proteins were put in each well and incubated at 37℃ in the incubator for 10 min to make them reach optimal temperature. The M5 microplate reader was also adjusted to 37℃. 50 μl of pNPP substrate concentrations were added on top of the proteins with a multichannel pipette rapidly. The absorbance of well at 405 nm was measured at 37℃ and reaction rate was calculated using the pNP standard curve.
25
2.8.2. Preparation of Enzymes for Assessment of Enzyme
Activity at Elevated Temperatures
Enzyme activity was measured in elevated temperatures with different incubation times to observe the resistance of the protein. 2 ug/ml proteins incubated at 3
different temperatures: 55, 75, 95℃, for 4 different incubation times: 10, 30, 60, 120 min. Temperatures were adjusted by using thermal cycler (Bio-Rad). As indicated previously, 50 μl of 2 ug/ml proteins and 50 μl of pNPP substrate concentrations were put in each well and the absorbance of well at 405 nm was measured at 37℃ and reaction rate was calculated using the pNP standard curve.
2.8.3. Preparation of Enzymes for Assessment of Enzyme
Activity at Different pH Values
Effect of pH on the enzymatic activity was measured by diluting proteins to 2 ug/ml with 25 mM Tris having pH 5, 6, 7, 8, 9, 10, 11. The same procedure was applied to measure the absorbance and calculate the reaction rate. Initial assays only include a rough enzyme activity measurement utilizing only 1 pNPP concentration. After determining the working range for both nonglycosylated and glycosylated ALP,
Michealis-Menten enzyme kinetics experiments were performed.
2.8.4. Preparation of Enzymes for Assessment of Enzyme
Activity upon Protease Treatment
Enzymatic activities of 2 ug/ml proteins were calculated and compared in the
presence of different Proteinase K concentrations (100 uM, 20 uM, 10 uM, 5 uM, 0.5 uM, 0.05 uM, 0.005 uM, 0.0005 uM) with different incubation time (60, 120, 240
26
min). 50 μl of 2 ug/ml proteins and 5 μl of Proteinase K was added to each well and the plate was incubated at 37℃ in the incubator for different time periods. This step was repeated for each Proteinase K concentration and incubation time. The same procedure was applied to measure the absorbance and calculate the reaction rate.
2.8.5. Preparation of Enzymes for Assessment of Enzyme
Activity under Denaturant Conditions
Enzymatic activities of 2 ug/ml proteins were calculated and compared in 8 M urea solution. After the protein purification step, buffer exchange procedure was applied to proteins with 8 M urea. The proteins were diluted to 2 μg/ml to get 2 ug/ml of proteins by 25 mM Tris-HCl. 50 μl protein and 50 μl pNPP substrate concentrations were added to each well. The same procedure was applied to measure the absorbance and calculate the reaction rate.
2.9. Circular Dichroism
Circular Dichroism (CD) is a commonly used to analyze secondary structure of the protein of interest. In this work, I have utilized CD (JASCO J-815) to analyze unglycosylated ALP and glycosylated ALP structures. For optimal conditions, both enzymes were prepared as 1 µM in Tris buffer (pH 8.0). Three channels were selected as circular dichroism, voltage, and absorbance. Digital integration time (D.I.T) was selected as 4 seconds. Band width was 1 nanometer. Wavelength range was selected as 190 nm – 250 nm. Sensitivity is selected as standard. Scanning speed was set 100 nm/min. Accumulation mode was set to 3 repeats. A blank measurement was first taken as Tris (pH 8.0) at the beginning of each experiment. For optimal
27
conditions, in order to assess the secondary structure of unglycosylated ALP and glycosylated ALP, both enzymes were arranged to 1 µM in pH 8.0 Tris.
2.9.1. Acquisition of CD Data for ALP at Elevated
Temperatures
In order to track changes due to elevated temperatures, both unglycosylated ALP and glycosylated ALP were subjected to heat. Both enzymes were treated with heat at 55℃, 75℃, and 95℃ for 2 hours. After that, samples were immediately measured wit CD.
28
CHAPTER 3
3. Results and Discussion
3.1. Design and Cloning of the Constructs
The ALP variant constructs used in this study were designed by former lab member Musa Efe Işılak. pgl-pACYC containing DH10B cells were gifted by Markus Aebi. After selecting the construct with the highest glycosylation, pglB enzyme in the pgl pathway was amplified by primers that contain appropriate sites for Gibson
Assembly.
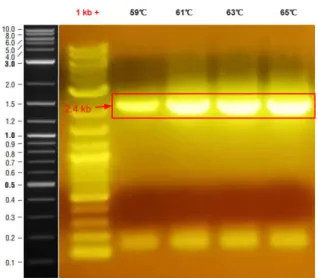
Figure 4: PCR result of pglB amplification.
According to the gel result, pglB was successfully amplified at expected size. Next,
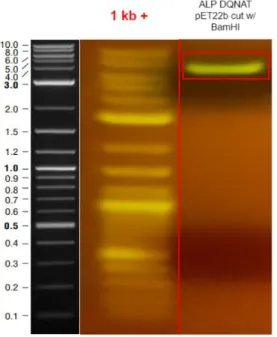
the circuit with the highest glycosylation, ALP-DQNAT w/ pgl were digested with BamHI to insert pglB enzyme.
29 Figure 5: Digest Result of ALP DQNAT pET22B.
Restriction digest result confirms the single digestion of ALP DQNAT pET22b plasmid. The PCR and Digest products were extracted from agarose gels. Gibson Assembly was performed according to manufacturer’s instructions. The Gibson Assembly product was transformed to Dh5α cells and overlaid to agar plate with appropriate antibiotics. The plate was incubated overnight at 37℃. After colonies were observed, 8 colonies were picked for colony PCR.
30
According to colony PCR results, Colony #2 and #4 were sent for Sanger
Sequencing and verified. Glycerol stocks were prepared from overnight cultures.
Electro transformation was performed for pgl-pACYC plasmid due to its size. Pgl-pACYC containing Bl21 DE3 cells were made competent, and the constructed plasmids were chemically transferred to BL21 DE3 cells.
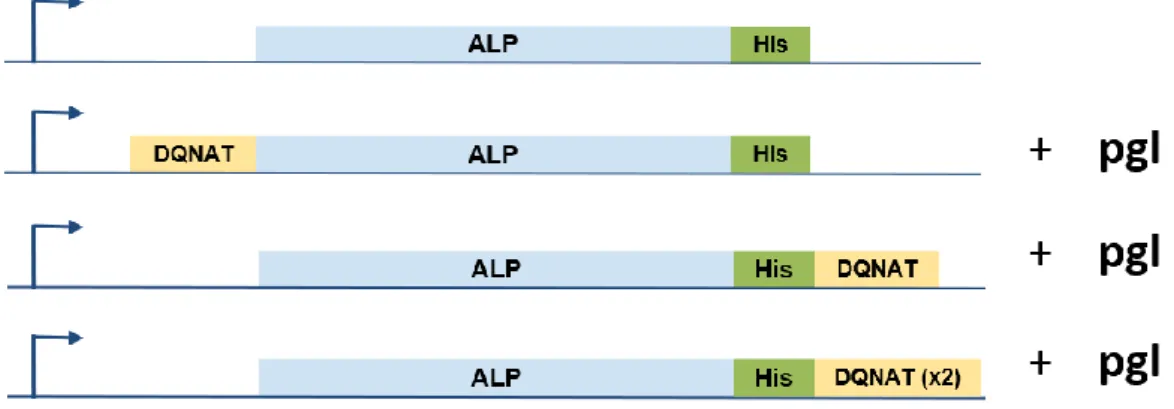
3.2. Expression and Purification of ALP Variants
Three different ALP Variants; one with N-terminus glycosylation tag, one with C-terminus glycosylation tag and one with two glycosylation tag at the C-C-terminus was created.
Figure 7: Created ALP Variants was created to assess Glycosylation Rate.
BL21 DE3 cells containing ALP-DQNAT pET22b, DQNAT-ALP pET22b + pgl-pACYC, ALP-DQNAT pET22b+pgl-pgl-pACYC, pglB ALP DQNAT(x2) pET22b + pgl-pACYC plasmids were grown and whole-cell western blot was performed to check expression of ALP variants.
31
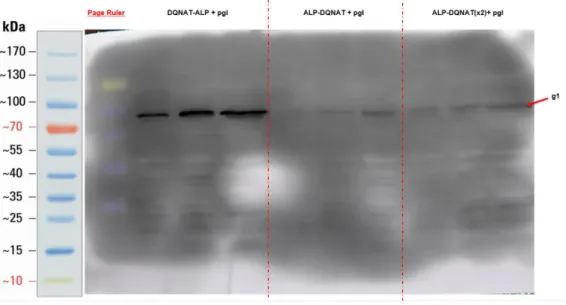
Figure 8: Western Blot Results of Created ALP Variants.
According to Western Blot results, it was observed that ALP-DQNAT has one band, while other constructs have two bands in each lane. The higher band in each lane corresponds to glycosylated version of ALP enzyme produced in the cells. The higher band is denoted as “g1”. The lower band corresponds to remaining ALP which are not glycosylated and denoted as “g0”. Glycosylation of this constructs were confirmed by Lectin Blot.
32
After showing the successful glycosylation, to select the best performing construct, a glycosylation rate analysis must be performed.
3.3. Glycosylation Rate Calculation
According to the results, there are differences in glycosylation amounts of each ALP variant. To calculate these differences, Bands in each lane in western blot images were compared to each other (as g1/(g0+g1) and a ratio was determined for each construct.
Figure 10: Calculated glycosylation rate by Vilber Evolution Edge software. (n=3)
Calculation of glycosylation rates indicated that the highest glycosylation rate can be achieved, when DQNAT motif was placed at the C terminus of ALP enzyme.
Furthermore, increasing the number of DQNAT motifs did not enhance the
glycosylation rate. On the contrary, a slight decrease has been observed. According to the results, ALP-DQNAT pET22b + pgl-pACYC was selected as the best
33
adequate to make a meaningful comparison between Nonglycosylated (g0) and glycosylated ALP enzymes (g1). Therefore, new strategies had to be adopted to further increase the glycosylation rate.
3.4. Overexpression of PglB Enzyme
To increase the glycosylation rate, the key enzyme in the glycosylation pathway, pglB can be overexpressed. To achieve this, the best performing ALP variant construct, ALP-DQNAT + pgl, which has 45% glycosylation rate, was selected and pglB enzyme was integrated into ALP-DQNAT pET22b plasmid. Figure shows the representation of the construct.
Figure 11: The representation of pglB overexpressing ALP variant, T7 pglB ALP-DQNAT + pgl-pACYC.
After successfully cloning the T7 pglB ALP-DQNAT + pgl-pACYC, the BL21 DE3 cells containing the construct was grown in ZYM5052 medium and whole cell
34
western blot was performed to assess the glycosylation rate.
Figure 12: pglB Overexpressing version of ALP variant performs better in terms of glycosylation.
According to the results, T7 pglB ALP-DQNAT + pgl-pACYC yields three band in each lane. In the literature, there are examples of such results in Western Blot, when using the same glycosylation pathway and it indicates double glycosylation on the same protein. Considering that, proteins get heavier when glycosylated, the most upper band corresponds to the di-glycosylated version of ALP, denoted as “g2”, the middle band corresponds to mono-glycosylated ALP, denoted as “g1” and the lower band corresponds to non-glycosylated ALP, denoted as “g0”. It can be said that pglB overexpression enhanced the glycosylation. Therefore, a new glycosylation rate by comparing glycosylated bands to non-glycosylated band as (g1+g2)/(g0+g1+g2), has been calculated.
35
Figure 13: PglB overexpression enhanced the glycosylation rate.
According to glycosylation rate results, overexpression of pglB, enhanced the glycosylation rate from 45% to 73%. Glycosylation of pglB ALP-DQNAT + pgl-pACYC was confirmed by Lectin Blot.
Figure 14: Lectin Blot of pglB ALP-DQNAT indicates that ALP-DQNAT is glycosylated.
36
When a comparison is made between Western Blot and Lectin Blot, it is observed that Western Blot suggests that two glycosylation states of ALP-DQNAT (mono-glycosylated and di-(mono-glycosylated). However, Lectin Blot results indicates only one band, meaning there is only one state of glycosylation, in this case,
mono-glycosylation. One possible explanation is that the affinity of antibodies that are used in Lectin Blot to sugar moieties is lower than the affinity of antibodies used in
Western Blot against His tag residues. This may clarify the difference in Western and Lectin Blot results. Another explanation, since glycan residues are placed on
DQNAT motif on the protein of interest by PglB enzyme, placing of two glycan residues on only five amino acid residues could cause a steric hinderance effect. Therefore, di-glycosylated state cannot be recognized by the Lectin Blot antibodies. Another possible explanation of observing two different bands can be utilization of two different glycan residues. It has been previously stated that the last glucose residue is not a constraint to complete glycosylation process.[32] It is known that C.
jejuni utilizes only one type of sugar moiety, glycan residue, the lack of the last
glucose on glycan structure may result in three different sized bands. Furthermore, utilization of pgl pathway may interfere with E.coli’s native pathways. It is also known that pglB enzyme has a relaxed specificity, which refers to possible glycosylation sites on the acceptor protein. [33] Glycosylation can be occurred at another site on ALP enzyme which has resemblance to the recognition motif of pglB enzyme, along with the current glycan addition to the glycosylation tag, DQNAT. [34] To test this, GlycoPP, an online tool to define putative glycosylation sites were used. The tool allows identification of N-linked and O-linked glycosylation sites prokaryotes. [35] Analysis of putative N-linked glycosylation sites revealed that six more potential glycosylation sites. Among them, three sites were scored significantly
37
better and near to the actual glycosylation sequon, DQNAT. On the other hand, a potential glycosylation contradicts the lectin blot result which suggest only one glycosylated version. However, lectin blot may not be sensitive or the site may not be accessible for the antibodies.
Figure 15: Putative N-linked glycosylation analysis results performed by GlycoPP software.
38
It has been also reported that due to its relaxed specificity, pglB is also able to transfer O7- antigens. Feldman et al., showed that pgl pathway, when transferred to
E.coli, glysoylates AcrA proteins in both O-linked and N-linked manner.
Furthermore, both glycosylation types were transferred on the the same recognition motif, the N-linked glycosylation tag.[25] Therefore, O-linked glycosylation may contribute to the third band, given that excess pglB is present which will facilitate the non-canonical glycosylation pathways. When O-linked glycosylation putative site analysis were performed using GlycoPP, there were 14 putative sites found.
Therefore, it can be concluded that ALP-DQNAT can also carry O7 antigens natively produced in E.coli. Construction of mutated putative sites will be helpful to
understand the causative of the third band to elaborate further.
After assessing the glycosylation rate from whole-cell proteins, proteins were
purified utilizing His-tag affinity. Purified proteins were analyzed in SDS-PAGE for purity, and Western and Lectin Blot to compare with whole-cell results.
39
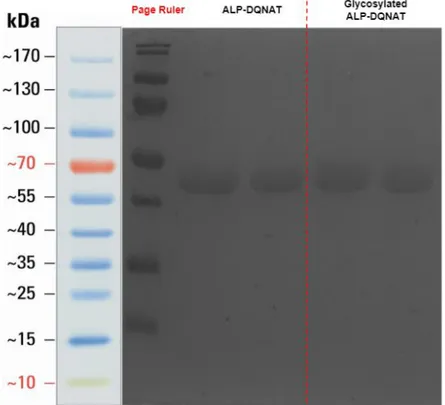
Figure 16: SDS-PAGE result of the purified ALP-DQNAT and Glycosylated ALP-DQNAT
SDS-PAGE analysis showed that proteins were purified without any significant purity. Since ALP-DQNAT is overexpressed, the band separation was not possible.
40
Figure 17:Western Blot result of ALP-DQNAT and Glycosylated ALP-DQNAT According to western blot results, the miscellaneous band was eliminated during the purification step which simplifies the analysis of the protein characteristics.
Figure 18: Lectin Blot results of purified DQNAT and Glycosylated ALP-DQNAT
Lectin blot results for the purified enzymes confirm the western blot results, suggesting that there is only one glycosylated state. The glycosylation rate is
41
calculated to be approximately 55% from the western blot and experiments were performed using the same batch with 55% glycosylation rate.
3.5. Enzyme Activity Comparison of Nonglycosylated and
Glycosylated ALP
After achieving high glycosylation rate and observing successful expression of each ALP variants, the next step is to assess the enzymatic behaviors of non-glycosylated and glycosylated ALP. Para-Nitrophenylphosphate (pNPP) is the substrate of alkaline phosphatase enzyme. pNPP is cleaved into two parts: orthophosphate and NPP which is a yellow-colored product. The alkaline phosphatase activity can be assessed by the rate of the color change in a transparent medium.[36]
To compare two enzymes catalyzing the same substrates, using enzyme
concentrations is useful. Therefore, enzymes were diluted to 2 ug/mL and incubated with different substrate concentrations, 0 µM, 1000 µM, 2000 µM, 3000 µM, 4000 µM and 5000 µM. Michealis - Menten analysis was performed to investigate the differences between two constructs.
42
Figure 19: Comparison of ALP and Glycosylated ALP. Glycosylated ALP obtained higher catalysis activity.
Table 15: The enzyme behaviours calculated for ALP-DQNAT and Glycosylated ALP-DQNAT from enzyme activity assays.
ALP-DQNAT Glycosylated
ALP-DQNAT
ν
max 1.376 2.08843
Figure 20: Normalized enzyme activities of DQNAT and Glycosylated ALP-DQNAT at optimal conditions.
When enzyme activities are compared, glycosylated ALP-DQNAT functions significantly better, almost 2 times faster than the native enzyme. Michealis – Menten analysis cleared it out that
ν
max has significantly increased from 1.376 to2.088, when the ALP is glycosylated. This means that glycosylation at C-terminus provided ALP better catalyzing properties. On the other hand, enzyme’s affinity to its substrate has decreased, upon glycosylation.
In order to have a better understanding of the changes in enzymatic activity, secondary structure analysis has been performed. Circular Dichriosm (CD) is a widely utilized method to study secondary structure of the protein of interest.. the technique is based on the measurements taken of different absorption values between the lef and right circularyly polarized light. According to peptide bond conformation of the peptide bonds and their H-bonding pattern which are the features of the secondary structure, proteins yield different spectral profiles. Most proteins give a
44
differential spectra between 170 nm and 250 nm. Therefore, analyzing the spectra between this range will give valuable information about the secondary structure of the protein analyzed. [37]
Figure 21: Secondary structure analysis performed to assess the differences between non-glycosylated and glycosylated ALP and predicted secondary structures.
According to the secondary structure analysis, there is a decrease in total helical structure of ALP-DQNAT upon glycosylation. This decrease is compensated by the
45
increase in parallel structure. These differences may play a significant role in the difference observed in the enzymatic activity.
3.5.1. Enzyme Activity and Secondary Structure Assessment
at Elevated Temperatures
To test and the compare the stability of non-glycosylated and glycosylated ALP, the enzymes were subjected to varying elevated temperatures (55℃, 75℃, 95℃) for varying incubation times (15 min, 30 min, 60 min, 120 min). Enzyme activities are normalized, including the control groups (optimal conditions) in Figure 13.
Figure 22: ALP-DQNAT and Glycosylated ALP-DQNAT are treated with varying temperatures.
Treatment to different temperatures indicated that glycosylated ALP-DQNAT showed enhanced enzyme activity, when a comparison is made. At 55℃, Both groups activities were deviated from the control groups for all treatment times. However, while ALP-DQNAT activity dropped from 0.59 to 0.17 which
46
corresponds to 3.4 times decrease, glycosylated ALP-DQNAT activity dropped from 0.93 to 0.51 which corresponds to 1.8 times decrease. At 75℃, glycosylated ALP-DQNAT activity is retained for all treatment times, whereas, ALP-ALP-DQNAT activities are dropped, as the treatment time increases. The difference between 15 min
treatment and 120 min treatment was 3 fold. However, the same does not apply to glycosylated ALP-DQNAT which does not show a significant difference. At 95℃, even at 30 minutes, ALP-DQNAT activity is almost ceased, 90% less active
compared the control group. Glycosylated ALP-DQNAT works at half of its activity and approximately the same with the native enzyme at optimal conditions. After 30 minutes of treatment, both enzymes did not exhibit meaningful enzyme activities. From this point, it can be suggested that glycosylation significantly improved the stability of ALP enzyme.
47
Figure 23: Enzyme Kinetics of ALP-DQNAT and Glycosylated ALP-DQNAT at 55℃ for different treatment times.
48
Figure 24: Enzyme Kinetics of ALP-DQNAT and Glycosylated ALP-DQNAT at 75℃ for different treatment times.
49
Figure 25: Enzyme Kinetics of ALP-DQNAT and Glycosylated ALP-DQNAT at 95℃ for different treatment times.
50
In order to have a clearer understanding of these differences, secondary sructure analysis has been performed.
Figure 26: CD spectra of ALP-DQNAT and Glycosylated ALP-DQNAT at elevated temperatures.
51
Figure 27: Secondary structure anaylsis of DQNAT and Glycosylated ALP-DQNAT at elevated temperatures.
CD spectra of ALP-DQNAT displayed a minimum between 205 nm and 225 nm and maximum at 195 nm. The only significant difference between experiment groups is between 190 nm and 200 nm. The signal obtaine from this interval is associated with helical secondary structures.
When the secondary structure prediction data is taken into consideration, ALP-DQNAT did not show a significant difference in secondary structure, as the temperature increases. Glycosylated ALP-DQNAT has a different pattern for all treatments, compared to ALP-DQNAT. As the temperature is elevated.parallel structure abundance fluctuates. An increase is seen at 55℃, and completely disappears at 75℃ and increases again at 95℃. Furthermore, when a comparison