Akademik Hassasiyetler Cilt:5 Sayı:10 The Academic Elegance Makale Gönderim Tarihi: 0 /12/2018 - Makale Kabul Tarihi: 28/12/2018
IS THE CURRENT ACCOUNT SURPLUS IN GULF ECONOMIES SUSTAINABLE? AN EMPIRICAL ANALYSIS FOR UNIT ROOT TEST WITH
TWO STRUCTURAL BREAKS
Gülgün ÇİĞDEM*
Abstract
As the current deficit damages the economy more than the current account surplus, researchers generally concentrate on the current account deficit and its sustainability. The current account deficit of the USA, which is the the highest deficit in the world, matches with the current account surpluses of Germany, China, Japan and oil-exporting countries. The exhaustibility oil resources, the emergence of renewable energy sources so as to take place of oil, the slowdown in the global growth led by China and India, and the decrease in oil revenues with the increase in the oil supply in other countries, generate anxiety in the economies of the Gulf Countries. In this point, the examination of the sustainability of the current account surplus also gains importance. In this respect, this study, testing the sustainability of the current account balance of the Gulf Economies, having current account surplus and being in the position of oil exporters, is a valuable contribution to the literature. This paper analyses sustainability of the current account surplus of Gulf Economies between 1980 and 2016 by utilising the minimum LM unit root test for stationary. As for the outcomes, the unit root null hypothesis could be rejected, it is a constant process in Bahrain, Iran, Kuwait and United Arab Emirates. The results obtained are also important for the policymakers.
Keywords: Current Account Balance, Current Account Surplus, Sustainability, Lee-Strazicich KÖRFEZ EKONOMİLERİNDE CARİ İŞLEMLER FAZLASI
SÜRDÜRÜLEBİLİR Mİ? İKİ KIRILMALI BİRİM KÖK ANALİZİ İLE AMPİRİK BİR ÇALIŞMA
Öz
Cari aç k, cari fazladan daha fazla zarar verdi i için, ara t rmalar aç k ve sürdürülebilirli i üzerinde yo unla maktad r. En çok aç k veren ABD’nin cari aç , Almanya, Çin, Japonya ve petrol ihracatç s ülkelerin fazlalar ile e le mektedir. Petrol gelirlerindeki azalma, Körfez Ülkeleri’nin ekonomilerinde s k nt ya yol açmaktad r. te bu noktada, cari i lem fazlas n n sürdürülebilirli inin de incelenmesi önem kazanmaktad r. Bu aç dan bu çal ma, literatüre bir katk niteli indedir. Çal man n amac , 1980-2016 döneminde Körfez ekonomilerinin cari hesap fazlas n n, dura an minimum LM birim kök testi kullan larak sürdürülebilirli ini ara t rmaktad r. Sonuçlara göre birim kök bo hipotezi reddedilebilir, Bahreyn, ran, Kuveyt ve Birle ik Arap Emirlikleri'nde dura an bir süreç sözkonusudur. Sonuçlar politika yap c lar için önemlidir.
Anahtar Kelimeler: Cari lemler Dengesi, Cari lemler Fazlas , Sürdürülebilirlik,
Introduction
Petroleum, is an important energy raw material that is formed with the word “petra” that
means stone and “oleum” that means oil in Latin (Petra oleum-the oil from the rocks)
(Kosinowski, 2002). It takes the first place of the basic inputs crucial for the economic growth
and advancement of the nations and it constitutes the one third of the worldwide energy
utilization. According to the projections of the International Energy Agency (IEA), although
the worldwide energy demand relatively declines, it is going to show an increase of %30 until
2040 and China’s and India’s contribution to this increase is going to be high and Africa,
Middle East, South Asia and Central & South America are going to follow this (IEA, 2017).
Already the global oil consumption is over the decade average (1.2%) with 1.6% increase of
1.6 million barrels per day. The most important share in this increase belongs to China with
400,000 barrels and India with 330,000 barrels per day, as of 2017 (BP, 2017b). According to
2018 data; “Global oil consumption growth averaged 1.8%, or 1.7 million barrels per day
(b/d), above its 10-year average of 1.2% for the third consecutive year. China (500,000 b/d)
and the US (190,000 b/d) were the single largest contributors to growth” (BP, 2018).
There is a close relationship between oil prices and the economic activity of
countries. An increase in oil prices causes an increase in the general level of prices, and
as a result of this, an inflationary process begins with the decrease in the aggregate
demand. The negative effect occurred at the income of the households and the decrease
of the real balance level brings the recession effects with it. The increase in the oil prices
increases the costs and this causes a decrease in the production. Any change occurred in
the oil prices also effects the consuming and the investment decisions. And the income
transfer between the countries and the deterioration at the level of welfare occur (Husain
vd, 2015:8; Schneider, 2004: 27).
The Gulf countries have an important share in the global production of the oil, which
has a vital value. This group is named as Gulf countries as they take place near the Persian
Gulf shore, consisting of Bahrain, Iran, Iraq, Kuwait, Oman, Qatar, Saudi Arabia and United
Arab Emirates. Oil is the most important sector of the economy of the countries in the Gulf
economies, which have quite rich fields in regard to oil and natural gas. Oil, having the most
usage area and being important for the economic growth, constitutes the 32,9% of the global
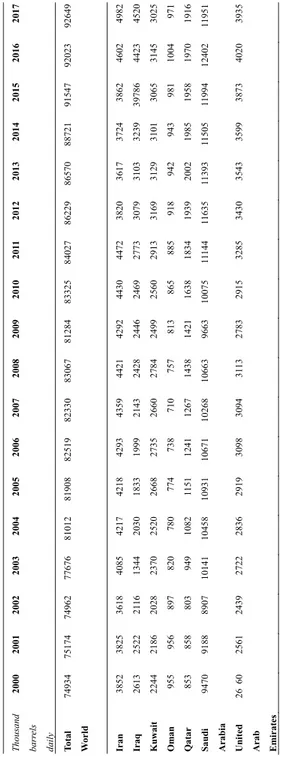
energy demand. As of 2016, the world oil production was 92.15 million barrel per day, the
daily production in the Gulf economies is 31,5 million barrels and this constitutes the 34% of
the global production (Table 1) (BP, 2016). As of 2018, “Global oil production rose by 0.6
million b/d, below average for the second consecutive year. US (690,000 b/d) and Libya
(440,000 b/d) posted the largest increases in output, while Saudi Arabia (-450,000 b/d) and
Venezuela (-280,000 b/d) saw the largest declines” (BP, 2018).
At the end of 2017, the world oil reserve is 1,69 trillion barrels. Saudi Arabia keeps the
15,7% of the world oil reserve with 266.2 million barrels. Iran, Iraq, United Arab Emirates,
Qatar, and Oman keep respectively; 9.3%, 8.8%, 5.8%, 1.5%, and 0.3% with again
respectively; 157.2 million barrels, 148.8 million barrels, 97.8 million barrels, 25.2 million
barrels and 5.4 million barrels and these also constitute the 41.4% of the world reserve in total
(BP, 2018).
Figur
e 1
:
C
rude
Oil
Price
Changes
(1861-2017)
Source. Bp.
Table 1:
Oil Production
Th ous and ba rr els da il y 20 00 20 01 20 02 20 03 20 04 20 05 20 06 20 07 20 08 20 09 20 10 20 11 20 12 20 13 20 14 20 15 20 16 20 17 To ta l Wo rl d 74 934 75 174 74 962 77 676 81 012 81 908 82 519 82 330 83 067 81 284 83 325 84 027 86 229 86 570 88 721 91 547 92 023 92 649 Ira n 38 52 38 25 36 18 40 85 42 17 42 18 42 93 43 59 44 21 42 92 44 30 44 72 38 20 36 17 37 24 38 62 46 02 49 82 Ira q 26 13 25 22 21 16 13 44 20 30 18 33 19 99 21 43 24 28 24 46 24 69 27 73 30 79 31 03 32 39 39 786 44 23 45 20 Ku wai t 22 44 21 86 20 28 23 70 25 20 26 68 27 35 26 60 27 84 24 99 25 60 29 13 31 69 31 29 31 01 30 65 31 45 30 25 Om an 95 5 95 6 89 7 82 0 78 0 77 4 73 8 71 0 75 7 81 3 86 5 88 5 91 8 94 2 94 3 98 1 10 04 97 1 Qat ar 85 3 85 8 80 3 94 9 10 82 115 1 12 41 12 67 14 38 14 21 16 38 18 34 19 39 20 02 19 85 19 58 19 70 19 16 Saud i Ara b ia 94 70 91 88 89 07 10 141 10 458 10 931 10 671 10 268 10 663 96 63 10 075 11 14 4 116 35 113 93 115 05 119 94 12 402 119 51 U n ite d Ara b Em irates 26 60 25 61 24 39 27 22 28 36 29 19 30 98 30 94 31 13 27 83 29 15 32 85 34 30 35 43 35 99 38 73 40 20 39 35Source.Bp.
There has been a contraction in the oil demand. However, as a result of the decline in oil prices (Figure 1) occurred with the increase in the oil supply more than the demand growth, the Gulf economies faced a macro-economic imbalance. While the oil price was taking place above the 100.-USD/b level because of the small-scale political tensions causing anxiety, the risks were removed significantly from the beginning of 2014 with the effect of the political, economic and sectorial developments. Furthermore, 70% reduction in value occurred due to the fact that the oil price was 113 USD/b in 2014 but declined to 35 USD/b by the end of 2015. The USA, which imports the oil at most, has reduced the importation number by increasing the production.
The demand has also decreased as a result of the cost paid for the oil increased due to the American Dollar gaining value against the currency of the Euro and the Developing Countries. Also the low growth rates in Asia (especially in China) have brought the global demand decrease to oil in 2015 (Türkiye Petrolleri, 2016, May). Due to the growth in China in 2015-2016 was at the lowest level since 1997-98, the energy consumption has only increased by 1.3%. In spite of that, China saves its place as the biggest growing market in the world for 16 years (BP, 2017).
In addition to all these, putting into practice of the policies that promote the renewable energy resources and paying regard to the energy efficiency, especially in the Developed Countries, and the natural gas becoming cheap with the shale revolution, bring the dependency decrease to the oil. While the oil’s share was 50% at the primary energy supply in the 1970’s, it recedes to the levels of 30% in recent years. All these experiences constituted a downward pressure at the oil price. In consequence of the sanctions applied to Iran were being removed in January 2016, the oil price has decreased to 26 USD/b, which was the lowest level in the last 12 years (Türkiye Petrolleri, 2016, May). This decrease seen in the prices also affects the government’s revenue, public spending, current account balance and international reserves (Guastella& Menghi, 2016, Dec.).
“In the wake of falling oil prices, countries such as Saudi Arabia, Oman, Bahrain, the UAE, Kuwait, and Qatar, whose economies rely heavily on exporting oil, often suffered greater losses. These countries have been so heavily impacted by a decrease in oil prices since 2008 reinforces. the GCC nations historically have had slower economic growth than other developing nations due to, in large part to their economy being concentrated in one commodity, which often leads to volatility in their government revenues” (Vohra, 2017:12).
“Countries with oil, mineral or other natural resource wealth, on average, have failed to show better economic performance than those without, often because of undesirable side effects. This is the phenomenon known as the Natural Resource Curse. The so-called natural resource curse literature has focused specifically on the effects of natural resource endowments on the economic performance of natural resource–rich countries. Oil, minerals, and agricultural resources can bring great riches to those who possess them. Yet countries that are abundantly endowed with such natural resources often encounter pitfalls that interfere with the expected superior economic performance” (Frankel, 2012:1-2, 8). “It is also vital to build other types of capital to complement natural resource wealth. These include human capital and institutional, or governance, capital. Countries with a major shortfall in these assets are more likely to suffer from a “resource curse” (Gelb, 2012:20). “Diversified economies tend to perform better over the long term” (Gelb, 2011). “Resource-rich countries are however facing challenges that hinder their ability to diversify difficult” (Arezki and Nalbi, 2012:11).
176
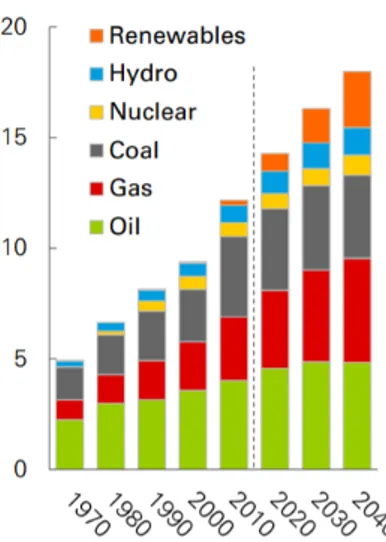
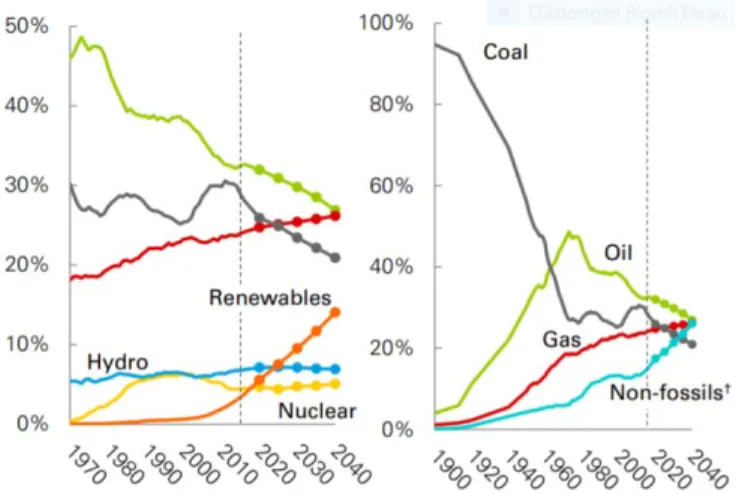
The economic growth means more energy usage. But the extent of the increase is de-escalated with the decreases in the energy density (GDP energy used per unit). Considering the performed projections, it is predicted that the global GDP is going to reduplicate, but only 30% increase at the energy demand is going to happen (Figure 2). Considering the graded transition in the energy resources, it is expected that the nuclear, hydroelectric powers and renewable resources are going to constitute the half of the growth in the energy supplies during the following twenty years. Besides this, it is within the expectations that the oil, gas and coal are going to keep on being the main energy sources, which sustain the worldwide economy that constitutes more than three fourths of the total energy resources in 2035. It is expected that the oil, which is the major income source of the Gulf Countries, is going to continue its increase but the growth rate is going to decrease gradually (Figure 3).
1. CURRENT ACCOUNT BALANCE, ITS IMPORTANCE, ITS SUSTAINABILITY AND CURRENT ACCOUNT BALANCE IN GULF ECONOMIES
The currenct account balance is a crucial signal that shows the health of the economy. Any situation of imbalance occurred as a deficit or surplus is accepted to be a reflection of an underlying problem. The current account balance is also important as it contains information about crises that are not experienced yet (Zanghieri, 2004; Edson 2003).
The current accounts are the differences between savings and investments (Obstfeld, 2012; Obstfeld and Rogoff, 1995, 1996, Sachs, 1981) or differences between exports and imports of goods and services, and the current accounts also have an important role as a constituent of the aggregate demand (Obstfeld, 2012). The current account imbalances generally reflect the domestic distortions and fixing these distortions is for the benefit of the economy (Blanchard, Ferretti, 2011).
According to Banchard, Ferretti (2011); the current deficits can occur with the bad reasons due to financial arrangement failures resulting with the credit explosion and the wrong behaviors of the financial authorities that decrease the national savings, as well as due to the good reasons like the low exportation prices and the hope of promising economic future that cause the decrease of the savings or the high marginal product of the capital that causes the increase of the investments. On any ground, the existence of a permanent current account deficit has a tendency to increase the current rate of the interest and in addition, it brings an overload that reduces the next generation’s life standards to pay the deficit (Apergis et al., 2000).
Figure 2. Primary Energy Consumption by Fuel *Renewables includes wind, solar, geothermal, biomass, and biofuels Source. BP Energy Outlook, 2018.
The large scaled external imbalances occurred with following the high and unsustainable current account deficit can be a precursor of an economic crisis and because of this reason the current deficit/GDP ratio should be followed carefully.
Another current account imbalance is the current surplus and this occurs with the distortions like lack of social insurance, which causes the increase of the private savings, and the insufficient financial intermediation, which causes the decrease of the investments. These distortions affect the exchange rate. The distortions also reveal themselves in an international level like insufficient global liquidity and high reserve accumulation.
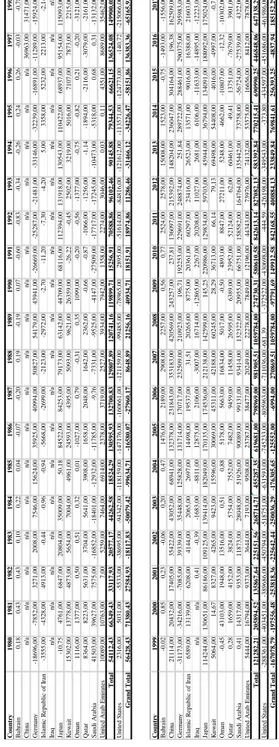
The world’s current account balance total is equivalent to zero; a surplus formed in the current account balance in an economy is equal to the other’s current account deficit. The current account deficit of America, which is the highest deficit in the world, matches with the current account surplus of China, Germany and Japan, which have the highest surplus, and with the countries that have the position of the oil importers (Table.2).
Another fact that has started to be discussed lately and even more important than the current account deficit is the sustainability of the deficit. The sustainability of the current accounts is an important subject that occupies the macro-economic agenda (Husted, Bahmani-Oskooee, Gould and Ruffin, Fountas and Wu, Arize, Mann, Baharumshah et al., Christopoulos and Leon-Ledesma et al. respectively;1993; 1994; 1996; 1999; 2002; 2002; 2003; 2010).
The sustainability of the current account deficit has the meaning for the sustainability of the external borrowing. Although the current account deficit and its sustainability is the subject that is mostly concentrated on, the examination of the sustainability of the surplus is also important.
Changes in the current accounts are also related with the changes in the global interest rates. These kinds of changes are also effective on the terms of trade and the rates. According to Obstfeld (2012); the large current account surplus in the developing country economies like China, drags the interest rates down. In his empirical study, Edwards (2004) reached the conclusion that although the current deficit is not generally permanent, the current account surplus can be permanent in some countries. It can destabilize through the macro-economic variables like the current account deficit, growth, exchange rate and unemployment.
Figure 3.
S
hares of Primary Energy
Source.BP Energy Outlook, 2018.Table 2:
Current
Accou
nt
Balances
for
selected
co
un
tr
ie
s (
U
.S
. d
ol
la
rs
b
il
li
on
s)
(
19
80
-2
01
6)
Data:
IMF.
Cou nt ry 1980 1981 1982 1983 1984 1985 1986 1987 198 8 1989 1990 1991 1992 199 3 199 4 19 95 1996 1997 1998 Ba hr ai n 0, 18 0, 43 0, 43 0, 10 0, 22 0, 04 -0, 07 -0, 20 0, 19 -0, 19 0, 07 -0, 60 -0, 83 -0, 34 -0, 26 0, 24 0, 26 -0, 03 -0, 78 C hin a n/ a n/ a n/ a n/ a n/a n/ a n/a n/ a n/ a n/ a n/a n/ a n/ a n/ a n/a n/ a n/a 36963, 00 31471, 00 Ge rm an y -18696, 00 -7852, 00 3271, 00 2008, 00 7546, 00 156 24, 00 35925, 00 4099 4, 00 508 27, 00 54179 ,0 0 43941, 00 -26669, 00 -25287, 00 -21481, 00 -33146, 00 -32239, 00 -16891, 00 -11289, 00 -15924, 00 Is la m ic R ep ubl ic of Ir an -3555, 00 -4328, 00 4913, 00 -0 ,4 4 -0, 96 -0, 94 -566 8, 00 -2699, 00 -2123, 00 -2972, 00 -2 ,7 0 -11, 20 -7 ,3 0 -4, 20 5, 00 3358, 00 5232, 00 2213, 00 -2, 14 Ir aq n/ a n/ a n/ a n/ a n/ a n/ a n/ a n/ a n/ a n/ a n/ a n/ a n/ a n/ a n/ a n/ a n/ a n/ a n/ a Ja pa n -10, 75 4761, 00 6847, 00 20804, 00 35009, 00 50, 18 84522, 00 84253, 00 79173, 00 63142, 00 44709, 00 68116, 00 112394, 00 131 918, 00 130543, 00 110422 ,00 68937, 00 95154, 00 115093, 00 K uw ait 15302, 00 13778, 00 4873, 00 5654, 00 7004, 00 496 1, 00 24593, 00 4395, 00 5093, 00 9621, 00 26359, 00 -26, 22 -0, 45 2502, 00 3219, 00 5016 ,00 7107, 00 7873, 00 2215, 00 Om an 1116, 00 1377, 00 0, 50 0, 51 0, 32 0, 01 -1027, 00 0, 79 -0, 31 0, 35 1099, 00 -0, 20 -0, 56 -1377, 00 -0, 75 -0, 82 0, 21 -0, 20 -3121, 00 Qa ta r 8364, 00 8223, 00 5631, 00 3704, 00 5641, 00 390 8, 00 1658, 00 2048, 00 1642, 00 2362, 00 -0, 66 -0, 87 -1066, 00 -1256, 00 -1, 14 -1894, 00 -2116, 00 -3079, 00 -2161, 00 Sa udi Ar abi a 41503, 00 39627, 00 7575, 00 -16852, 00 -18401, 00 -12932 ,00 -11 785 ,0 0 -9, 76 -7331, 00 -9525, 00 -4147, 00 -27509, 00 -17717, 00 -1 7245, 00 -10473, 00 -5318, 00 0, 68 0, 31 -13132, 00 U nit ed A ra b E m ir at es 10089, 00 10763, 00 7, 00 5259, 00 7464, 00 691 4, 00 2378, 00 3719, 00 2527, 00 3934, 00 7942, 00 1358, 00 2274, 00 3046, 00 0, 03 0, 11 43 51, 00 8689, 00 35462, 00 T ot al 54112, 43 66349, 43 331 17, 93 20577, 17 44262, 58 18524, 29 130595, 93 13270 0, 83 129807, 89 120741, 16 119899, 71 15256, 91 70588, 86 96102, 46 90145 ,88 79344, 53 66621, 15 136524, 08 149900, 08 U nit ed St at es 2316, 00 5031, 00 -5533, 00 -38695, 00 -94342, 00 -11815 9, 00 -1 471 76, 00 -160661, 00 -121159, 00 -99485, 00 -78965, 00 2895, 00 -51614 ,00 -84816, 00 -121612, 00 -113571, 00 -124773, 00 -140, 72 -215 066 ,00 G ran d T ot al 56428, 43 71380, 43 275 84, 93 -18117, 83 -50079, 42 -9 9634, 71 -16580, 07 -27 960 ,1 7 86 48 ,89 21 256, 16 40934 ,7 1 18151, 91 18974, 86 11286, 46 -31466, 12 -34226, 47 -58151, 86 136383, 36 -65165, 92 Cou nt ry 1999 2000 2001 2002 2003 2004 2005 2006 2007 2008 2009 2010 2011 2012 2013 2014 2015 2016 2017 Ba hr ai n -0 ,0 2 0, 85 0, 23 -0 ,0 6 0, 20 0, 47 14 76 ,0 0 21 89 ,0 0 29 08 ,0 0 22 57 ,0 0 0, 56 0, 77 25 24 ,0 0 25 78 ,0 0 15 00 8, 00 15 23 ,0 0 -0 ,7 5 -1 49 3, 00 -1 55 6, 00 Ch in a 21114, 00 2043 2, 00 174 05, 00 354 22, 00 43 052, 00 68941, 00 132378, 00 231843, 00 353183, 00 420569, 00 243257, 00 237, 81 136097, 00 2153 92, 00 14820 4, 00 236047, 00 30 4164, 00 196, 38 16 2509, 00 Ge rm an y -3 11 73 ,0 0 -3 42 16 ,0 0 -7 08 5, 00 39 33 9, 00 35 44 8, 00 12 58 28 ,0 0 13 17 14 ,0 0 17 07 17 ,0 0 23 25 09 ,0 0 21 09 23 ,0 0 19 6, 71 19 22 53 ,0 0 22 96 91 ,0 0 24 88 74 ,0 0 25 1, 84 28 97 22 ,0 0 28 84 61 ,0 0 29 03 75 ,0 0 29 59 83 ,0 0 Is la m ic R ep ub lic o f Ir an 65 89 ,0 0 13 13 9, 00 62 08 ,0 0 41 44 ,0 0 20 65 ,0 0 26 97 ,0 0 14 49 8, 00 19 53 7, 00 31 ,5 1 20 26 5, 00 87 75 ,0 0 20 36 1, 00 60 29 7, 00 23 41 6, 00 26523, 00 13571, 00 9016, 00 16388, 00 21603, 00 Ir aq n/ a n/ a 0, 41 -0 ,3 9 -1 68 3, 00 -8 81 1, 00 12 87 5, 00 21 06 ,0 0 -3 00 7, 00 16 71 4, 00 -1 28 65 ,0 0 22 67 ,0 0 20 20 8, 00 11 02 7, 00 26 81 ,0 0 61 06 ,0 0 -1 16 33 ,0 0 -1 48 95 ,0 0 -1 22 23 ,0 0 Ja pa n 114244, 00 130651 ,00 861 86, 00 1091 25, 00 139 414, 00 182049, 00 170135, 00 174536, 00 212138, 00 142599, 00 145, 25 220986, 00 129834, 00 597 03, 00 45944, 00 36794, 00 13 4091, 00 188092, 00 17 5024, 00 Ku w ai t 5064 ,00 14, 67 832 7, 00 42 65, 00 9423, 00 15596, 00 30069, 00 45311, 00 42188, 00 60245, 00 28, 29 36713, 00 66, 14 79, 13 69498, 00 54408, 00 4016, 00 -4 997, 00 -0, 71 Om an -0 ,4 5 43 10 3, 00 19 48 ,0 0 13 51 6, 00 0, 51 0, 88 51 78 ,0 0 56 63 ,0 0 16 83 4, 00 50 17 ,0 0 -0 ,5 0 48 93 ,0 0 88 47 ,0 0 27 21 1, 00 52 48 ,0 0 46 62 ,0 0 -1 08 07 ,0 0 -1 2, 32 -1 03 02 ,0 0 Qa ta r 0, 28 16 59 ,0 0 41 52 ,0 0 382 4, 00 57 54 ,0 0 75 52 ,0 0 74 82 ,0 0 94 59 ,0 0 11 45 8, 00 26 59 5, 00 63 89 ,0 0 23 95 2, 00 52 12 4, 00 62 ,0 0 60 46 1, 00 49 ,4 1 13 75 1, 00 -7 67 9, 00 39 01 ,0 0 Sa ud i A ra bi a 0, 41 14 317 ,0 0 93 53 ,0 0 11 87 3, 00 280 48 ,0 0 51 92 6, 00 90 08 9, 00 99 13 1, 00 93 41 4, 00 13 23 22 ,0 0 20 95 5, 00 66 75 1, 00 15 85 82 ,0 0 16 476 4, 00 13 54 42, 00 73758, 00 -56 724, 00 -27539, 00 4322, 00 Un ite d A ra b E m ir at es 54 44 ,0 0 16 79 4, 00 93 73 ,0 0 36 44 ,0 0 71 93 ,0 0 95 08 ,0 0 23 78 7, 00 38 47 7, 00 20 24 9, 00 22 27 8, 00 78 49 ,0 0 12 19 6, 00 44 34 3, 00 73 97 6, 00 74132, 00 53575, 00 16656, 00 8412, 00 7878, 00 To ta l 12 12 82 ,2 1 20 58 94 ,5 2 13 58 67 ,6 4 22 51 51 ,5 6 26 87 14 ,7 1 45 52 87 ,3 5 61 96 81 ,0 0 79 89 69 ,0 0 98 19 05 ,5 1 10 59 78 4, 00 27 47 30 ,3 1 58 06 10 ,5 8 84 26 13 ,1 4 82 70 82 ,1 3 58 33 92 ,8 4 77 02 15 ,4 1 69 09 90 ,2 5 44 68 48 ,0 6 64 71 38 ,2 9 Un ite d St at es -2 88 36 1, 00 -4 03 45 1, 00 -3 89 68 6, 00 -4 50 79 4, 00 -5 18 75 1, 00 -6 31 59 3, 00 -7 45 23 3, 00 -8 05 96 3, 00 -7 11 03 6, 00 -6 81 .3 9 -3 72 52 2, 00 -4 30 69 8,0 0 -4 44 ,5 9 -4 26 19 8, 00 -3 49 54 3,0 0 -3 73 ,8 0 -4 34 59 7, 00 -4 51 68 6,0 0 -4 61 98 6, 00 Gr an d T ot al -16707 8, 79 -1975 56, 48 -253 818, 36 -225 642, 44 -25 0036, 29 -176305, 65 -125552, 00 -6994, 00 270869 ,51 1059784, 00 -97791, 69 149912, 58 842168, 55 40 0884, 13 233849, 84 769841, 61 256393, 25 -4837, 94 185152, 292.MACRO-ECONOMIC LOOK TO THE GULF ECONOMIES
In this section, the countries constituting the Gulf economies will be reviewed with regard to their basic macro-economic indicators. The table below shows the lowest and the highest grades of the current account balances of the Gulf Countries in the periods of 1980-2016 (Table 3).
Table 3: Current Account Balance in Gulf Countries (1980-2016)
Current Account Balance (%GDP)
Country Min. Max.
Bahrain -15.189 (1992) -13.381 (2008) Iran -14.932 (1992) 10.578 (2011) Iraq -24.047 (2004) 12.69 (2008) Kuwait -242.188 (1991) 45.460 (2012) Oman -22.295 (1998) 17.838 (1981) Qatar -27.250 (1997) 106.839 (1980) Saudi Arabia -20.833 (1991) 27.449 (2005)
United Arab Emirates 0.050% (1994) 25.942 (2000)
Data: IMF.
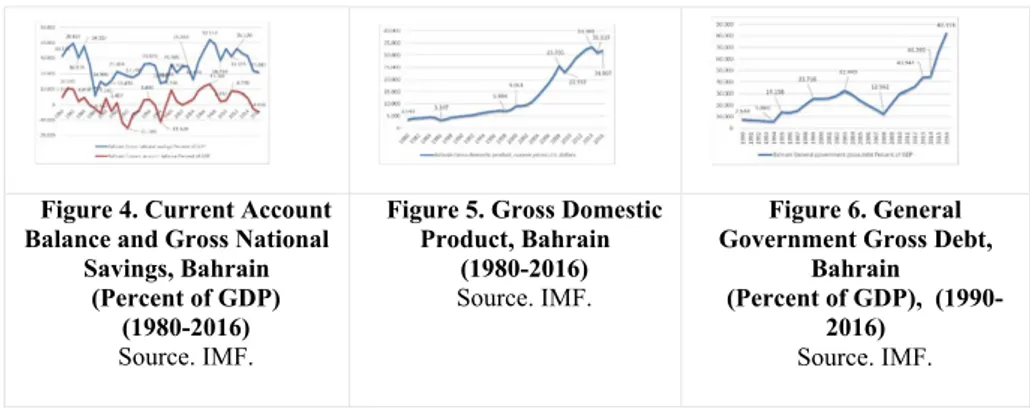
2.1. Bahrain
The national savings, which have seen the bottom level with 5.99% in 1986, reached to its highest level with 42.17% in 2007 and it is at the level of 21,02% as of 2016. The current account balance saw the level of -15,189% in 1992 and reached to its highest level with 13,381% in 2007 and also receded to the level of -4,686% in 2016 (Figure 4).
Gross domestic product went down to its lowest level as 3,347 billion USD in 1986 and reached to 33,38 billion USD in 2014 (Figure 5). It is seen that the General Government Gross Debt of the Bahrain, which takes place in the position of having the most current account surplus countries, reached to the level of 12.56% in 2008 and then to level of 82,11% in 2016. The General Government Gross Debt has seen the bottom level with 5.86% in 1994. The data before 1990 could not be reached (Figure 6).
Figure 4. Current Account Balance and Gross National
Savings, Bahrain (Percent of GDP)
(1980-2016)
Source. IMF.
Figure 5. Gross Domestic Product, Bahrain
(1980-2016)
Source. IMF.
Figure 6. General Government Gross Debt,
Bahrain (Percent of GDP),
(1990-2016)
Source. IMF.
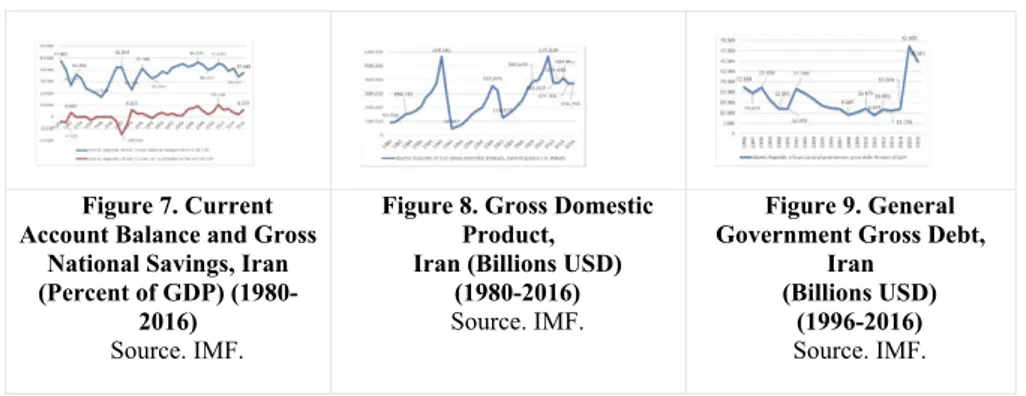
2.2. Iran
The national saving ratio, which saw the bottom level with 17.13% in 1988, reached to 46.51% in 2007 and as of 2016 it takes place as 37,58%. The current accounts balance, which had a deficit of 14.932% in 1992, and it has reached to its highest level with 10,57% in 2011 and it had surplus with 4,05% in 2016 (Figure 7). It is seems that the current account balance in Iran is identified by the political and the external factors like war, political agreements, 2006 nuclear plans, oil prices, economic and political embargos, rather than the economic internal factors like households,
Figure 7. Current Account Balance and Gross
National Savings, Iran (Percent of GDP)
(1980-2016)
Source. IMF.
Figure 8. Gross Domestic Product, Iran (Billions USD)
(1980-2016)
Source. IMF.
Figure 9. General Government Gross Debt,
Iran (Billions USD)
(1996-2016)
Source. IMF. The breaks at the GDP of Iran is remarkable, GDP in 1992 has entered the records by being the lowest with 48.88 billion USD and it has reached to the highest level in 2011 with 570,03 billion USD (Figure 8). The general government gross debt was the 8,875% of the GDP in 2011 and has reached the level of 11,7% in 2014 and then it has shown a sudden increase by reaching to the level of 42,28% in 2015. The data before 1996 could not be obtained (Figure 9).
2.3. Iraq
There is no data available before 2004 for Iraq and the breaks at the saving rates lived in 2004, 2007, 2009 and 2016 are remarkable. The saving rates were -1.947% in 2004 and sharp fluctuations were observed and it points the highest level with 34.79% in the year of 2008. Also similar fluctuations are seen at the current accounts balance; 2004, 2007, 2009 and 2016 breaks were observed and the current accounts balance, which had -24.047% deficit in 2004, has caught the peak number with the 12,69% current surplus in 2008 (Figure 10).
GDP, which was at the levels of 10,46 billion USD in 1998, has reached to 234,65 billion USD level in 2014 (Figure 11). The General Government Gross Debt (% of GDP) data before 2004 could not be obtained. This number, which was 342.66% in 2004, has decreased to 31.15% in 2013. It is 63,68% as of 2016 (Figure 12).
Figure 10. Current Account Balance and Gross National
Savings, Iraq (Percent of GDP)
(2004-2016)
Source. IMF.
Figure 11. Gross Domestic Product, Iraq (Billions USD)
(1998-2016)
Source. IMF.
Figure 12. Gross Domestic Product, Iraq
(Billions USD) (2004-2016)
Source. IMF.
2.4. Kuwait
It is seen at the Figure 13 that the national savings rate and the current account balance in Kuwait go parallel with each other. The decreases are seen at the each rate in 2002, 2009 and 2016. The national saving rate has reached its highest level of the period of 2000-2016 with 64,717% in 2006. As to the current accounts, the highest current account surplus number is seen in 2012 with 45,460%.
Figure 13. Current Account Balance and Gross
National Savings, Kuwait (Percent of GDP)
(1980-2016)
Source. IMF.
Figure 14. Gross Domestic Product, Kuwait
(Billions USD) (1980-2016)
Source. IMF.
Figure 15. General Government Gross Debt,
Kuwait (% of GDP) (1990-2016)
Source. IMF.
The Gross Domestic Product in Kuwait, which has reached the plateau for a while after the seeing the bottom level in 1991 with 10,82 billion USD and has started to increase in 2001, then it is seen that it receded to the level of 105,99 billion USD in 2009, has come to the highest level with 174,18 billion USD in 2013 and declined again (Figure 14). Kuwait’s General Government Gross Debt data before 1990 could not be reached. The General Government Gross Debt, which was 1.09% in 1990, has risen to the highest level with 203.36% in 1991 (Figure 15).
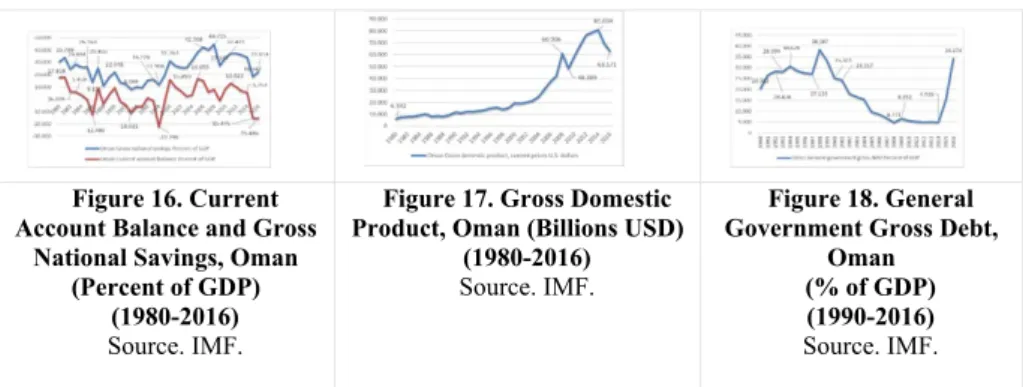
2.5. Oman
Its national saving rate has reached to the highest level with 44.71% in 2008. It is seen that the current accounts balance, which had a surplus with 16.65% in 2005, has turned to minus with the break lived in 2014 (Figure 16).
Figure 16. Current Account Balance and Gross
National Savings, Oman (Percent of GDP)
(1980-2016)
Source. IMF.
Figure 17. Gross Domestic Product, Oman (Billions USD)
(1980-2016)
Source. IMF.
Figure 18. General Government Gross Debt,
Oman (% of GDP) (1990-2016)
Source. IMF. The Gross Domestic Product, which was at the level of 6.34 billion USD in 1980 and started an increase trend in 1998, has lived a break by declining to 48.38 billion USD in 2009 and it has come to the highest level in 2014 with 81.03 billion USD (Figure 17). The General Government Gross Debt in Oman has reached to the 38.38% of the GDP in 1998 and this number has declined to 4.71% as for 2008 (Figure 18).
2.6. Qatar
The national savings in Qatar, which have seen the lowest level with 10.373% in 1993, have reached to the highest level of 64.189% in 2008. As for 2016, they have occurred as 43.99%. It is seen that the current accounts balance, which had a 106.836 surplus in 1980, has surplus with 33.18% in 2012 and then it has dropped down to minus. As of 2016, there is -4.92% current deficit in Qatar (Figure 19).
Figure 19. Current Account Balance and Gross
National Savings, Qatar (Percent of GDP)
(1980-2016)
Source. IMF.
Figure 20. Gross Domestic Product, Qatar (Billions
USD) (1980-2016)
Source. IMF.
Figure 21. General Government Gross Debt,
Qatar (% of GDP) (1990-2016)
Source. IMF. The Gross Domestic Product, which continues its rise since 1996, has reached to 206.22 billion USD in 2014 (Figure 20). It is seen that the General Government Gross Debt in Qatar has reached the highest level with 74.39% in 1999 and has decreased to the lowest level with 8.92% in 2007 (Figure 21).
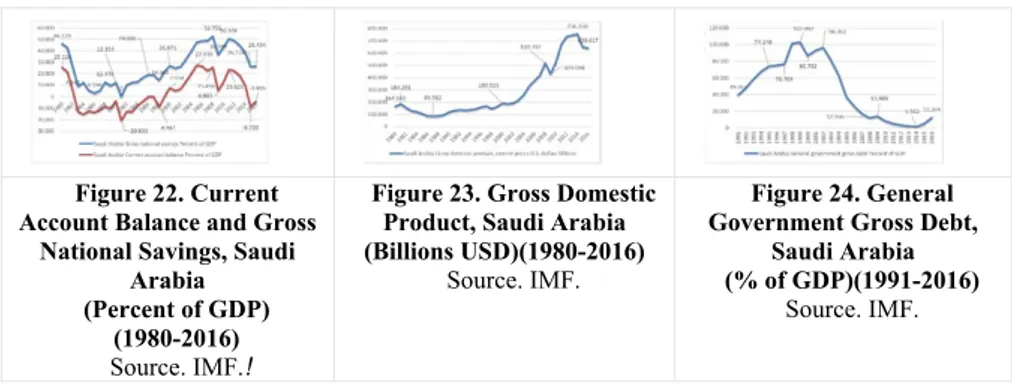
2.7. Saudi Arabia
The current accounts balance, which had a -20.833% deficit in 1991, has raised the period’s highest level with the surplus of 27.449% in 2005. As for the national savings, it has raised to 52.752% level in 2008 from its -0.847 level in 1991 (Figure 22).
Figure 22. Current Account Balance and Gross
National Savings, Saudi Arabia (Percent of GDP)
(1980-2016)
Source. IMF.!
Figure 23. Gross Domestic Product, Saudi Arabia (Billions USD)(1980-2016)
Source. IMF.
Figure 24. General Government Gross Debt,
Saudi Arabia (% of GDP)(1991-2016)
Source. IMF.
GDP, which has seen its bottom level with 85.58 billion USD in 1987, has reached to the peak with 756,35 billion USD in 2014 (Figure 23). It is seen that the General Government Gross Debt in Saudi Arabia has reached the highest level with 102.99% in 1999 and has also decreased to the lowest level with 1.56% in 2014 (Figure 24).
2.8. United Arab Emirates
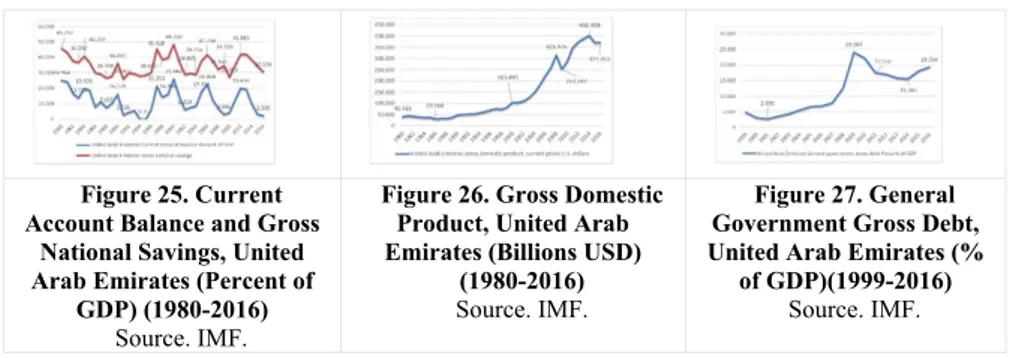
The national savings have seen the lowest level with 25.972% in 1991 and the highest level with 48.550% in 2000. As for the current accounts balance, it has seen the lowest with 0.05% in 1994 and the highest level with 25.942% in 2000 (Figure 25).
Figure 25. Current Account Balance and Gross
National Savings, United Arab Emirates (Percent of
GDP) (1980-2016)
Source. IMF.
Figure 26. Gross Domestic Product, United Arab Emirates (Billions USD)
(1980-2016)
Source. IMF.
Figure 27. General Government Gross Debt, United Arab Emirates (%
of GDP)(1999-2016)
Source. IMF. The GDP of the United Arab Emirates has seen its bottom level with 29,56 billion USD in 1986 and the highest level with 401,95 billion USD in 2014 (Figure 26). The General Government Gross Debt in Saudi Arabia is seen that it has seen the lowest level with 2.69% in 2001 and has risen up to the highest level with 24.08% in 2009 (Figure 27).
3. DATA
Data comparing CAD (current account deficit) to GDP (gross domestic product) were used to examine the Gulf economies' current balances making use of the IMF's database covering the term 1980 to 2016.
4. METHODOLOGY AND EMPIRICAL RESULTS
The Gulf economies' current balances are analyzed empirically in this section. 4.1. Unit Root Tests
The obligatory first footstep when making these analyses is to issue the variables to unit root tests. The ADF unit root test regresses as given below:
(1)
(2)
Using the estimates provided by these equalizations, the unit root of the variant is analyzed to see if it exists. Deterministic trend is represented by T in the first equalization. The model incorporates delayed difference terms so as to prevent auto-correction of the error term. The variable as the unit root of the alternate to the trend-stable alternate is the fundamental theorem that is being analyzed in Equalization (1), while in Equalization (2) the variable as the unit root of the alternate to the stationary alternate is the fundamental theorem that is being analyzed.
: = 0 : < 0
The fundamental hypothesis for the unit root cannot be dismissed if the estimation is zero. In the event that <0 either the mean-stationary or trend-stable theorem for the variable are admitted. The initial footstep taken in making the empirical analysis consisted of utilising the ADF and PP unit root testings to analyze the series’ order of integration. Table 4 shows the results after subjecting the CAD/GDP variables to these tests.
Both the ADF and PP test scores indicate that CAD/GDP is constant at the level for both models in Kuwait and Iraq, constant at the 1st level for both models in the UAE, Saudi Arabia, Bahrain, Qatar, and Oman. However, in Iran, CAD/GDP tested stationary at the level for ADF, but stationary at the 1st level for PP. A potential structural break was sought using the minimal LM unit root tests as proposed by Lee and Strazicich (2003).
(Perron, 1989). The Perron, Zivot-Andrews, Lumsdaine-Papell, Perron, Ng-Perron, Lee-Strazicich and Carrion-i-Silvestre et al. (respectively; 1989, 1992, 1997, 1997, 2001, 2003 and 2009) tests are the most commonly applied structural fracture unit root tests. These different forms of analysis look for different break aspects, such as external or internal breaks, single or multiple breaks etc. Of these tests, the most advanced in the Carrion-i-Silvestre et al. (2009) tests, by which the stability of the series can be tested by factoring in as many as five structural breaks.
Permitting an internally identified structural fracture to exist, the Lee-Strazicich unit root tests is an LM unit root tests built on two models: Model A (break) and Model C (trend) (Lee and Strazicich, 2004). This test was added to the literature by Lee and Strazicich and differs from the Lumsdaine-Papell and Zivot-Andrew tests in that it allows structural breakages to be analyzed according to both the fundamental hypothesis and the alternative one. The following equalization (3) is the Lee and Strazicich (2003) LM unit root tests having two constructive breakages:
= ' + , = + (3)
where is made up of deterministic terms and ~ iid N(0,
While both models (A and C) allow for two breakages on the surface, Model C caters for two breaks in the surface and trend. They are expressed thus: Model A: = [1, t, , ]'. In this case, while t is t +1 is equal to 1 and 0 in another conditions. The value is the breakage point. Model C: = [1, t, , , , ]'. Here, while t is t +1, is equals to t -or becomes equal to 0 in another conditions. This method includes the breakages under both null hypothesis ( =0) and the alternative hypothesis ( <1). In Model A (It is possible to develop a similar method for Model C), hypotheses are formulated with respect to the coefficient as follows:
: = + (4)
: = + (5)
In this case, and are constant error terms. If t = + 1, it will equal to 1 or 0 in another conditions, with the d value being displayed as d=( )'. The phrases are interpolated in the second equalization, and phrases are interpolated in the equalization (3) in Model C. Showing the null hypothesis, Equalization (2) includes dummy variables ( ).The subsequent equalization is used to determine the LM unit root tests statistic:
(6)
All the possible breaking points for the minimum t-statistic are elected to detect Structural break (TB) as follows:
= ( ) (7)
Table 4: The Results of Unit Root Tests
Variables Test Statistic Crucial (Critical) Values
%1 %5 %10
Bahrain ADF CAD, level -2.842304 -4.234972 -3.540328 -3.202445
CAD, 1st difference -6.355635 -4.243644 -3.544284 -3.204699 PP CAD/GDP, level -2.644192 -4.234972 -3.540328 -3.202445 CAD/GDP, 1st difference -10.08120 -4.243644 -3.544284 -3.204699
Iran ADF CAD, level -4.540314 -4.243644 -3.544284 -3.204699
PP CAD, level -3.637644 -4.234972 -3.540328 -3.202445
CAD,
1st difference -14.75335 -4.243644 -3.544284 -3.204699
Iraq ADF CAD, level -5.436251 -4.992279 -3.875302 -3.388330
PP CAD, level -5.886647 -4.992279 -3.875302 -3.388330
Kuwait ADF CAD, level -5.092792 -4.234972 -3.540328 -3.202445
PP CAD, level -5.085238 -4.234972 -3.540328 -3.202445
Oman ADF CAD, level -3.389682 -4.234972 -3.540328 -3.202445
CAD, 1st difference -7.134157 -4.243644 -3.544284 -3.204699 PP CAD, level -3.320742 -4.234972 -3.540328 -3.202445 CAD, 1st difference -7.989878 -4.243644 -3.544284 -3.204699
Qatar ADF CAD, level -2.334140 -4.234972 -3.540328 -3.202445
CAD, 1st difference -6.213662 -4.243644 -3.544284 -3.204699 PP CAD, level -2.323597 -4.234972 -3.540328 -3.202445 CAD, st difference -6.215804 -4.243644 -3.544284 -3.204699
Saudi Arabia ADF CAD, level -2.834005 -4.234972 -3.540328 -3.202445
CAD, 1st difference -5.315040 -4.243644 -3.544284 -3.204699 PP CAD, level -2.834005 -4.234972 -3.540328 -3.202445 CAD, 1st difference -5.305148 -4.243644 -3.544284 -3.204699 United Arab Emirates
ADF CAD, level -4.001501 -4.243644 -3.544284 -3.204699
CAD,
1st difference -4.912223 -4.273277 -3.557759 -3.212361
PP CAD, level -2.919574 -4.234972 -3.540328 -3.202445
CAD,
1st difference -6.133994 -4.243644 -3.544284 -3.204699
Note. *** indicates an importance level of 1%. The quantity of lags in the ADF testing is identified in accordance with the Schwarz criteria which is a powerfuler criterion and yields preferable outcomes than the other criterions. In the Philips Perron tests, the quantity of lags identified in accordance with Newey-West Bandwith is received. Qua a test form, fixed and trend equalization options are usaged for all variants at the level value. The fixed equalization option is used to acquire the first difference of the variants. MacKinnon crucial (critical) values are considered.
In the event of 2 (two) breaks, the crucial values are formulated in Lee and Strazicich (2003). The tests figures are for the minimal in breakage points. In Model C, the critical (crucial) values are attached to the breakage points. The null-hypothesis is rejected when the LM tests statistics are greater than the crucial values formulated by Lee and Strazicich (2003). Rejection of the null-hypothesis expresses a non-constant process. Table 5 gives the conclusions of the minimal LM unit root tests when there are two constructive (structural) breakings.
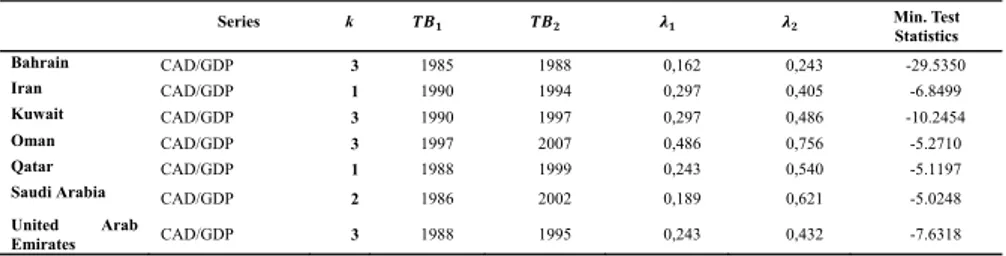
Table 5. The Results of Lee Strazicich Unit Root Tests
Series k Min. Test
Statistics Bahrain CAD/GDP 3 1985 1988 0,162 0,243 -29.5350 Iran CAD/GDP 1 1990 1994 0,297 0,405 -6.8499 Kuwait CAD/GDP 3 1990 1997 0,297 0,486 -10.2454 Oman CAD/GDP 3 1997 2007 0,486 0,756 -5.2710 Qatar CAD/GDP 1 1988 1999 0,243 0,540 -5.1197
Saudi Arabia CAD/GDP 2 1986 2002 0,189 0,621 -5.0248
United Arab
Emirates CAD/GDP 3 1988 1995 0,243 0,432 -7.6318
Note. and are the breakage times, k is the delay dimension, St-1 is the coefficent on the unit root factor. Since the series is a series of 1 year, the quantity of investigations is less and maximal of 3 lags are taken. In the event of further lags, there may be a trouble because the quantity of investigations is little. The numbers in parantheses are t-statistics. Crucial values for the cofficient on the dummy variants follow the standard ordinary dispensation. a, b, c point
Tablo 6: Crucial Values of the Two Breaks Minimum LM Tests (i) .4 .6 .8 .2 -6.16, -5.59, -5.28 -6.40, -5.74, -5.32 -6.33, -5.71, -5.33 .4 - -6.46, -5.67, -5.31 -6.42, -5.65, -5.32 .6 - - -6.32, -5.73, -5.32 (i) .4 .6 .8 .2 -55.5, -47.9, -44.0 -58.6, -50.0, -44.4 -57.6, -49.6, -44.6 .4 - -59.3, -49.0, -44.3 -58.8, -48.7, -44.5 .6 - - -57.5, -49.8, -44.4
Note: Crucial values are at the 1%, 5%, and 10% levels, respectively.
The calculated breakpoints for CAD/GDP are shown in the and columns in Table 5. There are statistically substantial breakages in both the intercept and the trend for CAD/GDP in the Gulf states of Saudi Arabia (1986 and 2002), Qatar (1988 and 1999), Oman (1997 and 2007), Kuwait (1990 and 1997), Iran (1990 and 1994), Bahrain (1985 and 1988) and the UAE (1988 and 1995). These years coincide with the following crises: Saving and Loan Crisis (1980s), The Stock Market Crash (1987), Junk Bonds Crash (1989), The Mexican Curency Crisis (1994), The Asian Financial Crisis (1997-1998), The Dot-com Bubble Bursts (1999-2000), The Global Financial Crisis (2007-2008), and general recession in commodity prices (1980-2000). As can be seen in Table 6, the critical (crucial) values for CAD/GDP in Iran, Kuwait, Bahrain and the UAE at conventionally significant levels are bigger than the minimum LM test scores. Being a stationary process, it is feasible to deny the null hypothesis for the unit root.
Conclusion
The current account balance reflects economic decisions, expectations and political standing of all the units in the economy. For this reason, it is a quite important indicator for the policymakers who should design their policies by trying to understand the underlying reasons and analying its sustainability. The researches concentrate on the current deficit, because it gives relatively bigger damages. In this article, the current surpluses of the Gulf countries, which are in the position of the oil exporters having the current surplus that cover the current deficits, have been reviewed by discussing and the sustainability of this surplus have been examined. For this reason, this article contributes to the literature.
In this examination where the current account balance is analyzed in Gulf Economies, it seems that the ADF and PP unit root tests and LM Unit Root Tests two constructive breakages are coherent. As indicated by ADF, PP Unit Root Tests, and Lee and Strazicich Unit Root Tests with two constructive breakings conclusion; the unit root null hypothesis could be rejected. An evidence that CAD/GDP series is constant implies that CAD/GDP have a temporary impact. On the another hand, Bahrain, Iran, Kuwait, United Arab Emirates’ current account surpluses are sustainable. This result is consistent with the findings that Edwards reached in his empirical study, which says that the current surplus can be permanent in some countries. This is crucial for its impact on other macro-economic variants like the value of national currency, export, inflation and Foreign Direct Investments (FDI). Thus, these results of the analysis are so important for the policymakers.
Although the empirical results came out as sustainable, it is dangerous that the incomes of the Gulf countries are solely depend on oil. The fragility of these economies increases because of the decline in oil prices, the slowdown in the global growth dominated by China and India, and the emergence of renewable energy sources so as to take the place of oil. Besides, the policymakers should also consider that the oil reserves in all countries are exhaustible sources of energy.
It is important to increase the contribution of non-oil sectors to GDP and their varieties in economies of these Gulf countries, which are based only on oil revenues. Increasing varieties in the entertainment sector in Saudi Arabia, by lifting the 35-year old ban on cinemas since March 2018 through which 30 thousand new jobs are created and a contribution of 24 billion dollars per year to the economy is expected, by letting women go and watch the sport events and also drive cars, by building a giant city named NEOM at the shore of the Red Sea and linked to Egypt and Jordan to
concentrate on the industries like energy, water, biotechnology, food, advanced production, entertainment, are all significant attempts to use oil revenues reasonably towards reducing the dependence of these countries on oil.
References
Apergis, N., Katrakilidis, K.P. and Tabakis, N.M. (2000). Current account deficit sustainability:
The case of Greece. Applied Economics Letters, 7. 599–603.
Arezki, R. and Nalbi, M. K. (2012, April). Natural Resources, Volatility, and Inclusive Growth:
Perspectives from the Middle East and North Africa. IMF Working Paper. WP/12/111.
Arize, A. (2002). Imports and Exports in 50 Countries: Tests of Cointegration and Structural
Breaks. International Review of Economics and Finance, 11(1). 101–115.
Baharumshah, A., Lau, E., and Fauntas, S. (2003). On the Sustainability of Current Account
Deficits: Evidence from Four ASEAN Countries. Journal of Asian Economics. 14(3). 465–
487.
Bahmani-Oskooee, M. (1994). Are Imports and Exports of Australia Cointegrated? Journal of Economic Integration. 9(4). 525–533.
Blanchard, O. and Milesi-Ferreti, G.M. (2011, March 1). Why Should Current Account Balances Be
Reduced? IMF Staff Discussion Note. 03. 1-15.
BP. (2016). Statistical Review of World Energy-Underpinning Data, 1965-2016. BP, (2017). Energy Outlook 2017 Edition.
BP. (2018, June). Energy Outlook. 67th Edition.
Carrion-i-Silvestre, J. L., Kim, D. & Perron, P. (2009). GLS-Based Unit Root Tests with Multiple
Structural Breaks Under Both the Null and the Alternative Hypotheses. Econometric Theory.
25. 1754-1792.
Christopoulos, D., and Leon–Ledesma, M., (2010). Current account sustainability in the US: What
did We Really Know about It?. Journal of International Money and Finance, 29(3). 442–459.
Edson, H. (2003). Do Indicators of Financial Crisis Work? An Evaluation of an Early Warning
System. International Journal of Finance and Economics. 8 (1). 11-53.
Edwards, Sebastian (2004, Jan.). Thirty Years of Current Account Imbalances, Current Account
Reversals and Sudden Stops. NBER Working Paper. No.10276.
Fountas, S., and Wu, J. L. (1999). Are the US Current Account Deficits Very Sustainable? International Economic Journal. 13(3). 51–58.
Frankel, J.A. (2012, April). The Natural Resource Curse: A Survey of Diagnoses and Some
Prescriptions. Accessed on 09.11.2018.
https://dash.harvard.edu/bitstream/handle/1/8694932/rwp12014_frankel.pdf?sequence=1 Gelb, A. (2012). Economic Diversification in Resource Rich Countries. Presentation at the
Economic Research Forum Conference on Understanding and Avoiding the Curse in the Arab World, January 2012, Kuwait. http://www.eisourcebook.org/cms/files/paper,_economic_ diversification_in_resource_rich_countries.pdf
Gould, D. M., and Ruffin, R. J. (1996). Trade deficits: Causes and consequences. Federal Reserve Bank of Dallas Economic Review. 10–20 (fourth quarter).
Guastella, A. and Menghi, A. (December 2016). GCC Market, Overview and Economic Outlook
2017: A Challenging Transformation Ahead to Achieve Desirable Growth. Perspective,
http://www.valuepartners.com/wp-content/uploads/2016/12/MENA-REGION-122016-DIGIVERSION.pdf
Team. (2015). Global Implications of Lower Oil Prices. Accessed on: 24.02.2016, http://www.imf.org/external/pubs/ft/sdn/2015/sdn1515.pdf.
International Energy Agency (IEA). (2017). World Energy Outlook 2017.
Husted, S. (1993). The emerging US current account deficit in the 80s: A cointegration analysis. The Review of Economics and Statistics. 74(1). 159–66.
Kosinowski, M. (2002, Oct.8). Oil exploitation technologies. Fossil Energy. Springer, Landolt-Börnstein - Group VIII Advanced Materials and Technologies. 25-39.
Lee, J., and Strazicich, M. C. (2003). Minimum Lagrange Multiplier Unit Root Test with Two
Structural Breaks. Review of Economics and Statistics. 85(4). 1082-1089.
Lee, J., and Strazicich, M. C. (2004). Minimum LM Unit Root Test with One Structural Break. Appalachian State University Working Papers. 04(17). 1-15.
Lumsdaine, R.L., and Papell, D.H. (1997). Multiple Trend Breaks and The Unit Root Hypothesis. The Review of Economics and Statistics. 79. 212- 218.
Mann, C. L. (2002). Perspective on the US current account deficit and sustainability. Journal of Economic Perspectives. 16(3). 131–152.
Ng, S., and Perron, P. (2001). Lag Length Selection and the Construction of Unit Root Tests with
Good Size and Power. Econometrica. 69. 1519- 1554.
Obstfeld, M. and Kenneth, R. (1995). The Intertemporal Approach to the Current Account. In G. Grossman and K. Rogoff (eds.), Handbook of International Macroeconomics, Vol.3 Amsterdam: North Holland.
Obstfeld, M. and Kenneth, R. (1996). Foundations of International Macroeconomics. Cambridge, MA: MIT.
Obstfeld, M. (2012, March). Does the Current Account Still Matter? NBER Working Paper No.17877.
Perron, P. (1989). The Great Crash, The Oil Price Shock, and The Unit Root Hypothesis. Econometrica. 57(2). 1361-1401.
Perron, P. (1997). Further Evidence on Breaking Trend Functions in Macroeconomic Variables. Journal of Econometrics. 80. 355-385.
Sachs, J. (1981). The Current Account and Macroeconomic Adjustment in the 1970s. Brooking Papers on Economic Activity. 1. 201-282.
Schneider, M. (2004). The Impact of Oil Price Changes on Growth and Inflation. Monetary Policy & The Economy. Q2/Q4. 27-34.
Türkiye Petrolleri. (2016, May). Ham Petrol ve Do algaz Sektör Raporu.13-14.
Vohra, R. (2017 Feb.) The Impact of Oil Prices on GCC Economies. International Journal of Business and Social Science. (8/2).
Zanghieri, P. (2004). Current Accounts Dynamics in New EU Members: Sustainability and Policy
Issues. CEPII Working Paper. No. 07.
Zivot, E. and Andrews, D. (1992, July). Further Evidence on the Great Crash, the Oil-Price Shock,