VALIDATION OF COMPUTATIONAL FLUID DYNAMIC ANALYSIS OF
NATURAL CONVECTION CONDITIONS FOR
A RESIN DRY-TYPE TRANSFORMER WITH A CABIN
byGulsen YAMAN a*, Ramazan ALTAY b, and Ramazan YAMAN c a Department of Mechanical Engineering, Balikesir University, Balikesir, Turkey
b BEST A. S., R&D Department, Balikesir, Turkey
c Department of Industrial Engineering, Gelisim University, Istanbul, Turkey Original scientific paper
https://doi.org/10.2298/TSCI180919327Y
Many industrial products work under different constraints. Examples of these products include transformers and keeping them in certain operating temperatures is an important design constraint. However, since power transformers have dif-ferent requirements, there are no standard products. For this reason, it is difficult and costly to test each one by considering these constraints and to design them accordingly. Satisfactory thermal analysis using a 3-D finite volume-based CFD model is an important step to understand natural convection and necessary design modifications under the desired conditions.
The aim of this study is to verify the performance and reliability of the design by comparing the experimental results with 3-D finite volume analysis results by considering cooling of a dry resin type transformer with a cabin. The effect of the cabin on the product in terms of natural heat convection is also evaluated.
Key words: CFD analysis, natural heat convection, dry-type transformer,
temperature distribution
Introduction
A transformer is an electrical device that transfers electrical energy between two or more circuits through electromagnetic induction without changing the frequency and has no moving parts. Transformers can be classified in two main groups as dry-type (in ambient air) and oil-filled type in terms of insulation and cooling systems. Dry-type transformers are cooled by two basic heat transfer methods: air natural convection and air natural-air forced convection. Dry-type transformers are manufactured with cabins according to desired International Protec-tion Marking standards (in this study, this is IP-31).
Convection is heat transfer due to bulk movement of molecules within fluids such as gases and liquids. Natural cooling is the result of decreasing density of heated air and moment in the opposite direction to gravity. This movemoment results in air reaching a certain ve-locity causing heat transfer by convection through the contact surfaces. As a result of this, the transformer is naturally cooled. Natural cooling is enhanced by leaving ventilation holes in the upper and lower parts of the cabin. The air that enters the bottom ventilation holes at ambient temperature heats up because of the energy loss of the transformer. The heated air moves
wards the upper ventilation holes. While this cycle of movement goes on continuously, cooling of the transformer is ensured as a matter of course.
Designs of dry-type transformers are regulated by the standard IEC 70016-11. Ambi-ent temperature values must be known in order to calculate the desired winding temperatures. It is not correct to assume that the temperature inside the cabin and the ambient temperature are equal for dry-type transformers. For this reason, determining the effect of the cabin geometry on the transformer’s core temperature and choosing the most effective cabin geometry for opti-mum cooling performance is very important.
Literature review
Much research has been carried out on prediction of heat generation in the coils, and how the heat is distributed between them. Reviewed research articles that mention these matters can be presented in the following manner when briefly evaluated in terms of their main context.
Komurgoz and Guzelbeyoglu [1] analyzed the temperature distributions of the coils and core obtained by finite element method considering the cooling effect of the oil channels between the windings and the core. As well as the temperature distribution in the windings and the core, temperature distribution and movement of the surrounding air was also determined. The temperature level and the location of the hot spots were determined. The effect of air ducts on the coil temperature in constant and varying ambient conditions in dry-type transformers for different powers was analyzed by Lee et al. [2] who also compared calculated temperature values with the experimentally-measured temperature values.
Rahimpour and Azizian [3], and Eslamian et al. [4] investigated the effect of tempera-ture variations on the coils with different numbers of air ducts in dry-type transformers. The ef-fect of eddy losses and radiation on the temperature of the coil was also investigated. Moreover, it was proven that the paper bands used in coils have no effect on temperatures [3]. Dry-type transformers were investigated by Eteiba et al. [5] in terms of the temperature distributions of coils and cores at different ambient temperatures. The effect of air ducts with different dimen-sions on the temperatures of windings was also investigated.
A thermal model of the oil-filled-type transformer for oil natural convection cooling system was created and the determined values were compared with the test results from an identical transformer by Gastelarrutia et al. [6]. The temperatures and velocity distributions obtained from the calculations are visually specified in the sections taken from the transformer model. Cremasco et al. [7] studied the heat and flow analysis of a dry-type transformer, which was cooled by means of a fan in a cabinet. The CFD and thermal/pressure network models were used in the analysis and the results were compared. As a result of these obtained values, the aim was to optimize the cooling systems.
In 1994, Pierce [8] studied ventilated dry-type transformers and found that hottest spot allowances in IEEE standards for transformers larger than 500 kVA are too low and should be revised. He also developed a mathematical model to predict hottest spot temperature rises in ventilated dry-type transformers. Pierce [8] used a system of finite difference nodal equations to estimate hottest spot temperatures and revised the model using six layer test windings and a 2500 kVA prototype transformer.
Tripathi et al. [9] have obtained the temperature distributions of air in the room be-cause of changing the input speeds and room dimensions (aspect ratio) for a closed room. Reyn-olds number and Gr/Re2 numbers were modified for three different aspect ratios for the room and as a result the streamline and isotherm charts of the room were obtained.
Hannun et al. [10] have studied to increase the cooling performance of a 250 kVA oil-type transformer by means of the earth-air heat exchanger (EAHE) method. Here, the EAHE method was compared with the results of the study using the previously made nanofluid and pure oil. As a result of this study, it was seen that the EAHE method provides more efficient cooling. Also, the pipe diameters and air inlet velocities used in EAHE method were investigat-ed to see the effect of transformer on cooling performance.
Materials and method
This phase can be evaluated in the following stages: – Deciding on the basis of the model.
– Designing solution steps for the model. – Solving the model using suitable software.
– Experimental set-up modeling from real system considerations. – Manufacturing of the experimental set-up.
– Carrying out experiments.
– Collection of the experimental results.
– Comparing and representing the analytical and empirical results. Mathematical model
The mathematical model for the thermal analysis of a cast resin dry-type transformer was developed to obtain the temperature distribution in the cabin. Some mechanical parts, such as clamps and bolts, were ignored in the model for simplification of the model and experimental set-up.
The structure of a transformer is complex, and some assumptions are required. For the aspect of heat analysis, four main components of the transformer can be considered: iron core, low voltage coils, high voltage coils, and air ducts. With this simplified structure, heat transfer fundamentals can be assessed as follows.
Accordingly, the general equations for the temperature distribution and fluid mo-tion in the transformer are shown below. Equamo-tions are derived from the conservamo-tion laws in steady-state 3-D [11, 12]:
– mass conservation equation
( )
u( )
v( )
w 0 x y z ρ ρ ρ ∂ ∂ ∂ + + = ∂ ∂ ∂ (1)– momentum conservation equation
2 2 2 2 2 2 x u u u p u u u u v w S x y z x x y z ρ ∂ + ∂ + ∂ = −∂ +µ∂ +∂ +∂ + ∂ ∂ ∂ ∂ ∂ ∂ ∂ (2a) 2 2 2 2 2 2 y v v v p v v v u v w S x y z y x y z ρ ∂ + ∂ + ∂ = −∂ +µ∂ +∂ +∂ + ∂ ∂ ∂ ∂ ∂ ∂ ∂ (2b) 2 2 2 2 2 2 z w w w p w w w u v w S x y z z x y z ρ ∂ + ∂ + ∂ = −∂ +µ∂ +∂ +∂ + ∂ ∂ ∂ ∂ ∂ ∂ ∂ (2c)
2 2 2 * 2 2 2 T T T T T T c u v w k q x y z x y z ρ ∂∂ + ∂∂ + ∂∂ = ∂∂ +∂∂ +∂∂ + +φ (3)
where T [K] represents the temperature, p [Nm–2] – the pressure, q* [Wm–3] – the heat source,
k [Wm–1K–1] – the thermal conductivity, ρ [kgm–3] – the density of material, c [Jkg–1K–1] – the specific heat, and µ [kgm–1s–1] – the dynamic viscosity of fluid. Also, u, v, w are the velocity components in x-, y-, and z-directions. The Sx, Sy, Sz are the mass forces per unit volume in x-,
y-, and z-directions, respectively. The ϕ is the viscous dissipation defined:
2 2 2 2 2 2 2 u v w v u w v u w x y z x y y z z x φ µ= ∂∂ +∂∂ +∂∂ +∂∂ +∂∂ +∂∂ +∂∂ +∂∂ +∂∂ (4) The numerical simulation of heat transfer was carried out with ANSYS 14.5. A 3-D view of a three-phase cast resin dry-type transformer is used in the analysis [13].
To solve conservation equations, many boundary conditions must be applied to the surfaces of the model. Winding losses, convection and radiation relations are used to obtain a complete graph of the temperatures at every location in the model. In natural convection problem solutions, temperature and velocity of fluid are interdependent, so all basic equations are iteratively and simultaneously solved. From the solution of the equations, it is possible to determine the heat transfer coefficients between the surfaces and the fluid, to obtain the flow fields and to find the temperature fields of the whole system as solids and fluids.
Natural convection: The heat transfer rate of convection is obtained using the equa-tion below [12]:
conv ( s air)
q′′ =h T T− (5)
where q′′conv [Wm–2] represents heat transfer rate per unit area at the outer surface, h [Wm–2K–1] – the heat transfer coefficient for convection from outer surface, Ts [K] – the local temperature of surface, and Tair [K] – the ambient temperature.
The theoretical equations for convective heat transfer are quite complex [11, 12]. The resulting transport equations are usually experimentally-obtained formulations. These formu-lations are not essential here. The main equations used in the natural convection heat transfer are as follows:
Heat transfer coefficient, h:
air Nu c k h L = (6)
Grashoff, Rayleigh, and Prandtl numbers:
(
)
3 s air 2 g Gr c L T T L β ν − = RaL =Gr PrL Pr air c k µ = (7)where g [ms–2] represents acceleration of gravity, β [K–1] – the volumetric expansion of fluid, ν [m2s–1] – the kinematic viscosity of fluid, µ [kgm–1s–1] – the dynamic viscosity of fluid, c [Jkg–1K–1] – the specific heat, and L
c [m] – the characteristic length of geometry.
Radiation: Outer surface is a vertical cylindrical surface and can be assumed as a vertical plate. Two types of heat transfer can occur on the outer surface, including radiation and natural convection.
For the outer surface, radiation can be expressed using the equations [11, 12]: 4 4 s air ( s air) ( ) r r q′′ =εσ T +T =h T T− (8) 2 2 s air s air ( )( ) r h =σε T T+ T +T (9)
where q′′r [Wm–2] – the heat transfer rate per unit area by radiation, hr [Wm–2K–1] – the local
heat transfer coefficient for radiation from outer surface, and ε is emissivity coefficient of sur-face. Also, Ts [K] – the local temperature of the surface, Tair [K] – the ambient temperature, and
σ = 5.67∙10−8 W/m2K4 is Stephan Boltzmann’s coefficient.
The CFD analysis using FLUENT
In the analysis, firstly a 3-D model of the internal volume which is the gas for the fluid analysis is created. For creation of this model, designed solid volumes were subtracted from the total volume of the cabin rather than the volume defining the boundary conditions. AUTODESK INVENTOR software was used for all these stages, see fig. 1.
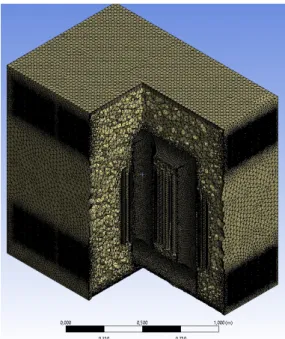
The created 3-D mesh structure is presented in fig. 2. The mesh structure plays an im-portant role in the calculations. The mesh elements are volume and they are defined and placed semi-automatically by the ANSYS/FLUENT software. The mesh structure of the problem is prepared using the curvature size function. Mesh structure is mostly composed of tetrahedral mesh. A total of 7293011 elements and 1599753 points are used in the model. Figure 3 shows temperature distribution in the cabin. Knowing these distribution and temperature values are important before manufacturing the transformer and its cabin. These predicted parameters im-prove the design and shortened the test times.
Figure 1. The 3-D Model of the transformer for the ANSYS Fluent Analysis (Prepared fluid flow volume)
Figure 2. Mesh structure of the 3-D model for Fluent analysis
In this regard, FLUENT (ANSYS) was chosen among possible software programs as it is proven to be successful and accepted. Then, the values of these boundary surfaces were de-termined and entered into the program for the analysis. When entering the limit surface, the measured values of a similar previously-manu-factured transformer are used (250 kVA 11/0.4 kV Dyn11 BEST dry-type transformer).
Following the construction of this model design and determination of the requirements for the CFD analysis, the following sample forms for gradients of internal volume air tem-peratures, figs. 4(a) and 4(b), were observed.
Figure 3. Temperature distribution of 3-D model (for color image see journal web site)
Figure 4. (a) Cross-section (X-Y) analysis of the prepared model, (b) cross-section (X-Z) analysis of the prepared model (for color image see journal web site)
(a) (b)
Experimental set-up
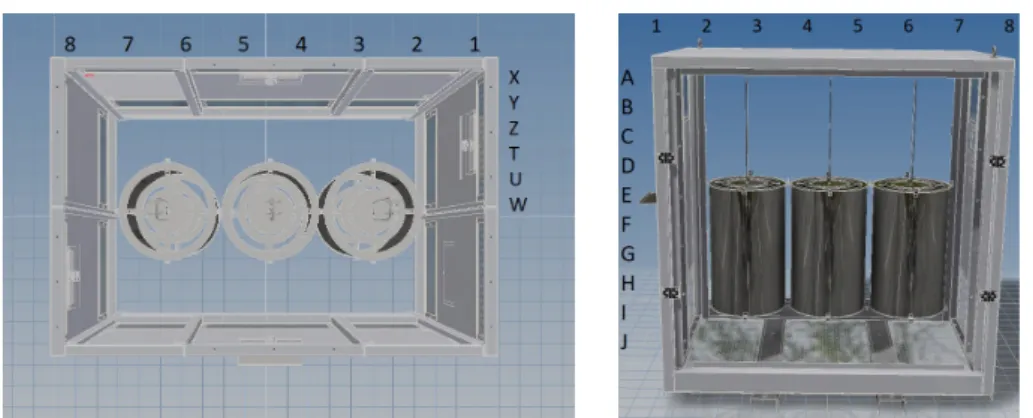
In order to verify the success of the model, a real cabin was prepared by considering the actual transformer dimensions and design. For design and construction of the experimen-tal set-up, measurements are intended to be made easily and to form the closest values to the true temperatures. It is assumed that most of the losses that occur here (eddy losses and noise losses are neglected) are converted to heat. Three quartz resistances (each 1 kW) were used to represent the cores and they were placed in the specially-designed cylindrical volumes. These cylindrical volumes also have the actual dimensions of the winding volume and are shaped with suitable geometries to allow heat flow in the upper and lower cores.
Figures 5(a) and 5(b) shows the cross-section (X-Z) and (X-Y) of the internal struc-ture of the prepared model, respectively.
Thermocouple sensors were also attached to the tensioned 0.3 mm diameter wires that were connected to the co-ordinates of the specified points to form each measurement range, and the measurements continued every 30 seconds until the system temperature values became stable. The appearance of the data collection devices (HOBO data logger) and thermocouples is shown in figs. 6 and 7.
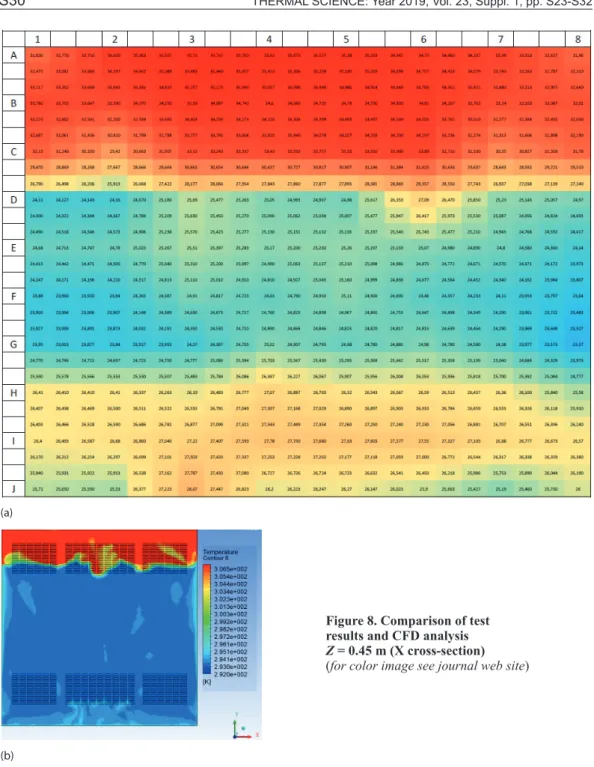
Numerical analysis and experimental results
For certain co-ordinates, the experimental values and numerical values could be com-pared with fig. 8 and tab. 1. This comparison verifies the thermal model and its analysis. So, these verifications indicate that design and manufacturing of the system can be supported and improved with the CFD analysis.
Figure 5. A view of the internal structure of the prepared model (a) in (X-Z) direction and (b) in (X-Y) direction
Figure 6. Data collection devices and test set view during measurements
Figure 7. The view of the location of the thermocouples during measurements
Table 1. Some temperatures values for comparison
A CFD X Exp. CFD Y Exp. CFD Z Exp. 1 34.95 31.83 39.63 37.84 35.97 37.96 2 34.25 34.65 37.32 37.46 34.25 36.30 3 37.39 35.71 38.76 38.52 37.88 37.16 4 37.32 35.82 39.69 39.50 38.14 38.28 5 36.78 35.38 37.10 38.52 37.76 38.00 6 38.50 34.73 38.29 38.41 37.90 37.47 7 34.51 33.99 37.51 37.03 34.30 35.50 8 33.33 31.96 39.90 37.68 35.44 36.64
This study has shown that when the CFD analysis and the experiments can be performed correctly, the results can be taken into consideration and used for design and improvements. However, in order to be able to test each cabin according to the experiment, approximately 480 (6 × 10 × 8) points were measured in spite of symmetry acceptance. This was completed with 60 measurements. Approximately 45 minutes of measurement
Figure 8. Comparison of test results and CFD analysis Z = 0.45 m (X cross-section)
(for color image see journal web site)
(a)
time was required excluding preparations for each measurement. This indicates the cost of time and labor.
Conclusions and further studies
As a result of this CFD analysis and experimental work, the variation of temperature distributions in the cabin was determined for a dry-type transformer with cabin. The obtained CFD analysis data and the experimental data comply with each other. It offers important in-dications that CFD analysis can be a significant contributor to transformer cabin design with new dimensions and specifications and may be a decisive step in decision-making. Thus, cabin design can be completed in a shorter time, and only with the last analysis. In addition, studies may be recommended for further work to ensure a more efficient natural flow by modifying the design and geometry of the cabin (cabin roof, air inlet and outlet locations).
Acknowledgment
We would like to thanks BEST A. S. for support in completing the experimental work.
Nomenclature
c – specific heat, [Jkg–1K–1] g – acceleration of gravity, [ms–1]
h – heat transfer coefficient for convection from outer surface, [Wm–2K–1]
hr – local heat transfer coefficient for radiation from outer surface, [Wm–1K–1]
k – thermal conductivity, [Wm–1K–1]
Lc – characteristic length of geometry, [m]
q – heat transfer rate per unit area at the outer surface, [Wm–2]
q* – heat source, [Wm–3]
Sx,Sy,Sz – mass forces per unit volume in x-, y-, z-directions
T – temperature, [K]
Tair – ambient temperature, [K]
Ts – local temperature of surface, [K]
u, v, w – velocity components in x-, y-, z-directions
Greek symbols
β – volumetric expansion of fluid, [K–1]
µ – dynamic viscosity of fluid, [kgm–1s–1]
µϕ – viscous dissipation
ε – emissivity coefficient of surface ν – kinematic viscosity of fluid, [m2s–1]
ρ – density, [kgm–1]
σ – Stephan Boltzmann’s
coefficient, (= 5.67∙10−8 W/m2 K4)
Subscripts
air – ambient (air) c – characteristic r – radiation s – surface
x, y, z – Cartesian co-ordinates References
[1] Komurgoz, G., Guzelbeyoglu, N., Determining of the Temperature Distribution of Self-Cooled Dry Type Power Transformers, Itu Journal/d, Engineering, 1 (2002), 1
[2] Lee, M., et al., Air Temperature Effect on Thermal Models for Ventilated Dry-Type Transformers, Electric
Power Systems Research, 81 (2011), 3, pp. 783-789
[3] Rahimpour, E., Azizian D., Analysis of Temperature Distribution in Cast-Resin Dry-Type Transformers,
Electrical Engineering, 89 (2007), 4, pp. 301-309
[4] Eslamian, M., et al., Thermal Analysis of Cast-Resin Dry-Type Transformers, Energy Conversion and
Management, 52 (2011), 7, pp. 2479-2488
[5] Eteiba, M. B., et al., Steady State Temperature Distribution of Cast-Resin Dry Type Transformer Based on New Thermal Model Using Finite Element Method, World Academy of Science, Engineering and
Technology, 4 (2010), 2, pp. 806-810
[6] Gastelurrutia, J., et al., Numerical Modelling of Natural Convection of Oil Inside Distribution Transform-ers, Applied Thermal Engineering, 31 (2011), 4, pp. 493-505
[7] Cremasco, A., et al., Thermal Simulations for Optimization of Dry Transformers Cooling System,
Scien-tific Computing in Electrical Engineering, Mathematics in Industry, 23 (2016), Jan., pp. 103-113
[8] Pierce, L. W., Predicting Hottest Spot Temperatures in Ventilated Dry Type Transformer Windings, IEEE
[9] Tripathi, B., et al., A CFD Analysis of Room Aspect Ratio on the Effect of Buoyancy and Room Air Flow,
Thermal Science, 11 (2007), 4, pp. 79-94
[10] Hannun, R. M., et al., Heat Transfer Enhancement from Power Transformer Immersed in Oil by Earth Air Heat Exchanger, Thermal Science, On-line first, https://doi.org/10.2298/TSCI117231116H
[11] Holman, J. P., Heat Transfer, McGraw-Hill Book Company, New York, USA, 2014
[12] Incropera, F. P., David, P. D., Fundamentals of Heat and Mass Transfer, John Wiely and Sons, NewYork, USA, 2011
[13] ***, ANSYS R14.5, FLUENT in ANSYS Workbench User’s Guide, 2012
Paper submitted: September 19, 2018 Paper revised: September 30, 2018 Paper accepted: October 27, 2018
© 2019 Society of Thermal Engineers of Serbia Published by the Vinča Institute of Nuclear Sciences, Belgrade, Serbia. This is an open access article distributed under the CC BY-NC-ND 4.0 terms and conditions