Casualty Evacuations
Özgür Nuhut Army War Academy Ankara, 06654 Turkey [email protected]
Ihsan Sabuncuoglu
Department of Industrial Engineering Bilkent University
Ankara, 06533 Turkey
Since war games and field exercises are very expensive, mathematical models are often developed to analyze military systems. In this study, the authors investigate a brigade casualty evacuation system (BCES) via simulation. Specifically, they model the existing BCES of the Turkish Army and analyze the system to improve the patient flow processes in main facilities. The proposed model aims to provide the necessary information to the commanders in a maneuver, logistics, and medical unit about casualties such as time in medical facilities, waiting times in doctor queues, utilization of doctors, and percentages of casualties who return to duty or are sent to higher level medical facilities. The simulation model is also used to compare several alternative system designs and evaluate their impacts on system performance. The result of this study highlights the major problem areas of the system and the possible ways to deal with them.
Keywords: Military, casualty evacuation, simulation
1. Introduction
Warfare has changed significantly since World War II. The range and accuracy of the lethal modern weapon systems are far more effective than weapon systems of World War II. Fighting engagements are now conducted on a nonlin-ear and expanded battlefield, which demands changes in the delivery of combat health support (CHS). Hence, CHS must also address the requirements for force projection, as well as field characteristics of dispersion, rapid military operations, increased mobility, rapid task organization, and extended lines of communications. These facts of fighting engagements make the battlefield more lethal than ever. As the battlefield becomes increasingly lethal, sustaining the health of the fighting forces becomes a critical factor in the success or failure of the mission. Comprehensive planning enhances the capability of medical units to provide effec-tive health support and service (HSS), which ultimately increases the chances for survival of the wounded soldier. The forward support characterizes the role that HSS must assume. The aim of HSS is to maximize the return-to-duty (RTD) rate. This conserves the human component of the tactical commander’s weapons system. We now realize that
| |
taking care of the unit’s casualties helps to build unit morale and confidence in the chain of command.
The recent earthquake in Turkey has clearly indicated that an effective evacuation system is very important to save thousands of lives. In fact, this terrible incident is the main reason for our study since similar problems can arise in severe war conditions. The objective of this study is to model the existing brigade casualty evacuation system (BCES) of the Turkish Army, analyze the system, identify major problem areas, and solve its problems associated with patient flow processes in the main facilities. Since the system is dynamic and contains many stochastic ele-ments, we use simulation as the modelling and analysis tool. The proposed system can also be used to compare al-ternative system designs and provides a tool for evaluating the effectiveness of the existing system. The results of sim-ulation experiments produce useful information about the casualty evacuation system for unit commanders, logistical commanders, and medical commanders. This information includes (1) time in medical treatment facilities, (2) wait-ing time in queues, (3) utilization of resources, (4) number of patients according to their sickness categories, (5) per-centages of patients who return to duty, and (6) number of dead. With the help of these statistics, one can iden-tify problem areas in the BCES and inform commanders
addition, this study will determine how nonmedical logis-ticians can estimate their total obligation to support this system and provide a vital management tool to the HSS operation. The tool, when properly adjusted and used, will provide the balance between patient care and tactical sup-port requirements. This will allow the HSS operator to tai-lor an HSS package specifically designed to handle patient workloads, with maximum benefit to the patients and with maximum economy of available resources [1].
Note that for such a system considered in this study, it is quite possible that army commanders or experienced army officers can identify the problems and suggest pos-sible solutions. But without any scientific justification, all these statements will be just subjective assessments. In our opinion, any hypothesis or proposal should be tested by appropriate mathematical models before they are actually implemented in practice. The simulation model developed in this study simply provides such a decision tool for this purpose. In addition to the issues studied in this paper, it can also be used to investigate several other questions (i.e., whether the system is capable of handling a large military operation). How can the system react to sudden changes in war tactics? Does a new policy at the corps level make any difference? How do the changes in the level of stochastic elements affect the system performance in the worst-case conditions?
This study begins in Section 2, where the relevant litera-ture is briefly reviewed. In Section 3, the BCES is explained in detail. The simulation model of casualty evacuation is presented in Section 4, where the data requirement of the model is also discussed. After the model is validated, the output analysis is performed. The results of simulation ex-periments are presented in Section 5. Finally, concluding remarks and suggestions for further research are given in Section 6.
2. Literature Review
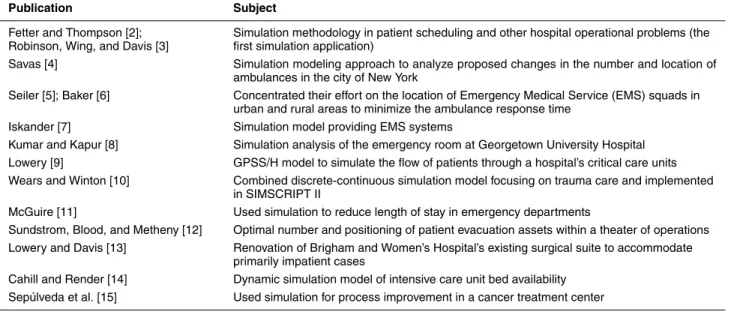
Over the past four decades, research in simulation has proven to be an important tool in the analysis of a wide variety of health care delivery systems. Today, researchers and analysts are beginning to uncover the potential use of simulation in the health care field with interactions be-tween patients, physicians, nurses, and technical and sup-port staff. Although there are some simulation applications in the medical area, to the best of our knowledge, there is no comprehensive simulation study involving all steps of evacuation and treatment through a chain of medical treat-ment facilities. During this literature review, however, we noted that there is one commercial computerized simula-tion software called MEDIC-1, which provides physicians and medical administrative people a decision-making tool. A list of related references and their specific application areas are given in Table 1.
The first simulation applications were due to Fetter and Thompson [2] and Robinson, Wing, and Davis [3], who used the simulation methodology in patient scheduling
and other hospital operational problems. In another study, Savas [4] employed a simulation modelling approach to an-alyze proposed new changes in the number and locations of ambulances in the city of New York. The studies by Seiler [5] and Baker [6] focused on the location of Emergency Medical Service (EMS) squads in urban and rural areas to minimize the ambulance response time. Iskander [7] de-veloped a simulation model for EMS system planners and managers to aid in the planning of their operations. Several other simulation models were also developed in the area of EMS. Later, Kumar and Kapur [8] performed a simulation analysis for the emergency room at Georgetown Univer-sity Hospital using the simulation approach to schedule nursing staff.
Lowery [9] developed a GPSS/H model to simulate the flow of patients through a hospital’s critical care units, in-cluding the operating room, postanesthesia recovery unit, and surgical intensive care unit. The objective of this study was to design and implement a simulation model of a com-munity hospital’s surgical suite and critical care area for the purpose of assisting hospital management in determining critical care bed requirements. Wears and Winton [10] de-veloped a combined discrete-continuous simulation model focusing on trauma care to allow prediction of the effect of policy changes on system performance and patient sur-vival. McGuire [11] applied simulation to reduce length of stay in emergency departments. The focus of this simula-tion applicasimula-tion was on a medium- to large-sized hospital in the southeast United States. Faced with an increasing number of patient complaints about long waiting times, the hospital employed simulation as a tool for the evalua-tion of alternative operating policies.
Sundstrom, Blood, and Matheny [12] determined the optimal number and positioning of patient evacuation as-sets within a field of operations by using linear program-ming. The authors discussed, through the use of linear pro-gramming techniques, the optimal number and positioning of patient evacuation assets within a theater of operations to ensure the orderly transfer of casualties from the front lines to third-level medical treatment facilities. Lowery and Davis [13], in Brigham and Women’s Hospital (BWH) in Boston, initiated a construction project to renovate its ex-isting surgical suite to accommodate primarily inpatient cases. Cahill and Render [14] developed a dynamic simu-lation model of intensive care unit (ICU) bed availability in their study. Sepúlveda et al. [15] employed simulation for process improvement in a cancer treatment center to ana-lyze patient flow throughout the unit, evaluated the impact of alternative floor layouts, conducted various schedul-ing options, and analyzed resources and patient flow requirements.
3. The Problem Definition and System Description Patient evacuation is the timely and efficient movement of wounded, injured, or ill persons from the battlefield to medical treatment facilities. Evacuation begins at the
Table 1. Summary of literature review
Publication Subject
Fetter and Thompson [2]; Simulation methodology in patient scheduling and other hospital operational problems (the Robinson, Wing, and Davis [3] first simulation application)
Savas [4] Simulation modeling approach to analyze proposed changes in the number and location of ambulances in the city of New York
Seiler [5]; Baker [6] Concentrated their effort on the location of Emergency Medical Service (EMS) squads in urban and rural areas to minimize the ambulance response time
Iskander [7] Simulation model providing EMS systems
Kumar and Kapur [8] Simulation analysis of the emergency room at Georgetown University Hospital Lowery [9] GPSS/H model to simulate the flow of patients through a hospital’s critical care units Wears and Winton [10] Combined discrete-continuous simulation model focusing on trauma care and implemented
in SIMSCRIPT II
McGuire [11] Used simulation to reduce length of stay in emergency departments
Sundstrom, Blood, and Metheny [12] Optimal number and positioning of patient evacuation assets within a theater of operations Lowery and Davis [13] Renovation of Brigham and Women’s Hospital’s existing surgical suite to accommodate
primarily impatient cases
Cahill and Render [14] Dynamic simulation model of intensive care unit bed availability Sepúlveda et al. [15] Used simulation for process improvement in a cancer treatment center
location where the injury or illness occurs and continues as far as the patient’s medical condition warrants or the military situation requires. The commander’s casualty plan must start with immediate treatment at the point of injury. When a casualty occurs during a conflict, the first soldier on the scene to render assistance is normally the casualty’s fighting position buddy. It is this soldier’s responsibility to start the treatment process by conducting buddy aid at the point of injury. The unit must understand that this initial treatment is the first building block in a successful com-pany medical plan [16].
In this study, we develop a simulation model of a ca-sualty evacuation system based on a Turkish brigade for defense operation under war conditions. The brigade in-volves three battalion task forces and approximately com-prises 6000 soldiers, whose commander is a brigadier gen-eral. In each battalion task force, there are three company teams, one headquarter company, one tank company, one artillery battery, one engineer company, one air defense company, one ordnance company, and one tow platoon. Its commander is a lieutenant colonel. A company is com-manded by the rank of a captain and is divided into four platoons. In each platoon, there are approximately 50 sol-diers commanded by a lieutenant. Due to the large size of the entire system, we model the system by classifying the patients as given below.
3.1 Classification of Patients
Patients need to be picked up for evacuation as soon as possible, consistent with available resources and pending missions. To simplify modeling and analysis, the following five categories of precedence and criteria are used in their assignment:
• Category 1—ROUTINE is assigned to sick, in-jured, or wounded personnel requiring evacuation but whose condition is not expected to deteriorate significantly. They return to duty after treatment. • Category 2—PRIORITY is assigned to sick,
in-jured, or wounded personnel requiring prompt med-ical care. This preference is used when individuals should be evacuated within 4 hours or their medi-cal condition could deteriorate to such a degree that the patients will become an URGENT preference, whose requirements for special treatment are not available locally or who will suffer unnecessary pain and disability. The patients are sent to the company first aid place.
• Category 3—URGENT is assigned to emergency cases in which patients are evacuated to a battalion medical aid station as soon as possible and within a maximum of 2 hours to save life, prevent com-plications of serious illness, or avoid a permanent disability.
• Category 4—URGENT-SURG is assigned to patients who must receive a surgical intervention to save their lives and stabilize them for further evacuation. They are sent to the brigade separate station by helicopter. If a helicopter is not available, they are sent to a battalion medical aid station by ambulance. • Category 5—CONVENIENCE is assigned to
pa-tients for whom evacuation by medical vehicle is a matter of medical convenience rather than necessity. We accepted these casualties as dead [17].
3.2 Evacuation Means
Depending on the combat situation, the modes of evac-uation may include walking wounded, manual and litter carries, and medical evacuation or nonmedical transporta-tion assets. Evacuatransporta-tion in the battalion area of responsi-bility normally depends on the ambulances assigned by brigade to the battalion. Casualties can be moved from the battlefield to the medical treatment facilities by army air-craft, helicopters, ground ambulances, or supply trucks and litters. The litter team is the first evacuation mean in the battle area. One team is allocated to each platoon. The am-bulance team is deployed within the company terrain. It operates, however, as far forward as the tactical situation permits. One ambulance team serves in direct support of a maneuver company. One ambulance team moves with the battalion headquarter company as a general support mean of the battalion. The brigade has one helicopter at the headquarter command post.
3.3 The Existing System
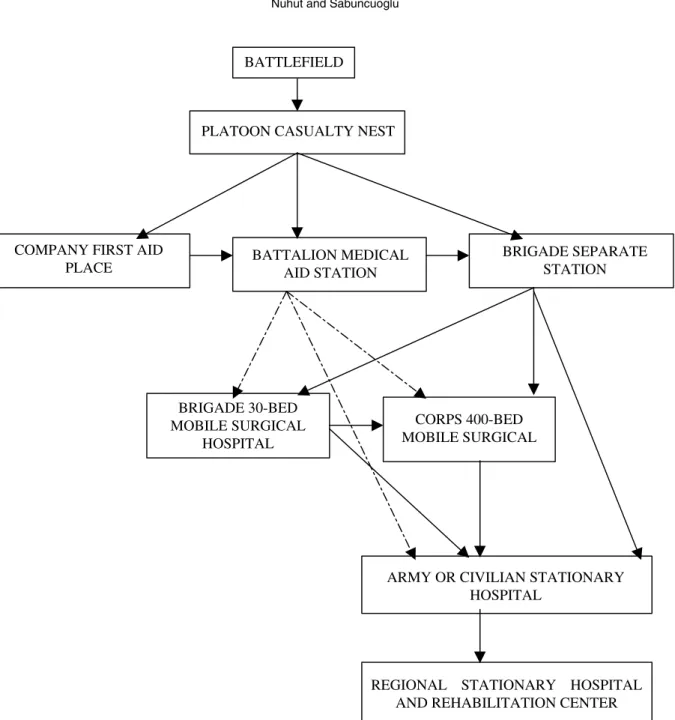
There are five levels in the HSS system: (1) the unit level, which involves the platoon casualty nest, company first aid place, and battalion medical aid station; (2) the brigade level, which involves a brigade separate station and 30-bed surgical hospital; (3) the corps level, which involves the corps stationary hospital; (4) the army level, which involves the army hospital; and (5) the rehabilitation center (a flowchart model or representation of the system is given in Fig. 1).
3.3.1 Level 1 (Unit Level)
Platoon Casualty Nest. The mission of the platoon ca-sualty nest is to satisfy first aid to the casualties, stabilize them for further evacuation, and prioritize at the conflict area.
Company First Aid Place. The mission of the com-pany first aid place is to make more serious treatment than the combat lifesaver and to make patients ready for further evacuation to the battalion medical aid station. The non-commissioned officer (NCO) of the company is responsi-ble for the company first aid place and directs and assists with the transportation of casualties to the company’s casu-alty collection point (CCP). Patients not requiring a higher level of care are returned to duty, the dead are sent to the dead collection point, and others are sent to the battalion medical aid station.
Battalion Medical Aid Station. This is the first place that has a professional doctor. Its mission is to receive the incoming patients; clean those who are affected from nu-clear, biological, and chemical (NBC) weapons; and triage and stabilize patients by making the first medical treat-ment. If the patient can be treated here, he is sent to duty; otherwise, he is sent to the brigade separate station. There is no ward (bedroom) providing preoperative and
postop-erative acute nursing care. The patients should be sent to a brigade separate station in 1 to 6 hours.
3.3.2 Level 2 (Brigade Level)
Brigade Separate Station. The mission of the brigade separate station is to provide early emergency hospitaliza-tion for patients who are unable to tolerate and survive movement over long distances and who require resuscita-tive surgical care. It also provides medical treatment for sick patients and stabilizes them for further evacuation to either the combat zone or one of the higher level hospitals. It will be deployed as close as tactically feasible, preferably the brigade forward area. A patient can be held in the ward for a maximum of 3 days. If the patient can be treated, he is sent to duty. If he cannot be treated and needs medical treatment, he is sent to the army or civilian hospital. When there is a need for physical therapy, he is sent to the corps hospital. If the patient needs surgical operation, he is sent to either the 30-bed hospital or the corps hospital.
Brigade 30-Bed Surgical Hospital. The mission of the brigade 30-bed hospital is to provide hospitalization for pa-tients who require surgical care to make final treatment for further evacuation to the combat zone or to stabilize them for further evacuation to one of the higher level hospitals. It will be deployed as far forward as tactically feasible, preferably the brigade rear area. A patient can be held in the ward for a maximum of 3 days. If the patient is treated, he is sent to duty. If the patient’s treatment requires more than 3 days of medical treatment, he is sent to the army or civilian hospital. If the patient needs surgical operation (or if the 30-bed hospital cannot do a successful operation), he is sent to the corps hospital.
3.3.3 Level 3 (Corps Level)
Corps Hospital. The main mission of the corps hospital is to provide surgical, physiological, and general treatment to the corps battle area. A patient can be held for a maxi-mum of 7 days. If the patient is treated, he is sent to duty; otherwise, he is sent to either the army hospital or the civil-ian hospital. The majority of patients within this facility are in the rehabilitative category.
3.3.4 Level 4 (Army Level)
Army Hospital. The army hospital provides surgical, physiological, and general treatment to the army battle-field. A patient can be held for a maximum of 10 days. If the patient is treated, he is sent to duty; otherwise, he is sent to the regional stationary hospital or the rehabilitation center. The majority of patients within this facility are in the rehabilitative category. As patients are evacuated to the rear, treatment is more definitive. For the majority of pa-tients, definitive treatment constitutes all that is needed for them to return to full duty.
Civilian Hospitals. Civilian hospitals provide surgical, physiological, and general treatment to the corps or army
BATTLEFIELD
PLATOON CASUALTY NEST
COMPANY FIRST AID
PLACE BATTALION MEDICALAID STATION
BRIGADE SEPARATE STATION BRIGADE 30-BED MOBILE SURGICAL HOSPITAL CORPS 400-BED MOBILE SURGICAL
ARMY OR CIVILIAN STATIONARY HOSPITAL
REGIONAL STATIONARY HOSPITAL AND REHABILITATION CENTER
Figure 1. Flowchart model of the system. Solid arrows are current casualty movements. Bold dashed arrows are proposed additions. Soldiers may be returned to duty from any entity
battlefield in addition to their own responsibilities. They are located near a corps headquarters or an army head-quarters. A patient can be held for 7 to 10 days. If the patient is treated, he is sent to duty; otherwise, he is sent to the regional stationary hospital or rehabilitation center.
3.3.5 Level 5 (Rehabilitation Center)
Rehabilitation Center. The rehabilitation center pro-vides definitive treatment to the patients. A patient is held
until he is recovered without time limitations. The follow-ing two care methods are conducted at this level:
1. Convalescent care: During this phase in a patient’s recovery, medical supervision is still needed, but the patient’s condition does not require the frequent or close monitoring characteristic of the acute stage. 2. Rehabilitative care: Rehabilitation is part of the
definitive and convalescent phases of care. Prevent-ing and minimizPrevent-ing the loss of physical or psycho-logical function for patients capable of being RTD are the primary goals.
3.4 The Proposed System
The purpose of developing a new system is to provide bet-ter service for casualty evacuation by decreasing the time in queue, decreasing the number of patients waiting in queue, and increasing the speed of the flow of patients in an army health care system. The basic difference in the proposed system is at the battalion level. At this level, if the patient does not recover, it is the doctor’s responsibility to send the patient to the brigade separate station, brigade 30-bed sur-gical hospital, corps hospital, army stationary hospital, or civilian hospital. In the existing system, the patient can be sent only to the brigade separate station from the battalion medical aid station.
In the new system, if the patient does not recover at the 30-bed surgical hospital, he can be sent to the corps hospi-tal, civilian hospihospi-tal, or army stationary hospital. Similarly, if the patient’s recovery cannot be achieved at the corps hospital, he can be sent to either the civilian hospital or the army stationary hospital. Finally, if the patient does not recover at the civilian hospital or the army hospital, he can be sent to the rehabilitation center. The properties of these health units and centers (number of doctors, number of beds, etc.) are as in the existing system. The changes in the existing system are marked with dashed lines in Figure 1. 4. Simulation Model
4.1 Models, Assumptions, and Output Data Analysis The simulation model is developed using ARENA 3.0 Sim-ulation Software Package [18]. The resulting model is run using standard PCs. According to simulation terminology, the system under consideration is a terminating system, with the termination event (E) specifying the length of each run. The goal of this simulation is to determine the final casualty numbers according to their types, treatment times, system times of medical treatment facilities, and medical persons when the battle ends. In this case,E = {either the blue force or the red force has “won” the bat-tle} [19]. The model is run for 10 days (14,400 minutes). Our pilot runs on the selected measures, such as time in brigade, indicate that a sample size of 10 replications is enough to achieve the absolute precision of 20 minutes. As explained below, we compare five alternative systems using the ranking and selection procedure [19], and we take 20 replications for the first stage and 30 replications for the second stage of the procedure in approximately 3 hours. The 10-day period can be viewed as a “short-term period” in operation planning. However, developments in weapon, communication, and transportation technology force wars
to end in a short period. The huge economic damage of war also forces countries to avoid making a long-term war. Thus, the countries want to finish the war in a few days. As a result of this, the army recommends a short-term period as 10 days.
In this study, we create five simulation models (two of them are the existing system and the new proposed sys-tem) for the comparison of five alternatives. The first alter-native is the existing system (Alteralter-native 1). The second alternative is the proposed system (called revised policy or Alternative 2). The basic difference between these two systems is that the patients can be sent from a battalion medical aid station to all the higher level medical facilities in the proposed system, whereas the patient must be sent to a brigade separate station after the battalion medical aid station in the existing system. The third alternative (Alter-native 3) is the existing system with some additional beds. In this system, based on pilot runs and discussions with experts in the HSS, the number of beds of the separate sta-tion’s medical treatment section is increased from 9 to 30, the number of beds of the separate station’s therapy unit is increased from 9 to 10, and number of beds of the separate station’s surgery section is increased from 12 to 60. The fourth alternative (Alternative 4) is the existing system with additional doctors such that the number of doctors in the separate station’s medical treatment unit is increased from 1 to 2. The fifth alternative (Alternative 5) is formed from the revised policy with additional beds. Specifically, the number of beds of the separate station’s medical treatment section is increased from 9 to 15, the number of beds of the separate station’s therapy section is increased from 9 to 10, and the number of beds of the separate station’s surgery section is increased from 12 to 35. All these changes are made as a result of pilot simulation pilot runs conducted in the experimental stages.
During the output data analysis, we use the ranking and selection procedure discussed in Law and Kelton [19]. Ac-cording to this procedure, we run the simulation model of each alternative system with 20 replications for about 12 minutes’ run length at Stage 1 and 10 more replications for about 18 minutes’ run length at Stage 2. We create six scenarios to see the behavior of the system under in-creased arrival rates, as well as six scenarios to solve the problems that are observed after analyzing the first six sce-narios. We run the simulation model of each scenario for 10 replications of about 12 minutes’ run length. The average run length is approximately 6 hours in total. The proposed simulation model consists of the following elements.
Events. In the model, the events are transporting pa-tients to medical units; registering, examining, and triag-ing patients; sendtriag-ing patients to higher level medical units; or sending patients to duty and making the final treatment. In addition, some laboratory testing is carried out in some medical units.
Facilities on Resources. The following are provided: buddy, aid-men in platoon casualty nest, specialist in com-pany first aid place, registry personnel, NBC weapon
cleaning specialist and doctor in battalion medical aid sta-tion, registry personnel, NBC cleaning specialist, surgery, physiological therapist and doctor in brigade separate sta-tion, registry personnel, laboratory expert and X-ray oper-ator in brigade 30-bed surgical hospital, doctor in 600-bed corps hospital, doctor in army hospital, doctor in civilian hospital, doctor in rehabilitation center, wards, litter team, ambulance, and helicopter.
Exogenous (Input) Variables. Exogenous variables in-clude the following: transportation time, time in wards, and the number of litter teams, ambulances, helicopters, aid-men, specialists, doctors, surgeries, therapists, labora-tory experts, NBC cleaning specialists, and registry person-nel. In addition, service time of the following is included: doctors and other medic personnel, surgeries, therapists, laboratory experts, registry personnel, and NBC cleaning specialists.
Endogenous (Output) Variables. Endogenous vari-ables include number of patients, examination time of each patient, doctor utilization, and idle time processing the lab-oratory registry on each patient.
State Variables. These constitute the state of the fol-lowing: doctor and other medical personnel (busy or idle), the laboratory, the NBC cleaning center, the litter team, the ambulance and helicopter, the X-ray operator, the registry personnel, and the ward. The number of patients waiting for treatment and waiting for beds is also included.
Performance Measures. Performance measures in-clude utilization of the following: doctors and other med-ical personnel, surgery, therapists, registry, laboratory ex-pert, X-ray operator, NBC cleaning operator, litter team, ambulances, and beds. These measures also include treat-ment time, time in system, time in queue, number of pa-tients, and number of patients in queue.
Some critical performance measures are the following: 1. Time in brigade separate station’s surgery unit: This time begins when the patient arrives at the brigade separate station’s surgery unit and ends when the soldier leaves this section’s ward.
2. Time in queue for surgery unit’s bed of the brigade separate station: This time begins when the patient arrives at the bed queue and ends when he enters the bed.
3. Time in system of brigade 30-bed hospital: This time begins when the soldier is injured and ends when the soldier leaves this hospital.
4.2 Data Collection and Input Data Analysis
The input data used in the simulation model are the num-ber of patients of illness categories; interarrival time of pa-tients; number of patients entering the system; number of patients returning to duty; number of patients dying; num-ber of patients undergoing treatment in the system; service
times of the registry personnel, laboratory, NBC cleaning operator, X-ray operator, doctor, therapist, and surgery; and casualty evacuation principle (maximum period that a pa-tient can stay in a medical treatment facility). In this study, we have had some difficulties in obtaining data sets be-cause the subject of the study belongs to the army, and the rules forbid us to obtain some of the data sets. Hence, the input data analysis is sometimes carried out by consulting with experts in this field and researching books that contain data from previous wars (e.g., World War II, Korean War, and Vietnam War). Specifically, we asked the most likely, minimum, and maximum values for treatment times and fit either triangular distributions or uniform distributions to random variables, as suggested by Law and Kelton [19]. 4.3 Model Verification and Validation
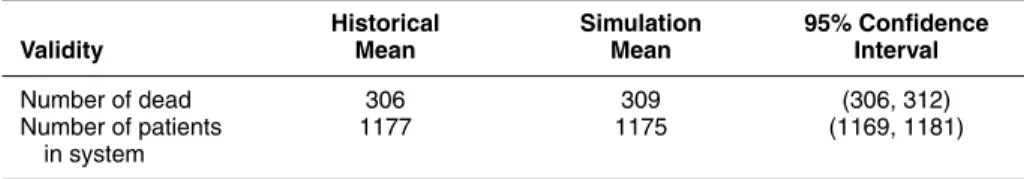
We employed the standard verification checks. We first cre-ated the flowchart model of the system and followed the model logic for each action for each event type. Second, we examined the model output for reasonableness with histor-ical data. Finally, we had the model checked by researchers who are specialists in HSS and simulation studies. In terms of model validation, we applied face validity and showed the results to the commanders of medical units, the chief of health centers, the health service and support school, the commanders of all units, and two doctors from the health office who are knowledgeable about the real system being simulated. Then we carried out the statistical valida-tion. Specifically, we constructed confidence intervals on selected performance measures to see if these intervals con-tain the past historical mean performances (see Table 2). The results indicated that the mean value of historical data is within the 95% confidence interval. Thus, we conclude that the model is, for practical purposes, a valid represen-tation of the system.
5. Simulation Experiment and Analysis of Results
5.1 Comparison of the Existing and Proposed Systems
To compare these two systems, we use the following per-formance measures: time in the brigade separate station’s surgery unit, time in system of the 30-bed hospital, and time in queue for beds in the brigade separate station’s surgery unit. We construct a confidence interval (CI) for the difference between the mean performances of alter-native systems using the Welch approach [19]. When the confidence interval is zero, we conclude that the differ-ence between the systems is not statistically significant. Otherwise, we declare one of them as the better system de-pending on the sign of the mean difference. For example, we test the following hypothesis for the brigade separate station:
Table 2. Data set of input validity, output validity, and validity of number of patients staying in the system
Historical Simulation 95% Confidence
Validity Mean Mean Interval
Number of dead 306 309 (306, 312)
Number of patients 1177 1175 (1169, 1181)
in system
where µx is the actual time-in-surgery section of the brigade separate station of the existing system, andµy is the actual time-in-surgery section of the brigade separate station of the proposed system. As seen below, the result-ing CI is to the right of zero (see Table 3). This means that the proposed system is better than the existing system since the difference is positive.
1932,31 2024,29
0 µx – µy
The tests are repeated for each measure, and the results are summarized in Table 3. For all of these performance measures, we reject the hypothesis since the confidence interval for µx − µy is totally to the right of zero, and there is strong evidence thatµx− µy > 0, or µx > µy. This means that the new system is better than the existing system.
When the results are analyzed in detail, we note that patients are treated in the new system’s surgery section approximately 33 hours ((1932 + 2024)/2)/60) earlier than in the existing system. Moreover, soldiers are treated in the 30-bed hospital of the new system in approximately 89 hours ((5184 + 5542)/2)/60) or 3.7 days earlier than the existing system after they are injured in the battle area. The results also indicate that the new system is better than the existing system in terms of waiting time in queues for beds in the brigade separate station’s surgery unit. Specifically, time in queues for beds in the brigade separate station’s surgery unit is 39 hours less in the new system than in the existing system. Since these differences are statistically significant, the new system should be preferred over the existing system.
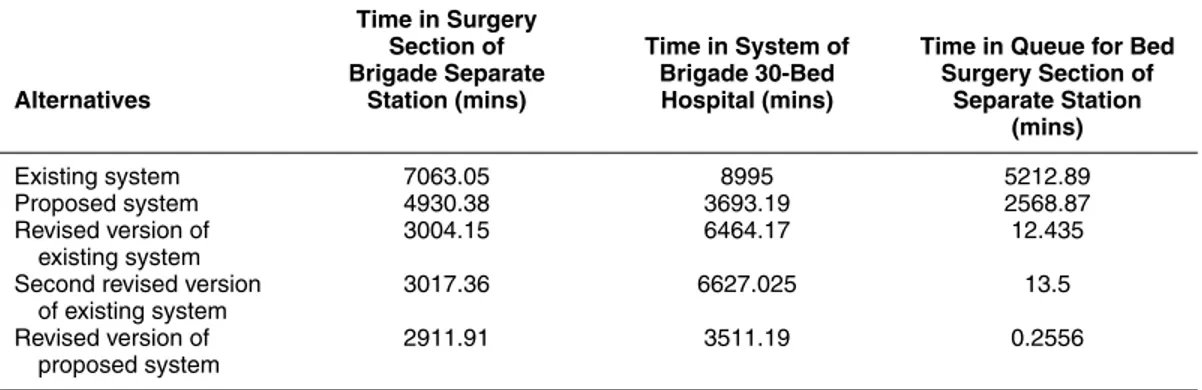
5.2 Other Alternative Systems and Further Analysis In this section, we compare five system design alternatives using three performance measures: time in the brigade sep-arate station’s surgery unit, time in system of the brigade 30-bed hospital, and time in queue for beds in the brigade separate station’s surgery unit. We determine the best of these five alternatives by using Dudewicz and Dalal’s [20]
“two-stage” procedure. The results of simulation experi-ments are summarized in Table 4.
In general, Alternative 5 is the best system design with respect to all system performance measures. Specifically, among all alternatives, it yields a minimum treatment time in the surgery section of the separate station. When patients enter the brigade separate station’s surgery section, they are treated in 48 hours, or 2 days involving posttreatment time in the ward, and they are then sent to duty or to one of the higher level health centers. Again, Alternative 5 also has the smallest time in system of the brigade 30-bed hospital. In this system, the soldiers can be treated in the 30-bed hospital in approximately 58 hours, or 2.4 days involving posttreatment time in the ward, and then they are sent to duty or to one of the higher level health centers. Finally, Alternative 5 also has the shortest time in queue for beds in the surgery section: a patient waits in queue less than 1 minute for a bed. In other words, when the patient leaves the surgery desk, he will be in one of the ward’s beds in less than 1 minute. Practically, it means that he does not wait in the bed queue. We expect him to be treated in a minimum of 1 day, most likely in 2 days, and a maximum of 3 days. In conclusion, we select Alternative 5 as the best system design. Note that the existing system is the worst among all alternatives.
5.3 Sensitivity Analysis: Testing the Systems under Heavy Demands
In this section, we test the performance of the alternative systems under increased arrival rates (or heavy demand). In other words, we test the sensitivity of our previous results to the more severe war conditions. We create three sce-narios from the existing system and three scesce-narios from the proposed system. The scenarios of the existing system are as follows: the first scenario is the existing system with regular demand (Scenario 1). The second scenario is the ex-isting system with a doubled arrival rate (Scenario 2). The third scenario is the existing system with a tripled arrival rate (Scenario 3). The scenarios of the proposed system are as follows: the first scenario is the proposed system with regular demand (Scenario 4). The second scenario is the proposed system with a doubled arrival rate (Scenario 5). The third scenario is the proposed system with a tripled arrival rate (Scenario 6). All these scenarios are presented in Table 5. Again, we run the simulation model of each
Table 3. The summary of comparing the existing and proposed systems (in minutes)
Performance 95% Confidence
Measure Differences Interval
Time in surgery section of brigade separate station (1932, 2024)
Time in system of brigade 30-bed hospital (5184, 5542)
Waiting time in queue for beds in brigade separate station (2267, 2434)
Table 4. Summary of generating alternatives and comparisons Time in Surgery
Section of Time in System of Time in Queue for Bed Brigade Separate Brigade 30-Bed Surgery Section of Alternatives Station (mins) Hospital (mins) Separate Station
(mins)
Existing system 7063.05 8995 5212.89
Proposed system 4930.38 3693.19 2568.87
Revised version of 3004.15 6464.17 12.435
existing system
Second revised version 3017.36 6627.025 13.5
of existing system
Revised version of 2911.91 3511.19 0.2556
proposed system
scenario for 10 replications and determine the bottlenecks (or problem areas) in each scenario. Finally, we made graphical comparisons of the scenarios for each perfor-mance measure.
To analyze the simulation results, we classify critical measures in three groups. The first group (Group 1) is time in queue of the first battalion’s doctor and time in queue of the second battalion’s doctor. The second group (Group 2) is time in queue for beds in the separate station’s med-ical treatment unit, time in queue for beds in the separate station’s psychotherapy unit, time in queue for beds in the separate station’s surgery unit, and time in queue for beds in the 30-bed hospital’s emergency surgery unit and normal surgery unit. The third group (Group 3) is time in queue for the operator of the 30-bed hospital’s normal surgery unit and emergency surgery unit.
5.3.1 Group 1 (Time in Queue for First Battalion’s Doctor)
When the arrival rate is doubled, we do not see any seri-ous problem with the first battalion. The average waiting time of Scenario 1 is 11 minutes, and the average waiting time of Scenario 2 is 15 minutes. This result also indicates that there is no significant difference between the first and second scenarios. But when the arrival rate is further in-creased (e.g., three times the original one), the average waiting time becomes 113 minutes (from 11 minutes), and the average number of patients in the queue becomes 11 (from 1 patient). This is about 10 times greater than the first two scenarios of the existing system (see Fig. 2).
As seen in Figure 2, the huge increase in waiting time can be reduced substantially by simply increasing the doc-tor capacity from one to two. Note that after the capacity expansion, the average time in queue for the first battalion’s doctor was reduced to a reasonable level (2 minutes). The average number of patient waiting is almost zero. Thus, a drastic increase in demand can be fixed quickly by adding a new doctor to the system.
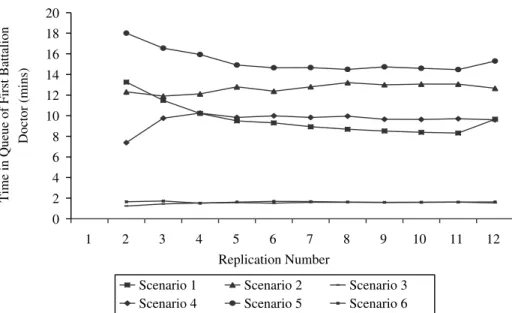
When the simulation experiments are repeated for the proposed system, we obtain the results in Figure 3. The time in queue for the first battalion’s doctor is 11, 13, and 171 minutes for Scenarios 4, 5, and 6, respectively. The av-erage number of patients in queue in Scenario 4 is almost zero. It is 1 and 17 for Scenarios 5 and 6, respectively. The time in queue is about 60 minutes greater than the exist-ing system. Increasexist-ing the doctor capacity from one to two can reduce this significant increase in waiting time in the proposed system (e.g., Scenario 6). After the modification is implemented, the average time in queue for the first bat-talion’s doctor drops to 2 minutes. Moreover, the average number of patients waiting in queue is almost zero.
In summary, the simulation results indicate that by in-creasing doctor capacity, we can compensate for the neg-ative impact of the excessive load in more severe war conditions.
5.3.2 Group 2 (Time in Queue for Beds in the Brigade Separate Station’s Surgery Unit)
When the arrival rate is increased by two times, the aver-age waiting time increases about 3.1% (from 5232 to 5394
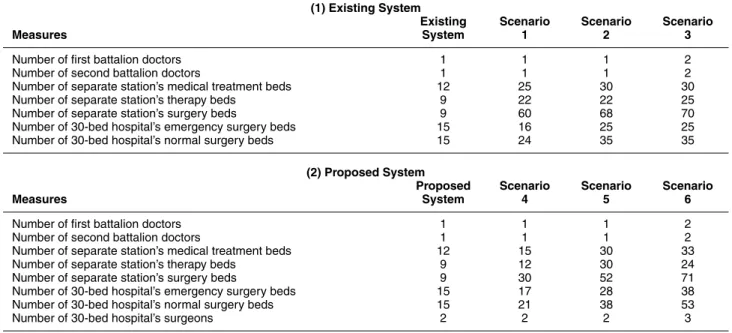
Table 5. Simulation results of each scenario that eliminates the bottlenecks (1) Existing System
Existing Scenario Scenario Scenario
Measures System 1 2 3
Number of first battalion doctors 1 1 1 2
Number of second battalion doctors 1 1 1 2
Number of separate station’s medical treatment beds 12 25 30 30
Number of separate station’s therapy beds 9 22 22 25
Number of separate station’s surgery beds 9 60 68 70
Number of 30-bed hospital’s emergency surgery beds 15 16 25 25
Number of 30-bed hospital’s normal surgery beds 15 24 35 35
(2) Proposed System
Proposed Scenario Scenario Scenario
Measures System 4 5 6
Number of first battalion doctors 1 1 1 2
Number of second battalion doctors 1 1 1 2
Number of separate station’s medical treatment beds 12 15 30 33
Number of separate station’s therapy beds 9 12 30 24
Number of separate station’s surgery beds 9 30 52 71
Number of 30-bed hospital’s emergency surgery beds 15 17 28 38
Number of 30-bed hospital’s normal surgery beds 15 21 38 53
Number of 30-bed hospital’s surgeons 2 2 2 3
0 50 100 150 200 250 1 2 3 4 5 6 7 8 9 10 11 Replication number
Time in Queue of First Battalion
Doctor (mins)
First Scenario Second Scenario Third Scenario Fourth Scenario Fifth Scenario Sixth Scenario Figure 2. Time in queue for the first battalion’s doctor
minutes), and the average number of patients in queue in-creases 25% (from 97 to 122). When the arrival rate is tripled, the average waiting time goes up 5.1% (from 5232 to 5502 minutes), and the average number of patients in queue increases 39% (from 97 to 135). This phenomenon is depicted in Figure 4.
In the proposed system, the average waiting time in-creases dramatically from 2881 to 4386 minutes (52%),
and the average number of patients in queue increases 187.5% (from 24 to 69). When the arrival rate is tripled, the increase in the average waiting time is 74% (from 2881 to 5018 minutes), and the average number of patients in queue increases 358% (from 24 to 110).
Generally speaking, in both the existing and the pro-posed systems, average waiting times are too high, and the army cannot tolerate 3.6, 3.74, 3.8, 2, 3, and 3.5 days
0 2 4 6 8 10 12 14 16 18 20 1 2 3 4 5 6 7 8 9 10 11 12 Replication Number
Time in Queue of First Battalion
Doctor (mins)
Scenario 1 Scenario 2 Scenario 3
Scenario 4 Scenario 5 Scenario 6
Figure 3. Time in queue for the first battalion’s doctor
0 1000 2000 3000 4000 5000 6000 1 2 3 4 5 6 7 8 9 10 11 Number of Replication Time in Queue for Bed of Brigade Separate Station
Surgery Unit (mins)
Scenario 1 Scenario 2 Scenario 3
Scenario 4 Scenario 5 Scenario 6
Figure 4. Time in queue for beds in the brigade separate station’s surgery unit
waiting in the bed queue. To reduce these excessive waiting times, we propose increasing the number of beds from 9 to 60, 9 to 68, 9 to 70, 9 to 30, 9 to 52, and 9 to 71 for Scenarios 1, 2, 3, 4, 5, and 6, respectively. After these modifications, we observe that the average waiting time in queue for beds in the separate station’s surgery unit reduces to reasonable levels such as 13 minutes, 16 minutes, 12 minutes, 4 min-utes, 22 minmin-utes, and 2 minutes for Scenarios 1 through 6, respectively. Moreover, the average number of patients waiting in queue is now almost zero for all scenarios (see Fig. 5). This result also shows that a very small (and
inex-pensive) change in the system solves the entire problem. In our case, increasing the bed capacity in war conditions reduces the waiting times below their reasonable values.
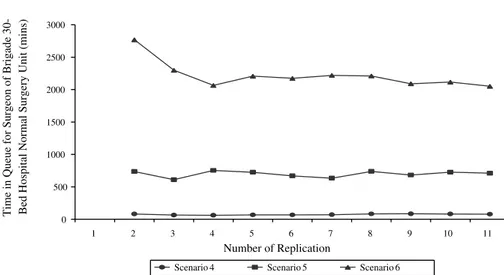
5.3.3 Group 3 (Time in Queue for the Operator of the 30-Bed Hospital’s Normal Surgical Operation Unit of the Proposed System)
Again, the system performance deteriorates significantly when the arrival rate (or load on the system) increases. Specifically, the average waiting time goes up about 843%
0 0 .2 0 .4 0 .6 0 .8 1 1 .2 0 . 402 Replication Number
Time in Queue for Bed of Brigade Separate
Station Surgery Unit (mins)
Scenario 1 Scenario 2 Scenario 3
Scenario 4 Scenario 5 Scenario 6
Figure 5. Time in queue for beds in the brigade separate station’s surgery unit
and 2898% when the rate is doubled and tripled, respec-tively (see Fig. 6). The number of patients in queue is also high (42). Since waiting times such as 2219 minutes are not tolerable, we propose increasing the number of surgeons from one to two and one to three for Scenarios 5 and 6, respectively.
After these modifications, we observe that the waiting time drops between 16 and 31 minutes. Moreover, the av-erage number of patients waiting in queue is now almost zero in this case. This result clearly shows that adding even one surgeon for Scenario 5 and two surgeons for Scenario 6 reduce the waiting time in queues for surgeons and the number of patients waiting in queues to their reasonable values (see Fig. 7).
6. Concluding Remarks and Future Research This study has been conducted to model and analyze the existing brigade casualty evacuation system and improve patient flow processes in the main facilities. The simulation model is developed to compare several new system designs and evaluate their impacts on a number of performance measures. The result of the simulation experiments can be summarized as follows:
1. The performance of the new (proposed) system is better than the existing system in terms of treatment time, time in system, and waiting time in the health unit’s queues. But this improvement is not quite sat-isfactory under severe war conditions, as created by the increased arrival rates. We also observe that there is no significant improvement by the proposed sys-tem (over the existing syssys-tem) at the battalion level.
2. The main problem of the existing system and the proposed system is a lack of beds.
3. When five alternative systems are compared, we ob-serve that the proposed system with more beds is the best among all alternative systems tested. In this alternative system design, the number of beds in the separate station’s medical treatment section increases from 9 to 15, the number of beds in the psychotherapy unit increases from 9 to 10, and the number of beds in the surgery unit increases from 12 to 35 (Alternative 5).
4. When the performances of alternative system de-signs are measured under the heavy demand (in-creased arrival rate), we observe that there is no significant difference between the first scenario (the existing system) and the second scenario (the exist-ing system with doubled arrival rate) or between the fourth scenario (the proposed new system) and the fifth scenario (the proposed new system with dou-bled arrival rate). We also observed that the system can cope with the increased demand if one can sim-ply increase the number of doctors in the first and second battalions, the number of beds in the sepa-rate station units and 30-bed hospital units, and the number of surgeons in the 30-bed hospital units of both the existing and proposed systems.
5. Under increasing arrival rate, the new system is also better than the existing system in terms of waiting time in queue, place demand for additional beds, and required number of beds. In general, the proposed new system requires fewer beds than the existing system.
0 500 1000 1500 2000 2500 3000 1 2 3 4 5 6 7 8 9 10 11 Number of Replication
Time in Queue for Surgeon of Brigade 30- Bed Hospital Normal Surgery Unit (mins)
Scenario 4 Scenario 5 Scenario 6
Figure 6. Time in queue for surgeons of the brigade 30-bed hospital surgery unit
0 5 10 15 20 25 1 2 3 4 5 6 7 8 9 10 11 Number of Replication
Time in Queue for Surgeon of Brigade
30-Bed Hospital Normal Surgery Unit
Scenario 4 Scenario 5 Scenario 6 Figure 7. Time in queue for surgeons of the brigade 30-bed hospital surgery unit
6. When we increase the number of doctors, beds, and surgeons, the proposed new system works well, without needing to change the system design. In this study, we observe that simulation is very use-ful OR methodology to understand the dynamic behavior of very complicated systems and propose new operating policies that may have strategic implications on military systems. These alternative systems are currently being con-sidered as a part of the new logistic system designed for the Turkish Army. Our research also indicates that the pro-posed simulation model can easily be modified to improve patient flow process as well as analyze other operations, such as casualty evacuation in assault operations, retro-grade operations, and other types of defense operations.
With some additional changes in the computer code, it can also be applied to the health system of armies during peaceful conditions. Even though the proposed solutions are low-cost alternatives, and the cost itself has a secondary importance in war conditions, a separate cost model (or models) may be needed to find least costly solutions. In this context, some of the input data to these cost models can be obtained from our simulation model.
7. References
[1] Headquarter Department of the Army. 1991. Health service and sup-port in theater of operations: Field manual. Washington, DC: Headquarter Department of the Army.
[2] Fetter, R. B., and S. D. Thompson. 1965. The simulation of hospital systems. Operations Research, September-October, 689-711. [3] Robinson, G. H., P. Wing, and L. E. Davis. 1968. Computer simulation
of hospital patient scheduling systems. Health Services Research 3:130-41.
[4] Savas, E. S. 1969. Simulation and cost effectiveness analysis of New York’s Emergency Ambulance Service. Management Sci-ence 15:B608-27.
[5] Seiler, B. D. 1971. A model for determining ambulance locations which minimize response time in urban areas. Unpublished M.S. thesis, Civil Engineering Department, West Virginia University, Morgantown.
[6] Baker, D. W. 1978. Location of single centralized EMS station in a predominantly rural areas. Unpublished M.S. thesis, Industrial Engineering Department, West Virginia University, Morgantown. [7] Iskander, W. H. 1989. Simulation modeling for Emergency Medical Service. Proceedings of the 1989 Winter Simulation Conference, Washington, DC, pp. 1107-11.
[8] Kumar, A. P., and R. Kapur. 1989. Discrete simulation application: Scheduling staff for the emergency room. Proceedings of the 1989 Winter Simulation Conference, Washington, DC, pp. 1112-20. [9] Lowery, J. C. 1992. Simulation of a hospital’s surgical suite and
criti-cal care area. Proceedings of the 1992 Winter Simulation Confer-ence, Arlington, VA, pp. 1071-78.
[10] Wears, R. L., and C. N. Winton. 1993. Simulation modelling of pre-hospital trauma care. Proceedings of the 1993 Winter Simulation Conference, Los Angeles, pp. 1216-24.
[11] McGuire, F. 1994. Using simulation to reduce length of stay in emer-gency departments. Proceedings of the 1994 Winter Simulation Conference, Orlando, FL, pp. 861-67.
[12] Sundstrom, S. C., C. G. Blood, and S. A. Matheny. 1996. The optimal placement of casualty evacuation assets: A linear programming model. San Diego: Naval Health Research Center.
[13] Lowery, J. C., and J. A. Davis. 1999. Determination of operating room requirements using simulation. Proceedings of the 1999 Winter Simulation Conference, Arizona, pp. 1568-72.
[14] Cahill, W., and M. Render. 1999. Dynamic simulation modelling of ICU bed availability. Proceedings of the 1999 Winter Simulation Conference, Arizona, pp. 1573-76.
[15] Sepúlveda, J. A., W. J. Thompson, F. F. Baesler, and M. I. Alvarez. 1999. The use of simulation for process improvement in a can-cer treatment center. Proceedings of the 1999 Winter Simulation Conference, Arizona, pp. 1541-48.
[16] Burks, R. E. 1997. Company casualty evacuation: Planning for suc-cess. Newsletter No. 97-14, Fort Irwin.
[17] Headquarter Department of the Army. 2000. Medical evacuation in
a theater of operations: Field manual. Washington, DC: Head-quarter Department of the Army.
[18] Kelton, W. D., R. P. Sadowski, and D. A. Sadowski. 1998. Simulation with Arena. New York: McGraw-Hill.
[19] Law, A. M., and W. D. Kelton. 2000. Simulation modelling and analysis. 3d ed. New York: McGraw-Hill.
[20] Dudewicz, E. J., and S. R. Dalal. 1975. Allocation of observations in ranking and selection with unequal variances. Sankhya: The Indian Journal of Statistics 37:28-78.
Özgür Nuhut is a military officer in the Turkish Army. Graduat-ing with a B.S. in management science from the Turkish Military Academy in 1990, he began his career as a field artillery officer. He has also received a certificate in system engineering from the Military Academy. His military experience spans command po-sitions as a line officer from platoon to company level. He is now a captain and a battery commander in a battalion of the Turk-ish Army. He received his M.S. degree in industrial engineering from Bilkent University, Turkey. His research interests include simulation and modelling of military systems.
Ihsan Sabuncuoglu is a professor of industrial engineering at Bilkent University. He received B.S. and M.S. degrees in indus-trial engineering from Middle East Technical University and a Ph.D. degree in industrial engineering from Wichita State Univer-sity. He teaches and conducts research in the areas of simulation, scheduling, and manufacturing systems. He has published papers in IIE Transactions, Simulation, Decision Sciences, International
Journal of Production Research, International Journal of Flexi-ble Manufacturing Systems, International Journal of Computer Integrated Manufacturing, Computers and Operations Research, European Journal of Operational Research, Production Planning and Control, Journal of Operational Research Society, and Com-puters and Industrial Engineering. He is on the Editorial Board
of the International Journal of Operations and Quantitative
Man-agement. He is an associate member of the Institute of Industrial
Engineering and the Institute for Operations Research and the Management Science.