Contents lists available at ScienceDirect
International Review of Financial Analysis
journal homepage: www.elsevier.com/locate/irfaThe financial market effects of international aviation disasters
Erdinc Akyildirim
a, Shaen Corbet
b,c,⁎, Marina Efthymiou
b, Cathal Guiomard
b, John F. O'Connell
d,
Ahmet Sensoy
ea Department of Banking and Finance, University of Zurich, Zurich, Switzerland b DCU Business School, Dublin City University, Dublin 9, Ireland
c School of Accounting, Finance and Economics, University of Waikato, New Zealand
d Centre of Aviation Research, School of Hospitality and Tourism Management, University of Surrey, UK e Bilkent University, Faculty of Business Administration, Ankara 06800, Turkey
A R T I C L E I N F O Keywords: Airline disaster Contagion Volatility Reputation risk Financial markets A B S T R A C T
The spread of misinformation with regards to aviation disasters continues to be a point of concern for aviation companies. Much of this information usually surrounds speculation based on the cause and responsibility at-tributed to the incident, implicitly possessing the potential to generate significant financial market price vola-tility. In this paper, we investigate a number of stylised facts relating to the effects of airline disasters on aviation stocks, while considering contagion effects, information flows and the sources of price discovery within the broad sector. Results indicate a substantially elevated levels of share price volatility in the aftermath of aviation disasters, while cumulative abnormal returns present sharp under-performance of the analysed companies re-lative to international exchanges. When considering an EGARCH analysis, we observe that share price volatility appears to be significantly influenced by the scale of the disaster in terms of the fatalities generated. Significant contagion effects upon the broad aviation index along with substantial changes in traditional price discovery channels are also identified. The role that the spread of information on social media, whether it be correct or of malicious origins, cannot be eliminated as an explanatory factor of these changing dynamics over time and region.
1. Introduction
The aviation sector has been exposed to a number of quite unique threats in recent years, while further experiencing some exceptionally rare events that few other industries must contest. The sector has been directly exposed to elevated threats of terrorism, with the most devas-tating events occurring in the United States in 2001 (Kim & Gu, 2004), resulting in widespread industrial reform and increased running costs. However, some incidents have been mostly as a result of exception unfortunate circumstance. For example, one of the most rare events involved that of Malaysia Airlines, who during an unprecedented turn of events, lost two commercial airliners within five months in 2014, leading to the subsequent nationalisation of the company so that gov-ernment could protect both the Malaysian tourism industry and attempt to ensure the employment of almost twenty thousand employees that relied on the company's survival. Kaplanski and Levy (2010) found that in the aftermath of a significant negative event effect with an average market loss of more than $60 billion per aviation disaster, whereas the estimated actual loss is no more than $1 billion, where within two days
after the event, a price reversal occurs. Understanding the dynamics of financial market behaviour and the manner in which investors perceive such risk is of the utmost importance for companies who have been unfortunate enough to experience such disasters. What is already con-sidered to be deeply competitive industry generates substantial pres-sures on aviation companies with little scope allowed for error. Such pressures can manifest in exceptional industrial and managerial pres-sures to perform in line with industry expectations.
Although airline accidents are infrequent, they can have significant effects on an airline's stock price and profitability (Borenstein & Zimmerman, 1988; Li, Phun, Suzuki, & Yai, 2015). Chance and Ferris (1987) found that the financial impact of an aviation disaster is focused solely on the carrier, while the industry as a whole is not affected. Noronha and Singal (2004) investigated 783 accidents/incidents of US domiciled airlines and found that only about 2–3% were serious enough to cause financial pain. They also concluded that the investment bond credit rating would change by a whole ‘letter’ change, for example from AAA to AA+ as a result of this serious accident. Both Borenstein and Zimmerman (1988) together with Mitchell and Maloney (1989)
https://doi.org/10.1016/j.irfa.2020.101468
Received 28 October 2019; Received in revised form 17 February 2020; Accepted 24 February 2020
⁎Corresponding author at: DCU Business School, Dublin City University, Dublin 9, Ireland.
E-mail address: [email protected] (S. Corbet).
International Review of Financial Analysis 69 (2020) 101468
Available online 27 February 2020
1057-5219/ © 2020 The Authors. Published by Elsevier Inc. This is an open access article under the CC BY license (http://creativecommons.org/licenses/BY/4.0/).
analysed changes in equity value following accidents and found evi-dence that airlines which experienced fatal accidents were subsequently penalised by modest profitability declines. Ho, Qiu, and Tang (2013) examined the impact of aviation tragedies on the stock prices of the airlines that had encountered a crash together with their rival carriers and found that the afflicted airline experienced deeper negative ab-normal returns as the degree of fatality increases. However, stock prices of the rival airlines also suffer in large-scale disasters but benefit somewhat from the disasters when the fatality is minor. Walker, Thiengtham, and Lin (2005) employed a sample of 138 aviation dis-asters involving aircraft operated by publicly traded US carriers be-tween July 1962 and December 2003. The authors observed that air-lines experience an average stock price drop of 2.8% within one trading day after the corresponding news announcement, while aircraft man-ufacturers experienced a stock price drop of only 0.8% during that time period. Similarly, Barrett, Heuson, Kolb, and Schropp (1987) concur by calculating that the average market decline for airline stock prices within a day of the crash is approximately 1.5%. The magnitude of the initial price decline appears to be driven by various characteristics of both the firm and the accident itself. It is important to note that some research has pointed to sectoral financial difficulty, such as that of Assaf (2009) who identified through a technical model that US airlines are operating at a declining efficiency rate with an average of 69.02% in 2007, with results from returns to scale also echoing efficiency results. Lee and Jang (2007) found that through an analysis of 16 airline companies for the period of 1997–2002, profitability, growth and safety are negatively associated with the systematic risk, while the debt leverage and firm size are positively related to the risk. This risk has been exacerbated somewhat by substantial increases in competition over time (Francis, Dennis, Ison, & Humphreys, 2007).
Research relating to aviation disasters has a number of relevant policy implications. Market sensitivity to such sudden, catastrophic shocks could be deeply exacerbated by the role of social media and the spread of misinformation, or malicious information in the aftermath of such events. Much of the spread of such information usually surrounds speculation based on the cause and responsibility attributed to the in-cident. While we must consider that financial markets in recent years are guided by a more rapid dissemination of information through the development of social media which could be perceived to be of better quality through the ease through which pictures and videos are shared through which observers can make their own opinion, it should also be considered that the presence of such improved efficiency could in fact manifest in side-effects such as an ability to profit from the spread of false information, not only generating further undue distress on the companies and families involved in such tragedy, but also hindering the efforts of rescue teams while further inspiring other market participants who do not fear current regulatory and policing efforts.
In this paper, we investigate as to whether a number of stylised facts relating to the effects of airline disasters on aviation stocks and con-tagion effects within the broad sector hold. First, we analyse as to whether there exist time-varying and geographical differences in the response mechanisms of investors to aviation disasters, or indeed, has there been a variation of response that could be considered to be cor-related to the level of injury and fatality caused by each individual incident. Further, we generate further novelty through the inclusion of analysis that focused on the interlinkages between the incident com-panies and the broad aviation sector. Finally, we investigate changes in flow of information and price discovery that could be considered to be abnormal when considering pre-disaster averages between the stock price of incident companies and broad aviation indices that represent sectoral returns.
We first clearly identify that substantially elevated levels of share price volatility, however, there is evidence to suggest that this volatility has somewhat decreased in the periods 2005 through 2019. Such effects are found to be substantial when considering geographical differentials, with both North American and South American companies exhibiting
the largest negative effects. When analysing cumulative abnormal re-turns (CARs), we observe that there exists sharp under-performance of the companies relative to international exchanges throughout each of the analysed time periods with the exception of the period between 2000 and 2004. When considering an EGARCH analysis to investigate specific volatility effects, we observe a sharp increase in unconditional volatility in the ten-day period after the aviation incident, indicative of strong short-term effects. However, while the shock to unconditional volatility appears to be immediate, there is evidence to suggest that it dissipates and returns to pre-aviation incident levels within sixty days after the event. Further, our results indicate that there exists a clear positive relationship between the two variables, indicating that the estimated EGARCH-volatility appears to be significantly influenced by the scale of the disaster in terms of the fatalities generated. When considering the contagion effects of volatility and the flow of in-formation and price discovery between the incident company and the broad aviation sector, we find that there were substantial decreased in dynamic conditional correlations during incidents that occurred in the periods 1995–99, 2000–04 and 2005–09 respectively. However,evidence of such pronounced effects do not appear to occur in the periods between 2010 and 14 and 2015–19. For every case analysed we find that there were substantial decreases in information flow identified between the interactions between both the airline and the aviation sector. This indicates that there is a permanent disruption to the flow of information and price discovery channels that would have traditional have existed in the period prior to the aviation disaster.
The rest of this paper is as follows. Section 2 presents a thorough review of the literature relating to the interlinkages between aviation disasters and the varying effects on financial markets and sectoral in-teractions. Section 3 presents a concise overview of the data used in this research along with the various methodologies employed to capture firm-level volatility, both intra-sectoral and geographic volatility transmission, and indeed contagion effects by type of aviation incident. Section 4 presents a concise overview of the results presented, while Section 5 concludes.
2. Previous literature
Although much research focuses specifically on the aviation sector in terms of structure and performance, little has focused specifically on the presence of sectoral interactions between rival and geographically- similar aviation companies. Research of such nature is of substantial value to the broad sectoral correlations that exist, enabling theoreti-cally-plausible avenues through which large aviation incidents could generate significant sector-wide risk. While this research sets out to investigate the existence of such channels as identified by stock market dynamics, it builds on a number of existing research areas. Chance and Ferris (1987) found that such incidents were, in the mid-1980s ring- fenced from the broad sector at large, however, much research today has begun to focus on the dissemination of news through multiple technological channels, leading to quite strong theoretical foundations to signal that such results might not exist almost three decades later. Ho et al. (2013) found that there do exist abnormal returns in competitor companies during major sectoral incidents, however, their share price is found to otherwise increase should the incident be considered minor. This research does not extend its scope beyond abnormal pricing, however, the sentiment of the results further indicate that the work of Chance and Ferris (1987) might not represent the industry today. Kaplanski and Levy (2010) analysed the influence of aviation disasters on stock prices while considering the role of sentiment. Should a market loss of more than US$60 million, the authors identify evidence of substantial negative stock market responses, increased perceived risk and implied volatility, despite no evidence of an increase in actual volatility. Such a result is, of course, not limited to the aviation sector. Carpentier and Suret (2015) found that such losses exist across a broad number of major accidents, however, they do not persist. Ho et al.
(2013) found that airlines that suffer a crash experience deeper nega-tive abnormal returns as the degree of fatality increases, but also, the stock prices of the rival airlines also suffer in large-scale disasters but benefit from the disasters when the fatality is minor. Hung and Liu (2005) use the beta value, an indicator of systematic risk, to estimate the costs of equity and the evaluation of a stock's reasonable price, to find that airline betas are volatile over time and that crashes also im-pact them in addition to their stock return and volatility.
Outside of just stock market performance in isolation, there might exist channels through which corporate effects can also be transferred to airlines companies. While legal liability, broad reputational damage and the loss of equipment can be found to explain a substantial amount of the target company's losses, guided by the work of Walker, Walker, Thiengtham, and Pukthuanthong (2014) found that there are a number of regulatory factors that extend far beyond insurance premiums and reputational damage. Dillon, Johnson, and Pate-Cornell (1999) identi-fied evidence to suggest that in the aftermath of a single aviation in-cident, shareholders appear to update their estimates of the probability
of a future incident, acting as an explanation for the substantial cu-mulative abnormal returns that exist. Exogenous events might also have such negative outcomes. For example, Corbet, O'Connell, Efthymiou, Guiomard, and Lucey (2019) found that traffic flows fall quite sharply despite significant fare reductions as a result of terrorist incidents in Europe. Such terrorism impacts were also found to be both significant and substantial when considering the persistence of their effects at both sectoral and national levels (Carter & Simkins, 2004; Corbet, Gurdgiev, & Meegan, 2018; Kim & Gu, 2004; Kolaric & Schiereck, 2016). Carvalho, Klagge, and Moench (2011) analysed the 2008 case where an six-year old article based on the bankruptcy of United Airline's parent company was mistakenly identified as a new bankruptcy filing, causing a 76% fall in the company's share price, but after the case was identified as an error, the stock remained over 11% below opening prices, as the authors identify that contagion effects would dominated competitive effects. Luo (2007) used longitudinal real-world data set that matches consumer negative voice (complaint records) in the airline industry with firm stock prices, this article finds that higher levels of current
Table 1
Summary statistics of analysed traded airlines.
DJIA WTI AVI Stob AFLT AEROMEX AC.TO AIRF.PA
Mean 0.0003 0.0002 0.0005 0.0000 0.0008 −0.0002 0.0002 −0.0002 Std. Dev. 0.0108 0.023 0.0115 0.0189 0.1047 0.0165 0.0353 0.0310 Minimum −0.0820 −0.1654 −0.0751 −0.1779 −5.4381 −0.1037 −0.3465 −0.3510 Median 0.0003 0.0000 0.0007 0.0000 0.0000 0.0000 0.0000 0.0000 Maximum 0.1051 0.1641 0.1028 0.1552 4.8675 0.2869 0.3983 0.5996 Skewness −0.1925 −0.0773 −0.1486 0.1031 −7.4295 2.71 −0.1579 0.6207 Kurtosis 11.4064 7.3101 9.1538 10.1885 2266.2442 52.7834 20.6945 40.2413 Jarque Bera 18,786.8*** 4934.8*** 10,069.8*** 8117.5*** 1,124,387,646.1*** 221,518.9*** 42,659.6*** 366,494.8*** ADF −84.1535*** −81.6929*** −71.6901*** −65.7135*** −72.1191*** −47.2714*** −50.5512*** −76.4258***
ALK 020560.KS BA 2610.TW 600,029.SS COMJ.J UAL.O DAL Mean 0.0004 0.0000 0.0000 −0.0002 0.0002 0.0001 0.0002 0.0003 Std. Dev. 0.0269 0.0287 0.0217 0.0209 0.0284 0.0339 0.0405 0.0328 Minimum −0.3364 −0.1713 −0.2384 −0.099 −0.1058 −0.2955 −0.4584 −0.2374 Median 0.0000 0.0000 0.0000 0.0000 0.0000 0.0000 0.0000 0.0000 Maximum 0.2722 0.2624 0.1568 0.1054 0.0963 0.3208 0.522 0.2355 Skewness −0.1714 0.422 −0.18 0.0842 −0.0537 0.0652 −0.0227 −0.1072 Kurtosis 14.1765 10.0078 11.1471 5.5098 5.8805 12.7829 25.6682 11.4603 Jarque Bera 33,170.1*** 10,522.7*** 17,643.2*** 1678.1*** 1431.2*** 21,701*** 74,529.4*** 9415.4*** ADF −82.9115*** −66.3049*** −76.1207*** −78.4393*** −58.9574*** −80.8645*** −54.9817*** −55.5217***
GIAA.JK KQNA.NR 003490.KS PIAa.KA SAS.ST SIAL.SL LUV THAI.BK Mean −0.0002 −0.0008 0.0001 −0.0001 −0.0006 0.0000 0.0004 −0.0003 Std. Dev. 0.023 0.0376 0.0312 0.0379 0.0313 0.0167 0.0223 0.0289 Minimum −0.1467 −1.8589 −0.1625 −0.3656 −0.3291 −0.1295 −0.2753 −0.2204 Median 0.0000 0.0000 0.0000 0.0000 0.0000 0.0000 0.0000 0.0000 Maximum 0.174 0.1209 0.2252 0.3733 0.2821 0.1437 0.1576 0.257 Skewness 1.0895 −27.1798 0.2564 0.7466 0.1416 0.1527 −0.3554 0.4672 Kurtosis 9.562 1301.0383 7.1936 12.2007 13.611 9.4477 10.6379 10.087 Jarque Bera 4310.7*** 328,851,069.6*** 4735.3*** 23,042*** 21,919.6*** 11,053.5*** 15,610.6*** 13,555.9*** ADF −48.0585*** −62.847*** −74.1804*** −80.6308*** −66.1177*** −83.2529*** −86.4308*** −79.9079***
THYAO.IS UTAR.MM MASM AIRA.KL LTM.SN LHAG.DE SEBF.PA SIAL.SI Mean 0.0009 0.0003 −0.0004 0.0002 0.0004 0.0001 0.0003 0.0000 Std. Dev. 0.0341 0.0421 0.025 0.0217 0.02 0.0212 0.0201 0.0167 Minimum −0.202 −0.7366 −0.5051 −0.1364 −0.1773 −0.1636 −0.1697 −0.1295 Median 0.0000 0.0000 0.0000 0.0000 0.0000 0.0000 0.0000 0.0000 Maximum 0.1796 1.772 0.2877 0.1281 0.1823 0.1571 0.1617 0.1437 Skewness 0.3318 15.4432 −0.7642 0.1939 0.351 −0.1347 0.1246 0.1527 Kurtosis 7.7116 709.5296 40.1085 7.1934 13.1096 6.9893 8.3459 9.4477 Jarque Bera 6006.1*** 99,381,603.3*** 365,937.4*** 2799.2*** 26,213.2*** 4241.3*** 7598.1*** 11,053.5*** ADF −78.8869*** −65.7303*** −81.0661*** −59.4133*** −66.4438*** −77.8715*** −80.2885*** −83.2529*** Note: We establish the above list noting that each company must be publicly traded with an available stock ticker between the period June 1, 1995 and May 31,2019. This specific time period is identified due to the relative absence of concise financial market in the period before. Stock price data is taken from Thomson Reuters Eikon.
consumer negative voice harm firms' future idiosyncratic stock returns. Since energy commodities play an important role for the airlines industry, their price fluctuations can also create problems for aviation stocks in financial markets. Treanor, Rogers, Carter, and Simkins (2014) found that airlines that increase their hedging activity due to higher fuel price exposure are not receive a premium in their valuation when compared to those airlines employing more stable hedging policies. However, Berghofer and Lucey (2014) found that there exists less sig-nificant negative exposure coefficients among US carriers. Yun and Yoon (2019) found that there is a return and volatility spillover effect between crude oil price and the stock prices of airlines and that the stock prices of smaller airlines of South Korea and China are relatively more sensitive to the change in oil price. Kristjanpoller and Concha (2016) found a strong positive influence of fuel price fluctuation and airline stock returns using GARCH-family methodologies.
3. Data and methodology
3.1. Data
We begin our analysis developing a concise list of aviation disasters
that can then be utilised in a thorough and robust methodological in-vestigation through an analysis of parent companies who trade on stock markets and their subsequent performance. Broad speculation based on the cause of such an airline disaster can manifest through many forms, but direct financial punishment due to investor perceptions can present a number of damaging side-effects for the broad aviation sector. To develop such a dataset, we develop a number of strict rules in an at-tempt to standardise the process across major international financial markets. The first implemented rule is that the specified company must be a publicly traded company with an available stock ticker between the period June 1, 1995 and May 31, 2019. This specific time period is identified due to the relative absence of concise financial market in the period before. Our selected stock price data is taken from Thomson Reuters Eikon. The second news selection rule is based on the source of the aviation disaster data. We develop on a combined search of LexisNexis, Bloomberg and Thomson Reuters Eikon, search for the keywords relating to aviation disasters. For added robustness of our developed dataset, we leverage upon that of the National Transportation Safety Board (available at: https://www.ntsb.gov), the International Civil Aviation Organization, ICAO (available at: https:// www.icao.int) and the Aviation Safety Reporting System (available at:
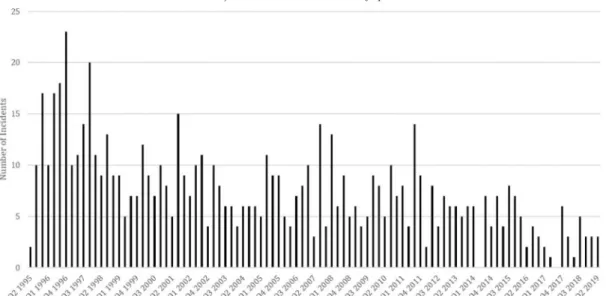
Fig. 1. Cumulative number of incidents and fatalities of traded airlines, by quarter, Q2 1995 through Q2 2019.
Note: The above figure presents the cumulative number of incidents that have taken place by quarter during the sample period analysed in the top panel. In the bottom panel, we find the estimates of the total number of fatalities by quarter analysed.
https://asrs.arc.nasa.gov).
To obtain a viable observation, a single result must be present across each of the selected search engines and the source was denoted as an international news agency, a mainstream domestic news agency or the company making the announcement itself. Forums, social media and bespoke news websites were omitted from the search. Finally, the se-lected observation is based solely on the confirmed news announce-ments being made on the same day across all of the selected sources. If a confirmed article or news release had a varying date of release, it was omitted due to this associated ambiguity. All observations found to be made on either a Saturday or Sunday are denoted as active on the following Monday morning. All times are adjusted to GMT, with the official end of day closing price treated as the listed observation for each comparable company when analysing associated contagion effects. In Table 1 we observe the relevant summary statistics for the included aviation companies that experienced severe aviation disasters
throughout the time period analysed.
In Fig. 1, we observe the cumulative number of incidents and fatalities that occurred on a quarterly basis between Q2 1995 and Q2 2019. There is evidence of a decline in both estimates, with peaks ex-perienced throughout the period between Q1 1996 and Q4 1996. In total, there are 610 incidents included in our analysis, of which there were 12,692 fatalities. The worst incidents include that of the crash of a Saudi Arabian Airlines Boeing 747–100 in New Delhi in November 1996, which led to the death of 312 people. Further, in the 11 Sep-tember terrorist attacks of 2001, the Airbus A300–600 that crashed in New York leading to the deaths of 262 persons is also included among the worst incidents included in the database. The second and fourth most severe incidents included unfortunately involve the same com-pany, Malaysia Airlines. In 2014, an idiosyncratic succession of acci-dents, unparalleled in aviation history unfolded within a five month time frame as two widebody aircraft operated by Malaysia Airlines
Fig. 2. Geographic dispersion of incidents as denoted by domicile country of traded company.
Note: The above figure presents the geographical dispersion and frequency of incidents as separated by the domicile country of the traded company. The lower panel presents the geographic dispersion of incidents as separated by crash site.
crashed under inconceivable circumstances. The first tragedy to strike Malaysia Airlines was the loss of flight MH370, which disappeared while flying from Kuala Lumpur International Airport to Beijing Capital International Airport on 8 March 2014 with the loss of 227 passengers and 12 crew. Inmarsat satellites identified two potential trajectories, that MH370 could have taken, but after much analysis the investigators speculated with a high degree of probability that the perilous aircraft was navigated along a southern trajectory, leading it deep into the southern Indian Ocean. After one of the most expensive searches in aviation history, the aircraft has not been found, however several pieces of debris washed ashore in the western Indian Ocean during 2015 and 2016 which were confirmed to be from the airliner. In the aftermath of the loss of MH370, Malaysia Airlines were then subjected to their second significant loss as MH17, a scheduled flight from Amsterdam to Kuala Lumpur that was shot down on 17 July 2014 while flying over eastern Ukraine, where an armed conflict broke out in April 2014. Flights over the conflict zone were allowed as there was no indication of risk for civil aeroplanes at cruising altitude and Malaysia Airlines, as almost all airlines, assumed that the airspace is safe. A Buk 9 M38-series surface-to-air missile with a 9N314M warhead was found to have downed the aircraft. An explosive decompression resulted in the dis-integration of the aircraft while in-flight and all 283 passengers to-gether with 15 crew members perished resulting in a wreckage area of 50 square km on the ground. The four most severe incidents in this sample account for 1111 fatalities in the sample. In Fig. 2 we identify
the geographic dispersion of first, incidents as denoted by the geo-graphic dispersion of the parent companies of the airlines that have experienced the aviation disaster. The second panel displays the geo-graphic dispersion of the analysed incidents within this research. It is of interest to note that a large number of African nations and countries such as Bangladesh, India, Nepal and Colombia have experienced a broad number of aviation disasters in their respective nations, however, there are few incidents recorded in our dataset that include airlines from these regions that are publicly traded.
3.2. Methodology
To further the development of our understanding of disasters within the aviation sector, we set out to first specifically analyse the immediate pricing and volatility effects on the stock prices of the company that owned the plane that has been lost. To add methodological robustness to our selected analysis, we have utilised a number of GARCH-family methodologies1 while we further attempt to mitigate international Fig. 3. Share price volatility response over time due to airline disasters (1995–2019).
Note: The above figure presents the estimated share price volatility response over time due to airline disasters. The results are separated by five year windows while presenting the average results for sixty days both before and after each incident for presentation purposes.
1The analysed specifications included EGARCH, GJR-GARCH, TGARCH,
Asymmetric Power ARCH (APARCH), Component GARCH (CGARCH) and the Asymmetric Component GARCH (ACGARCH), with the best selected metho-dology based on standard goodness-of-fit criteria such as the Akaike informa-tion criterion, Bayesian informainforma-tion criterion (BIC), Shibata Informainforma-tion
factors through the inclusion of the Dow Jones Industrial Average (DJIA), West Texas Intermediate oil prices (WTI) and the SPDR S&P Transportation ETF (XTN) which is found to best represent the per-formance of aviation companies during the period analysed. We further consider as to whether such volatility effect has changed in the period since the broad growth. In a secondary analysis, we then investigate the relationship between each company and the broad measure of the aviation index through the use of a DCC-GARCH analysis. It has been widely considered that some specific accidents have been large enough to generate substantial reverberations throughout the entire sector due to the presence of a number of technical and regulatory mishaps (Ho et al., 2013; Krieger & Chen, 2015; Nethercutt & Pruitt, 1997). Such dynamics could be attributed to the market expectations that future regulatory changes could be forthcoming and could even perhaps be restrictive to the future profitability of the sector. Finally, to validate and add further robustness to the presented results, we investigate the sources of price discovery in the relationship between the broad sec-toral indices and the companies that have experienced such substantial loss and reputational damage in an attempt to further analyse investor behaviour. We define a distressed airline company as that which has experienced a substantial tragedy in the form of the loss of a plane.
Overall, there are a number of specific questions that we then set out to analyse.
•
H1: Has the price response of distressed airline companies variedover time and by region in which the incident has occurred?
•
H2: Does the price volatility response of distressed airline companiesvary based on the scale of the disaster that they have experienced as measured by fatality and injury?
•
H3: Has the price volatility response of distressed airline companieschanged over time?
•
H4: Does there exist a substantial change in dynamic correlationbetween the distressed company and broad aviation indices in the periods after such disaster?
•
H5: Does there exist a substantial change in information flowsbe-tween the distressed company and broad aviation indices in the periods after such disaster?
The above hypotheses thereby set out to analyse multiple facets of financial market distress in the aftermath of such tragedy. The results of this paper are of interest to the broad aviation sector, traders, regulators and policy-makers alike. While it is not surprising to observe that dis-tressed aviation companies in such situations exhibit substantial and significant negative effects, it is very much of interest to further our understanding of the sources of such risk and indeed, as to whether it is contagious upon the entire aviation sector. Should there be evidence
Fig. 4. Share price volatility response by region due to airline disasters.
Note: The above figure presents the estimated share price volatility response by investigated region, while presenting the average results for sixty days both before and after each incident for presentation purposes.
(footnote continued)
Criterion and the Hannan-Quinn information criterion.
identified of a substantial link, this would develop potential fears about the broad financial safety of the sector and a strong potential for issues such as moral hazard and asymmetric information to develop as weaker, less regulatory compliant companies could potentially influ-ence the growth, development and financial viability of companies who are behaving in a regulatory-compliant manner.
To begin our analysis, we first utilise a multivariate EGARCH(p,q) methodology to identify scale of the change in volatility in the period after the identified aviation incidents. At this stage, a number of goodness-of-fit testing procedures identified the EGARCH(1,1) model as the best selected to identify specific volatility changes in the companies' returns, thus we exercise our analysis using this model.2 The EGARCH specification developed on that of the GARCH specification proposed by Bollerslev (1986) and was designed to include lagged conditional var-iance terms as autoregressive terms. We specifically develop on an EGARCH methodology to analyse the volatility effects within the aviation industry due to aviation disasters. We first let rt = [r1, t, …, rn,
t]′ be the vector of financial time series returns and εt = [ε1, t, …, εn, t]′ be the vector of return residuals obtained after some filtration. Let hi, t be the corresponding conditional volatilities obtained from a univariate EGARCH process. We assume that Et−1[εt]=0 and Et−1[εtεt′] = Ht, where Et[⋅] is the conditional expectation on εt, εt−1, …. Then the asset conditional covariance matrix Ht can be written as
=
Ht Dt1/2R Dt t1/2 (1)
where Rt = [ρij, t] is the asset conditional correlation matrix and the diagonal matrix of the asset conditional variances is given by
Dt = diag (h1, t, …, hn, t). We express the variance equation of our EGARCH model as follows:
= + + + +
h E h D
ln( )t2 t 1 ( t 1 ( t 1)) ln( t21) t (2) which states that the value of the variance scaling parameter ht now depends both on the past value of the shocks, which are captured by the lagged square residual terms, and on past values of itself, which are captured by the lagged ht terms. Specification tests found that the EGARCH(1,1) model served as the best fitting to estimate volatility effects through the use of dummy variables that are used to denote both the time-of-the-day and also periods of substantial traditional market volatility.3 It is also necessary to mitigate international effects which Fig. 5. Cumulative Abnormal Returns (CARs) over time due to airline disasters (1995–2019).
Note: The above figure presents the estimated Cumulative Abnormal Returns (CARs) response over time due to airline disasters. The results are separated by five year windows while presenting the average results for sixty days both before and after each incident for presentation purposes.
2EGARCH exploits information contained in realised measures of volatility
while providing a flexible leverage function that accounts for return-volatility dependence. While remaining in a GARCH-like modelling framework and es-timation convenience, the model allows independent return and volatility shock and this dual shock nature leaves a room for the establishment of a variance risk
premium. 3The optimal model is chosen according to three information criteria, namely
can be completed through the inclusion of the returns of traditional financial products in the mean equation of the EGARCH(1,1) metho-dology. The volatility sourced in shocks that are incorporated in the returns of traditional financial markets are therefore considered in the volatility estimation of the selected structure. In summary, the esti-mated model has the following form:
= + + + + +
=
Rt a b R b DJIA b WTI b AvETF
j j t n t t t t 0 1 5 2 3 4 (3) = + + + + h E h D ln( )t2 t 1 (| t 1| (| t 1|)) ln( t21) t (4)
Rt−n represents the lagged value of stock returns, n days before Rt is observed. DJIAt represents the interaction between the distressed aviation company and the Dow Jones Industrial Average (DJIA), while
WTIt represents the interaction with West Texas Intermediate oil prices (WTI), which is a market found to be very closely associated with the aviation sector (Kristjanpoller & Concha, 2016; Yun & Yoon, 2019), but also a very strong signal of multiple forms of economic strife (Chuang, Chiu, & Edward Wang, 2008), therefore acting as a strong barometer of international effects within our selected methodological structure. Fi-nally, AvETFt represents that of the SPDR S&P Transportation ETF (XTN) which is found to best represent the performance of aviation companies during the period analysed. Finally, Dt is included in the variance equation to provide a coefficient relating to the volatility re-sponse to the thirty-day period after which the aviation tragedy has occurred.
In the next stage of our analysis, we investigate Hypothesis H4,
which specifically tests as to whether there has been a substantial change in dynamic correlations between the distressed company that has experienced the aviation disaster and the selected aviation indices in the period thereafter. To complete such an analysis, we test for the presence of such comovements in aviation markets and then specifically investigate their responses thereafter using a DCC-GARCH metho-dology. Engle (2002) models the right hand side of Eq. (1) rather than
Ht directly and proposes the dynamic correlation structure
= = + + R Q Q Q Q a b S au u bQ { } { } , (1 ) , t t t t t t t t 1/2 1/2 1 1 1 (5)
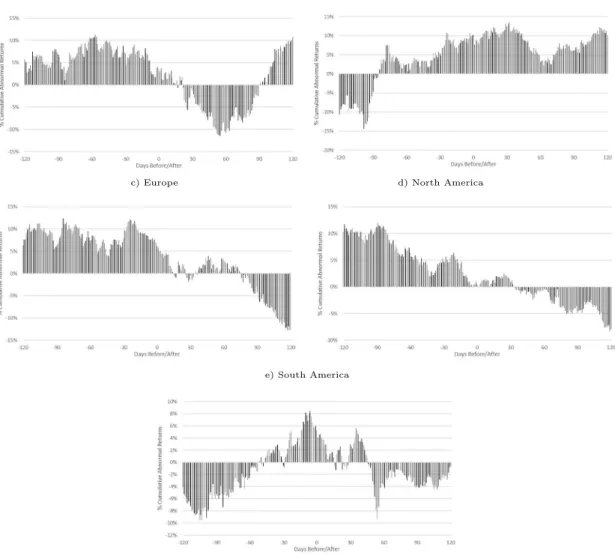
Fig. 6. Cumulative Abnormal Returns (CARs) by region due to airline disasters.
Note: The above figure presents the estimated Cumulative Abnormal Returns (CARs) by investigated region, while presenting the average results for sixty days both before and after each incident for presentation purposes.
(footnote continued)
the Akaike (AIC), Bayesian (BIC) and Hannan-Quinn(HQ), all of which consider both how good the fitting of the model is and the number of parameters in the model, rewarding a better fitting and penalising an increased number of parameters for given data sets. The selected model is the one with the minimum criteria values. We also used a variety of dummy-lengths in Eq. (3), denoted as Dt in the variance equation, but the twenty-day period after each selected event was denoted as the most stable specification across our selected methodologies. Results of all these specification tests are available from the authors on request.
where Qt ≡ [qij, t], ut = [u1, t,…,un, t]′ and ui, t is the transformed residuals i.e. ui, t = εi, t/hi, t, S ≡ [sij] = E[utut′] is the n × n un-conditional covariance matrix of ut, Qt∗ = diag {Qt} and a, b are non- negative scalars satisfying a + b < 1. The parameters of the DCC model are estimated by using the quasi-maximum likelihood method with respect to the log-likelihood function, and according to the state two- step procedure. When specifying the form of the conditional correlation matrix Rt, two requirements have to be considered. The first is that the covariance matrix Ht has to be positive and the second is that all the elements in the conditional correlation matrix Rt have to be equal or less than unity. The DCC model is estimated by using a two-step ap-proach to maximise the log-likelihood function. As proposed by Engle (2002), the DCC-GARCH model is designed to allow for a two-stage estimation of the conditional variance matrix ht. In the first stage, univariate GARCH (1,1) volatility models are fitted for each of the stock
return residuals and estimates of hitare obtained. In the second stage, stock return residuals are transformed by their estimated standard de-viations from the first stage as =zit hitit. Finally, the standardised re-sidual zit is used to estimate the correlation parameters. If we let θ denote the parameters in Dt and ϑ, the parameters in Rt, then the log- likelihood is:
= = + + + =
l
nlog log D D t log R z R z z z , 1 2 (2 ) [ | | ] t tT t t t tT t t t t t t 1 2 2 1 1 (6) The first part of the log likelihood function is volatility, which is the sum of the individual GARCH likelihoods. The log-likelihood function
Table 2
Significant increases in conditional volatility in the short-run after the event.
Date Event ID a0 Rt−1 DJIAt WTIt AVIt ω α β γ Dt
15/09/1995 Ev.2 0.0004 −0.0210 0.0546*** −0.0389*** 0.4510*** −0.0184*** −0.0023 0.9947*** 0.0755*** 0.0139** Std. Error (0.0003) (0.0140) (0.0210) (0.0134) (0.0362) (0.0066) (0.0075) (0.0002) (0.0044) (0.0065) 15/08/1996 Ev.4 −0.0005*** −0.0172 0.0390 −0.0241*** 0.8398*** 0.0199*** −0.0020 1.0000*** 0.0339*** 0.0177*** Std. Error (0.0002) (0.0142) (0.0289) (0.0072) (0.0508) (0.0022) (0.0065) (0.0000) (0.0001) (0.0020) 29/08/1996 Ev.5 −0.0005*** −0.0157* 0.0388*** −0.0233*** 0.8371*** 0.0199*** −0.0023 1.0000*** 0.0341*** 0.0177*** Std. Error (0.0001) (0.0093) (0.0138) (0.0083) (0.0475) (0.0022) (0.0063) (0.0000) (0.0001) (0.0020) 06/08/1997 Ev.8 −0.0005*** −0.0049*** 0.0331 −0.0180 0.8036* −0.0080** −0.0082 0.9933*** 0.0677*** 0.0393*** Std. Error (0.0002) (0.0006) (0.0413) (0.0110) (0.0509) (0.0035) (0.0077) (0.0000) (0.0005) (0.0037) 15/10/1997 Ev.9 0.0001 0.1546*** 0.1523** −0.0063 0.3184*** −0.0770** −0.0289*** 0.9834*** 0.1407** 0.0455*** Std. Error (0.0004) (0.0163) (0.0766) (0.0130) (0.0490) (0.0174) (0.0124) (0.0016) (0.0152) (0.0103) 14/08/1998 Ev.12 −0.0004** −0.0074 0.0226** −0.0188 0.8157*** −0.0515*** −0.0046 0.9857*** 0.0818*** 0.0534*** Std. Error (0.0002) (0.0054) (0.0114) (0.0118) (0.0388) (0.0023) (0.0097) (0.0003) (0.0092) (0.0029) 31/01/2000 Ev.14 0.0000 0.0267 −0.1103 0.0903*** 0.3918*** 0.0612*** −0.0131 0.9563*** 0.1970*** 0.3716*** Std. Error (0.0006) (0.0235) (0.0840) (0.0177) (0.0833) (0.0123) (0.0171) (0.0009) (0.0412) (0.0071) 06/03/2000 Ev.15 −0.0015** −0.0506*** −0.0359*** 0.1184* 0.0111*** −0.5107** −0.0069 0.9149*** 0.2388* 0.0345** Std. Error (0.0007) (0.0119) (0.0026) (0.0633) (0.0014) (0.2304) (0.0151) (0.0367) (0.0520) (0.0171) 24/04/2000 Ev.16 0.0000 0.0338 −0.1087** 0.0916*** 0.3875*** 0.0332*** −0.0149 0.9446*** 0.2136* 0.4324*** Std. Error (0.0002) (0.0205) (0.0481) (0.0141) (0.0507) (0.0081) (0.0176) (0.0050) (0.0695) (0.0293) 01/05/2000 Ev.17 0.0000 0.0338 −0.1072* 0.0914*** 0.3864*** 0.0318 −0.0145 0.9447*** 0.2132 0.4309*** Std. Error (0.0002) (0.0262) (0.0603) (0.0137) (0.0629) (0.0734) (0.0174) (0.0157) (0.1067) (0.1521) 31/10/2000 Ev.20 −0.0004*** −0.1104*** −0.0087** 0.0035** 0.2292*** −0.1828*** −0.0144*** 0.9748*** 0.2356** 0.0196** Std. Error (0.0001) (0.0135) (0.0044) (0.0014) (0.0207) (0.0097) (0.0051) (0.0008) (0.0302) (0.0084) 27/08/2001 Ev.21 0.0001 0.0344 −0.0888 0.0829*** 0.3629*** −1.0888** 0.0174 0.7773*** 0.2606 0.6206** Std. Error (0.0006) (0.0295) (0.0667) (0.0163) (0.0778) (0.4961) (0.0428) (0.0982) (0.0840) (0.3131) 08/01/2003 Ev.26 0.0001 −0.0236 0.0219 −0.0239 0.4379*** −0.5586*** −0.0029 0.9079*** 0.1412*** 0.1204*** Std. Error (0.0002) (0.0147) (0.0160) (0.0154) (0.0382) (0.0186) (0.0123) (0.0030) (0.0309) (0.0102) 06/03/2003 Ev.27 −0.0010*** −0.0646*** −0.0692 −0.1057 0.1384*** −0.5979** −0.0089 0.9027*** 0.2400*** 0.0310* Std. Error (0.0003) (0.0130) (0.0546) (0.0757) (0.0535) (0.2858) (0.0156) (0.0452) (0.0627) (0.0166) 03/02/2005 Ev.29 −0.0004*** −0.1155 0.0084 0.0053 0.2155** −0.2463*** −0.0142 0.9672*** 0.2468*** 0.0262*** Std. Error (0.0001) (0.1469) (0.2261) (0.0218) (0.1001) (0.0459) (0.0151) (0.0059) (0.0365) (0.0081) 21/06/2006 Ev.30 0.0003 −0.0230 0.0283 −0.0286 0.4348*** −0.2536*** −0.0032 0.9588*** 0.1487*** 0.0495*** Std. Error (0.0004) (0.0158) (0.0741) (0.0214) (0.0807) (0.0231) (0.0106) (0.0042) (0.0276) (0.0096) 07/05/2007 Ev.35 0.0000 0.3739 0.0000 0.0000 0.0000 −0.1386 0.1839 0.9896*** 0.5064 0.1835* Std. Error (0.0002) (1.8072) (0.0006) (0.0006) (0.0006) (0.5712) (1.7155) (0.1000) (0.6920) (0.1034) 17/07/2007 Ev.36 0.0002** 0.1556*** 0.1673*** −0.0098*** 0.3090*** −0.2578*** −0.0323** 0.9632*** 0.1690*** 0.0439*** Std. Error (0.0001) (0.0150) (0.0400) (0.0016) (0.0361) (0.0145) (0.0147) (0.0015) (0.0134) (0.0074) 13/08/2007 Ev.37 −0.0001*** 0.0694** 0.3947 −0.1005** 0.5097 −0.0386*** −0.0245** 0.9958*** 0.1007*** 0.0209*** Std. Error (0.0007) (0.0320) (0.2561) (0.0306) (0.2571) (0.0066) (0.0107) (0.0004) (0.0062) (0.0063) 14/09/2007 Ev.39 0.0003*** −0.0237*** 0.0340** −0.0328** 0.4396** −0.1221** −0.0044 0.9799*** 0.1139*** 0.0229*** Std. Error (0.0002) (0.0073) (0.0280) (0.0119) (0.0461) (0.0197) (0.0087) (0.0034) (0.0197) (0.0054) 15/09/2008 Ev.41 0.0003 −0.0245** 0.0546 −0.0338 0.4338*** −0.1059*** −0.0015 0.9826*** 0.1050*** 0.0203*** Std. Error (0.0007) (0.0117) (0.0634) (0.0256) (0.1460) (0.0335) (0.0103) (0.0048) (0.0237) (0.0034) 12/01/2009 Ev.43 −0.0001 0.0022 1.1424*** −0.2101*** 0.2868*** −0.0127*** −0.0136 0.9970*** 0.0360*** 0.0102*** Std. Error (0.0003) (0.0173) (0.0783) (0.0228) (0.0868) (0.0021) (0.0083) (0.0000) (0.0003) (0.0022) 29/11/2013 Ev.56 0.0000 0.0891 0.0000 0.0000 0.0000 −0.0109 −0.1072 0.9872*** 0.9912 0.2575* Std. Error (0.0001) (0.2865) (0.0003) (0.0003) (0.0003) (1.0367) (2.2909) (0.0021) (1.7238) (0.1530) 04/03/2019 Ev.67 −0.0017*** −0.0537*** −0.0246 0.1157* −0.0074 −0.5349** −0.0011 0.9155*** 0.2342*** 0.0963* Std. Error (0.0002) (0.0125) (0.0513) (0.0653) (0.0442) (0.2561) (0.0142) (0.0397) (0.0546) (0.0516) Note: This table presents the estimation results of the mean and conditional variance equations; i.e., Rt = a0 + b1Rt−1 + b2DJIA + b3WTI + b4AVI + εt; and ln (ht2) = ω + αεt−1 + γ(|εt−1|−E(|εt−1|)) + β ln (ht−12) + Dt respectively. Rt−1 represents the lagged value of the observed company returns. The term ht is the conditional volatility estimated by the EGARCH process and Dt is a dummy term to provide a coefficient relating to the observed changes in the conditional volatility in the subsequent period following each event for each of our investigated companies. Only the results for the companies with a significant positive Dt term is presented. For brevity, only the significant results for entire dummy period are presented. The values in the parentheses are standard errors. ***, ** and * denote significant at the 1%, 5% and 10% level respectively.
can be maximised in the first stage over the parameters Dt. Given the estimated parameters in the first stage, the correlation component of the likelihood function in the second stage is maximised to estimate the
correlation coefficients. Finally, we examine the DCC-GARCH model's change in behaviour before and after each airline disaster, measuring the specific relationship between the associated airline and the broad aviation sector as measured by the SPDR S&P Transportation ETF (XTN).
In the final stage of our analysis, and to provide additional metho-dological robustness, we analyse the changing behaviour of price dis-covery in the periods after such aviation disasters. There are two standard measures of price discovery commonly employed in the lit-erature: the Hasbrouck (1995) Information Share (IS) and the Gonzalo and Granger (1995) Component Share (CS) approach. Hasbrouck (1995) demonstrates that the contribution of a price series to price discovery (the ‘Information Share’) can be measured by the proportion of the variance in the common efficient price innovations that is ex-plained by innovations in that price series. Gonzalo and Granger (1995) decompose a cointegrated price series into a permanent component and a temporary component using error correction coefficients. The per-manent component is interpreted as the common efficient price, the temporary component reflects deviations from the efficient price caused by trading fractions. We estimate IS and CS, as developed by Hauptfleisch, Putniņš, and Lucey (2016) using the error correction parameters and variance-covariance of the error terms from the Vector Error Correction Model (VECM):
= + + + = = p p p p ( ) p t t t i i t i j j t j t 1, 1 1, 1 2, 1 1 200 1, 1 200 2, 1, (7) = + + + = = p p p p p t t t k k t k m m t m t 2, 2 1, 1 2, 1 1 200 1, 1 200 2, 2, (8) where Δpi, t is the change in the log price (pi, t) of the asset traded in market i at time t. The next stage is to obtain the component shares from the normalised orthogonal vector of error correction coefficients, therefore: = = = = CS1 1 2 ;CS 2 1 2 2 1 1 2 (9)
Given the covariance matrix of the reduced form VECM error terms4 where: = = M mm m0 0 (1 ) 11 12 22 1 2 2 2 12 (10)
we calculate the IS using:
= + + + IS m m m m m ( ) ( ) ( ) 1 1 11 2 12 2 1 11 2 12 2 2 22 2 (11) = + + IS m m m m ( ) ( ) ( ) 2 2 22 2 1 11 2 122 2 22 2 (12)
Recent studies show that IS and CS are sensitive to the relative level of noise in each market, they measure a combination of leadership in impounding new information and the relative level of noise in the price series from each market. The measures tend to overstate the price discovery contribution of the less noisy market. An appropriate com-bination of IS and CS cancels out dependence on noise, Yan and Zivot (2010); Putniņš (2013). The combined measure is known as the In-formation Leadership Share (ILS) which is calculated as:
= + = + ILS IS IS CS CS IS IS CS CS ILS IS IS CS CS IS IS CS CS IS IS CS CS and IS IS CS CS 1 1 2 2 1 2 1 1 2 2 2 1 1 2 1 2 2 1 2 1 1 2 1 2 2 1 (13) Table 3
Number(percent) of companies experiencing an increase in their stock returns' unconditional volatility in the short and long-run after the (crash) event.
Company [−10,+10] [−20,+20] [−40,+40] [−60,+60] [all pre- ann, all post-ann] Panel A: Log-returns with higher variance
2610.TW 3 (100) 3 (100) 1 (33.33) 1 (33.33) 1 (33.33) AC.TO 1 (100) 1 (100) 1 (100) 1 (100) 1 (100) AEROMEX 1 (50) 1 (50) 2 (100) 2 (100) 1 (50) AFLT 2 (50) 1 (25) 1 (25) 1 (25) 0 (0) AIRA.KL 0 (0) 0 (0) 1 (100) 1 (100) 1 (100) AIRF.PA 4 (80) 3 (60) 2 (40) 1 (20) 0 (0) ALK 1 (100) 1 (100) 1 (100) 1 (100) 0 (0) BA 3 (75) 2 (50) 0 (0) 0 (0) 2 (50) DAL 1 (50) 2 (100) 2 (100) 2 (100) 0 (0) GIAA.JK 1 (100) 0 (0) 1 (100) 1 (100) 1 (100) LTM.SN 3 (75) 3 (75) 2 (50) 2 (50) 1 (25) MASM 3 (100) 2 (66.67) 2 (66.67) 2 (66.67) 1 (33.33) PIAa.KA 3 (50) 3 (50) 2 (33.33) 3 (50) 2 (33.33) THYAO.IS 3 (50) 2 (33.33) 2 (33.33) 2 (33.33) 0 (0) UAL.O 4 (100) 4 (100) 3 (75) 3 (75) 0 (0) UTAR.MM 1 (33.33) 1 (33.33) 2 (66.67) 2 (66.67) 0 (0) ALL 39 (58.21) 35 (52.24) 31 (46.27) 30 (44.78) 13 (19.4) Panel B: Log-returns with significantly higher variance
AEROMEX 1 (50) 1 (50) 2 (100) 2 (100) 0 (0) AFLT 2 (50) 1 (25) 1 (25) 1 (25) 0 (0) AIRF.PA 3 (60) 2 (40) 1 (20) 0 (0) 0 (0) DAL 0 (0) 1 (50) 2 (100) 1 (50) 0 (0) LTM.SN 1 (25) 2 (50) 2 (50) 2 (50) 1 (25) MASM 2 (66.67) 1 (33.33) 1 (33.33) 2 (66.67) 1 (33.33) PIAa.KA 0 (0) 1 (16.67) 0 (0) 2 (33.33) 2 (33.33) THYAO.IS 2 (33.33) 2 (33.33) 2 (33.33) 2 (33.33) 0 (0) UAL.O 2 (50) 2 (50) 2 (50) 3 (75) 0 (0) ALL 17 (25.37) 17 (25.37) 18 (26.87) 20 (29.85) 11 (16.42) Panel C: Excess log-returns with higher variance
2610.TW 3 (100) 3 (100) 3 (100) 3 (100) 1 (33.33) AEROMEX 1 (50) 1 (50) 2 (100) 2 (100) 2 (100) AFLT 3 (75) 2 (50) 1 (25) 1 (25) 0 (0) AIRF.PA 4 (80) 3 (60) 2 (40) 1 (20) 0 (0) BA 3 (75) 2 (50) 1 (25) 1 (25) 2 (50) DAL 1 (50) 2 (100) 2 (100) 2 (100) 0 (0) LTM.SN 2 (50) 3 (75) 3 (75) 2 (50) 1 (25) MASM 3 (100) 3 (100) 2 (66.67) 2 (66.67) 1 (33.33) PIAa.KA 2 (33.33) 2 (33.33) 3 (50) 3 (50) 2 (33.33) THYAO.IS 4 (66.67) 2 (33.33) 2 (33.33) 2 (33.33) 0 (0) UAL.O 4 (100) 4 (100) 4 (100) 4 (100) 0 (0) UTAR.MM 2 (66.67) 1 (33.33) 2 (66.67) 1 (33.33) 0 (0) ALL 40 (25.37) 36 (28.36) 35 (25.37) 31 (23.88) 13 (16.42) Panel D: Excess log-returns with significantly higher variance
AFLT 2 (50) 1 (25) 1 (25) 1 (25) 0 (0) DAL 1 (50) 1 (50) 2 (100) 0 (0) 0 (0) LTM.SN 1 (25) 3 (75) 2 (50) 1 (25) 1 (25) MASM 2 (66.67) 1 (33.33) 1 (33.33) 2 (66.67) 1 (33.33) PIAa.KA 1 (16.67) 2 (33.33) 0 (0) 2 (33.33) 2 (33.33) THYAO.IS 1 (16.67) 2 (33.33) 2 (33.33) 2 (33.33) 0 (0) UAL.O 2 (50) 3 (75) 2 (50) 2 (50) 0 (0) ALL 17 (25.37) 19 (28.36) 17 (25.37) 16 (23.88) 11 (16.42) Note: This table shows the number of companies that experience a higher un-conditional volatility in their stock prices after announcements. The column headers show the unconditional volatility calculation periods in days before and after the announcements. In the table, the values in the parentheses are the percentage of companies within the sub-groups experiencing an increase in their stock returns' unconditional variances. Panel A (Panel B) reports the number of companies that experience a (significantly) higher variance in their stocks' daily returns. Panel C (Panel D) reports the number of companies that experience a (significantly) higher variance in their stocks' daily excess returns over the corresponding market returns. For brevity, only significant and results above zero are presented.
4 = 12 1 2
1 2 22 and its Cholesky factorisation, Ω = MM′.
Our work on the information share, component share and in-formation leadership share of price discovery sets out to address the final stated hypothesis as to whether there exist substantial changes in information flows between the distressed aviation companies and broad aviation indices in the period after such disasters.
4. Results
The first analysed hypothesis investigated as to whether the price response of airlines in the aftermath of aviation disasters has varied substantially. To begin such an analysis, we focus on a number of dif-ferent characteristics surrounding the behaviour of the share prices of companies that have experienced such aviation disasters. In Fig. 3 we observe the share price return volatility on a daily level of these com-panies over time between 1995 and 2019. A one-year sample, both six- months before and after the incident is presented. We clearly identify that substantially elevated levels of share price volatility on average in the periods incorporating 1995 through 2019, however, there is evi-dence to suggest that this volatility has somewhat decreased in the period of time thereafter. Throughout each period, there is evidence presented of sharp negative price movements in the days following the aviation disaster, however, as is particularly evident in the periods 2005 through 2019, this is immediately followed by substantial in-creases in the two-month period after the incident. In Fig. 4 we observe the results of a similar analysis that has been separated by the continent in which the parent company of the airline was located at the time of the incident. For each region analysed, there is substantial evidence of immediate negative responses in each jurisdiction with the exception of South America which is portrayed as quite a volatility market throughout the period analysed. It is Asia and North America that present the most substantial decreases in share price in the days im-mediately after the date on which the incident occurred. On average, North American airlines experience quite a substantial increase in share price within ten days of the incident.
In Fig. 5 we analyse the cumulative abnormal returns (CARs) over time and in Fig. 6 we observe the same analysis as separated by the
region in which the disaster has occurred. The selection of six month windows before and after each event is made solely for presentation purposes. Focusing on the performance of the CARs over time, we ob-serve that there exist sharp under-performance of the companies throughout each of the analysed time periods with the exception of the period between 2000 and 2004. While considering the relative di-versification that aviation stocks presented throughout the multiple international financial crises to portfolio investors, the same stocks were very much exposed to shocks in the market for oil (Kristjanpoller & Concha, 2016; Yun & Yoon, 2019). There is further evidence that CARs do not appear to behave in a similar manner depending on the market in which the airline stock is traded. South American airlines presented evidence of substantial under-performance when compared to international averages in the period before airline crashes leading to fatality. This identified under-performance continued in the period thereafter. African, European and North American airlines were iden-tified to largely out-perform broad markets by more than 10%, but in the period thereafter, under-performed the same indices by between 6% and 10%. When considering this information, we can validate Hy-pothesis 1, as we clearly identify time-varying and regional differentials between airline share price performance due to aviation disasters.
In the next phase of our analysis, we investigate the changing fi-nancial market volatility effects of each individual case analysed. In Table 2 we present the results of each of the individual EGARCH methodologies analysed5 Specifically, dummy analysis in the volatility model shows that the largest long-term sustained volatility increase are found to relate to that of six specific events: Event 21 (+0.6206), event 16 (+0.4324), event 17 (+0.4309), event 14 (+0.3716), event 56 (+0.2575) and event 35 (+0.1835). In Table 3 we observe the number of companies that experienced a sustained increase in their stock re-turns' unconditional volatility in the period after each incident. To this effect, we observe as to whether the estimated volatility increases, as
Table 4
Significant increases in conditional volatility in the short-run after the event.
Company Event date a0 Rt−1 DJIA WTI Avi ω α β γ Dt
AFLT 31 January 2000 −0.0002*** 0.0036 −0.1486*** 0.0814*** 0.4434*** −0.2603*** 0.0034 0.9634*** 0.1528*** 0.2628** (0.0001) (0.004) (0.0157) (0.0181) (0.048) (0.0091) (0.0136) (0.0005) (0.0366) (0.1088) AFLT 24 April 2000 −0.0004* 0.0092 −0.214*** 0.081*** 0.471*** −0.9938*** 0.0155 0.8634*** 0.3029*** 0.265*** (0.0003) (0.0107) (0.0493) (0.0109) (0.0075) (0.015) (0.0288) (0.0001) (0.0344) (0.0412) AFLT 01 May 2000 −0.0004* 0.0091 −0.2132*** 0.0808*** 0.4701*** −0.9905*** 0.016 0.8638*** 0.3017*** 0.3063*** (0.0002) (0.0131) (0.0526) (0.0116) (0.0075) (0.015) (0.0288) (0.0001) (0.0342) (0.1019) AFLT 27 August 2001 −0.0004 0.0095 −0.2185*** 0.0807*** 0.4739*** −0.9822*** 0.0134 0.865*** 0.3016 0.2938** (0.0003) (0.014) (0.0539) (0.0164) (0.057) (0.0477) (0.063) (0.014) (0.2331) (0.1247) AIRF.PA 15 August 1996 −0.0006 −0.0462*** 0.0952 −0.067*** 0.9138*** −0.0007 −0.0139** 0.9995*** 0.0252*** 0.2558*** (0.0004) (0.0167) (0.0741) (0.0197) (0.0634) (0.0007) (0.0064) (0) (0.0011) (0.078) AIRF.PA 29 August 1996 −0.0006** −0.0444*** 0.0963** −0.0662*** 0.907*** −0.0024*** −0.0145** 0.9993*** 0.0247*** 0.274*** (0.0002) (0.0116) (0.0379) (0.0198) (0.0647) (0.0007) (0.006) (0) (0.0017) (0.0747) ALK 15 September 2008 −0.0001 −0.0513*** 1.0525*** −0.1832*** 0.3261*** −0.0673*** −0.0064 0.9906*** 0.0722*** 0.2259*** (0.0002) (0.0095) (0.0918) (0.018) (0.0354) (0.0021) (0.0139) (0.0001) (0.0024) (0.0523) DAL 12 January 2009 −0.0001 0.004 1.1402*** −0.2078*** 0.2837*** −0.0172*** −0.0233** 0.9973*** 0.0684*** 0.1196*** (0.0003) (0.0173) (0.0502) (0.0217) (0.06) (0.0012) (0.0099) (0) (0.0007) (0.0423) LTM.SN 15 October 1997 0.0003** 0.1596*** 0.1823*** −0.0102*** 0.318*** −0.2531*** −0.0201 0.9666*** 0.1527*** 0.3463*** (0.0001) (0.015) (0.0272) (0.0035) (0.0254) (0.0214) (0.0158) (0.0025) (0.0124) (0.0701) PIAa.KA 06 March 2003 −0.0017*** −0.054*** −0.0253 0.1169 −0.0042 −0.5279** −0.0035 0.9163*** 0.2365*** 0.1028** (0.0004) (0.0144) (0.0714) (0.077) (0.1098) (0.263) (0.0145) (0.0408) (0.0596) (0.0423) THYAO.IS 15 September 1995 0.0004 −0.0218 0.0567 −0.0387* 0.4474*** −0.0334*** −0.0035 0.9945*** 0.0761*** 0.1607*** (0.0003) (0.0214) (0.102) (0.0204) (0.0891) (0.0013) (0.0077) (0) (0.0001) (0.0505) Note: This table presents the estimation results of the mean and conditional variance equations; i.e., Rt = a0 + b1Rt−1 + b2DJIA + b3WTI + b4AVI + εt; and ln (ht2) = ω + αεt−1 + γ(∣ εt−1 ∣ − E(∣ εt−1 ∣)) + β ln (ht−12) + Dt respectively. Rt−1 represents the lagged value of the observed company returns. The term ht is the conditional volatility estimated by the EGARCH process and Dt is a dummy term to provide a coefficient relating to the observed changes in the conditional volatility in the subsequent 10 days (2 weeks) following each event for each of our investigated companies. Only the results for the companies with a significant positive Dt term is presented. For brevity, only significant and results above zero are presented. The values in the parentheses are standard errors. ***, ** and * denote significant at the 1%, 5% and 10% level respectively.
5For brevity, only significant results are presented here. All results across the
entire range of analysed dummy variables (of 1-day, 5-day, 10-day, 20-day, 40- day and 60-day duration) are presented in online appendix.
measured by both the logarithm of daily returns and excess logarithm of daily returns were significantly different to zero in the periods presenting ten, twenty, forty and sixty days after the incident. The re-sults are separated between log-returns with a higher variance and excess log-returns with higher variance. Within this context, in both samples analysed, we observe that there are a large number of com-panies that experience a sharp increase in unconditional volatility in the ten-day period both before and after the aviation incident, in-dicative of strong short-term effects. However, such effects are found to dissipate in the following windows of investigation, based on twenty- day, forty-day and sixty-day windows respectively. Such results in-dicate that while the shock to unconditional volatility appears to be immediate, there is evidence to suggest that it dissipates and returns to pre-aviation incident levels within sixty days after the event. While focusing on the time-variations of the estimated results Table 4 presents the significant estimates of short-term (denoted to be the ten-day period after the airline disaster) price volatility. We observe that companies that have experienced more recent aviation disasters possess an in-creased correlation with the DJIA and a dein-creased correlation over time with other aviation companies as measured by the SPDR S&P Trans-portation ETF. Within the models presented in Table 4, we observe the sharp, strongly significant increases in short-term volatility in the period after the aviation disaster as measured by Dt.
The variants dummy variable duration of the estimated EGARCH methodology allow for the investigation of Hypotheses H2 and H3,
which specifically analyse as to whether the price volatility response of the airline disasters appears to depend on the scale of the disaster as measured by the number of fatalities and as to whether such volatility effects have changed over time. Fig. 7 presents the results of these analyses. While utilising the volatility estimates across all cases in-cluded in this analysis, we use a scatter-plot to identify the relationship between these dummy variable estimates and that of number of fatal-ities per incident. The results indicate a clear positive relationship be-tween the two variables, indicating that the estimated EGARCH-vola-tility appears to be significantly influenced by the scale of the disaster in terms of the fatalities generated. These two specific results enable acceptance of both Hypotheses 2 and 3 as there is clear evidence of a relationship between volatility and incident-severity, while further, such volatility effects are found to changed over time.
In Fig. 8, we specifically analyse as to whether the investigated dynamic correlations have changed over time. To complete such an analysis we have broken the analysis into five year windows of analysis and presented the average dynamic conditional correlation for the sixty day period both before and after each incident. We observe that there were substantial decreased in correlation in the periods after incidents in the period 1995–99, 2000–04 and 2005–09 respectively. However,
Fig. 7. The relationship between EGARCH-calculated volatility and both the scale and time of the incident.
Note: The above figures present in the top panel the EGARCH-calculated volatility based on the number of fatalities that have occurred in each incident, while in the lower panel, the EGARCH-calculated volatility over time.
evidence of such pronounced effects do not appear to occur in the periods between 2010 and 14 and 2015–19. While in Fig. 9 we observe the average dynamic correlation by region in the sixty day periods both before and after the investigated aviation disaster. While crashes in Africa are found to have little of substantial change in the period after, there are substantial changes in dynamic conditional correlation ob-served for incidents that have occurred in Asia, Europe, and both North and South America respectively. The most substantial effects were ob-served in South America where the dynamic correlation is found to fall from 0.193 on the date of the incident to fall to 0.048 ten days after the incident. Such results indicate that there are geographical differences to be considered where volatility appears to differ based on the region in which the incident occurs.
In Table 5, we observe the results of the dynamic conditional cor-relation analysis between the incident company and the selected avia-tion indices in the aftermath of airline disasters. Such an analysis is used to specifically test Hypothesis H4. Two panels are presented in Table 5,
where the first presents all dummy coefficients that are found to result in a positive result for the dynamic conditional correlation, while the lower panel presents only significant results. For brevity, only positive results are presented, while negligible results are omitted for pre-sentation purposes only. Each dummy window is presented, based on 1- day through 60-day frequencies and an additional analysis which in-cludes the entire sample period after the aviation disaster. While there
is a relatively stable number of incidents that present significantly po-sitive volatility through to the broad aviation industry as represented through the twenty-five through twenty-seven incidents that are found to present positive dummy coefficients. For the entire period thereafter, forty-two companies representing 62.7% of the sample are found to be positive while analysing the entire period after the event. However, while concentrating on significant results only, there is an interesting observation based on the time frame in which the dynamic correlations are found to be significantly positive. Only one event is found to have generated a significantly positive conditional correlation through to the broad aviation indices, however, the effects of this event are found to dissipate before twenty days after the event. While forty events are found to generate significant positive volatility transfer, it appears that such effects become more substantial over time. This could be attrib-uted to improved information being released to the market as to the exact nature and causes of the incident, which could generate profound industrial changes dependent on the nature of the scenarios. Due to the identification of such significant positive correlations, we can state acceptance of Hypothesis H4, namely that individual shocks possess the
ability to influence the volatility of the entire aviation index. The final hypothesis investigates as to whether there exists a sub-stantial change in information flows between the distressed aviation company and broad aviation indices after an airline disaster. In Table 6 we observe the most substantial changes in the flow of information as
Fig. 8. Dynamic conditional correlations with aviation sector over time due to airline disasters (1995–2019).
Note: The above figure presents the dynamic conditional correlations with the aviation sector over time due to airline disasters. The average results for sixty days both before and after each incident for presentation purposes.