A Large-Scale Sentiment Analysis for Yahoo! Answers
Onur Kucuktunc
The Ohio State University Columbus, OH, USA
[email protected]
B. Barla Cambazoglu
Yahoo! Research Barcelona, Spain[email protected]
Ingmar Weber
Yahoo! Research Barcelona, Spain[email protected]
Hakan Ferhatosmanoglu
Bilkent University Ankara, Turkey[email protected]
ABSTRACT
Sentiment extraction from online web documents has re-cently been an active research topic due to its potential use in commercial applications. By sentiment analysis, we refer to the problem of assigning a quantitative positive/negative mood to a short bit of text. Most studies in this area are limited to the identification of sentiments and do not inves-tigate the interplay between sentiments and other factors. In this work, we use a sentiment extraction tool to investi-gate the influence of factors such as gender, age, education level, the topic at hand, or even the time of the day on sen-timents in the context of a large online question answering site. We start our analysis by looking at direct correlations, e.g., we observe more positive sentiments on weekends, very neutral ones in the Science & Mathematics topic, a trend for younger people to express stronger sentiments, or people in military bases to ask the most neutral questions. We then extend this basic analysis by investigating how properties of the (asker, answerer) pair affect the sentiment present in the answer. Among other things, we observe a dependence on the pairing of some inferred attributes estimated by a user’s ZIP code. We also show that the best answers differ in their sentiments from other answers, e.g., in the Business & Finance topic, best answers tend to have a more neutral sentiment than other answers. Finally, we report results for the task of predicting the attitude that a question will provoke in answers. We believe that understanding factors influencing the mood of users is not only interesting from a sociological point of view, but also has applications in ad-vertising, recommendation, and search.
Categories and Subject Descriptors
H.m [Information Systems]: Miscellaneous; J.4 [Social and Behavioral Sciences]: Psychology, Sociology
General Terms
Design, Experimentation, Human Factors, Measurement
Permission to make digital or hard copies of all or part of this work for personal or classroom use is granted without fee provided that copies are not made or distributed for profit or commercial advantage and that copies bear this notice and the full citation on the first page. To copy otherwise, to republish, to post on servers or to redistribute to lists, requires prior specific permission and/or a fee.
WSDM’12,February 8–12, 2012, Seattle, Washington, USA.
Copyright 2012 ACM 978-1-4503-0747-5/12/02 ...$10.00.
Keywords
Sentiment analysis, attitude, sentimentality, collaborative question answering, prediction
1.
INTRODUCTION
The advance of Web 2.0 boosted the creation of personal web content involving sentiments, e.g., blogs, tweets, and other types of social media. Extraction and analysis of sen-timents in this type of content do not only give an emotional snapshot of the online world but also have potential applica-tions in electronic commerce, where the marketing strategy of a product might depend on the mood of the customer. Given both the sociological and financial motivations to un-derstand sentiments, a large body of research has recently investigated the issues involved in sentiment analysis [18].
Despite the intense interest in sentiment analysis, how-ever, relatively little has been done to understand the in-terplay between sentiments and other factors. In this work, we take the first step in this direction. In particular, we use a state-of-the-art sentiment extraction tool [22] to ex-tract sentiments from a very large sample of questions and answers found in Yahoo! Answers.1
Our sample provides a rich source for sentiments and also has rich meta-data, including demographic details of users and their degree of experience in the system. To facilitate our analysis, we in-troduce the metrics of attitude and sentimentality, which enable us to quantify the direction (i.e., positive or nega-tive) and strength of sentiments, respectively.
Our analysis starts with a large-scale study on the correla-tion of various features with the observed attitude and sen-timentality. We investigate textual, topical, demographical, spatial, and temporal features. We then take the analysis one step beyond and answer questions of the following kind: • Topical context: Do sentiments depend on the con-text? For example, is there a difference in the attitude of answers related to Tiger Woods in the context of news and events versus the context of sports? • Class interaction: Who answers how to whom? How
do age groups differ in their answers to each other? • Experience level: How does one’s experience in Yahoo!
Answers affect the expressed sentiments? Does high experience imply more positive attitude?
• Emotional congruence: How do one’s own sentiments correlate with prior sentiments of others? Does a
ques-1
tion with a strong sentimentality attract answers with a similar degree of sentimentality?
• Answer preference: How do sentiments within an an-swer influence an asker’s preference? Do people tend to select positive or neutral answers as best answers? In addition to seeking answers to such questions, we briefly elaborate on the predictability of sentiments. In particular, we build a machine learning model to predict the attitude that will be generated in response to a given question.
Some selected findings of our work are the following: • There is a strong dependency on the topic. Topics
such as Beauty & Style attract strong and generally positive sentiments, whereas Science & Mathematics attracts answers of low sentimentality.
• Demographic factors suggest a strong influence in our data, with women generally expressing stronger, more positive sentiments than men, young people being more positive than older people, and people from pre-dominantly black neighborhoods expressing relatively more neutral sentiments. We also observe a trend for more educated people to give less sentimental answers. • Sentiments show temporal variation. At a monthly level, the most positive sentiments are observed both during the summer and December. At a daily level, the most positive sentiments are expressed on Saturday and Sunday. At an hourly level, the attitude is at its lowest at around five in the morning.
• People have stronger tendency to give neutral answers as they gain more experience in the online world. • Best answers differ significantly from other answers in
terms of expressed sentiments with more neutral an-swers being preferred in Business & Finance and more positive ones in News & Events.
The rest of the paper is organized as follows. In Sec-tion 2, we provide some informaSec-tion about the Yahoo! An-swers data used in our study. Section 3 summarizes the framework adopted for sentiment analysis. Potential caveats of our study are discussed in Section 4. We investigate the correlation between the sentiments and features extracted from the data in Section 5. In Section 6, we conduct various analyses involving sentiments. Section 7, as a representative prediction task, explores the predictability of the attitude a question will provoke in its answers. We survey the re-lated work in Section 8. Finally, the paper is concluded in Section 9 with a brief discussion of potential future work.
2.
YAHOO! ANSWERS
2.1
Background
Yahoo! Answers is the largest collaborative question an-swering site in the Web. People ask questions on different topics and share their knowledge, opinions, and personal ex-periences as answers to these questions. Questions are man-ually classified by askers into topics so that answerers can easily find them. Answerers can find questions by searching or browsing through a fixed hierarchy of categories.
Every question goes through a best answer selection pro-cess. A question remains open during four days for others to answer. The duration of the process can be shortened or extended by the asker of the question. The asker has the option to select a best answer, starting from one hour after the first answer is received, or he can leave the decision to the community vote. If he does neither and when there is
!" #" $" %" &" '" (" )" *" +,-"."" "."! "."# "."$ "."% "."& "."' "."( ".") "."* ".!" /012345675879:-0: !"" !"! !"# !"$ !"% &'()*+,-.,/'*012-30,45-6,0785*9 !"" !"! !"# !"$ !"% !": !"; !"< =->'5812-3,-.,'0*+0,45-6,0785*9
Figure 1: Fraction of user population with a certain age (left), population of users who posted a certain number of questions (right).
!"" !"! !"# !"$ !"% !"& '()*+,-./-0123+,2-45.6-2705+8 !"" !"! !"# !"$ !"% !"& !"9 !": ;.<(50=>.1-./-(2+,2-45.6-2705+8 !"" !"! !"# !"$ !"% &'()*+,-.,/012*+1,34-5,16/4*7 !"" !"! !"# !"$ !"% !"8 !"9 !": &'()*+,-.,;'*1<=-01,34-5,16/4*7
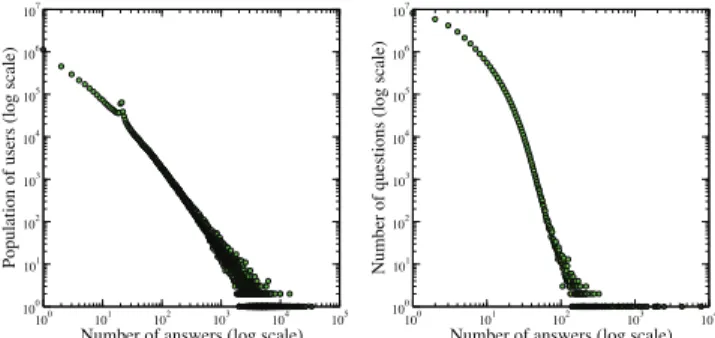
Figure 2: Population of users who posted a certain number of answers (left), number of questions re-ceiving a certain number of answers (right).
only a single answer, then the system automatically selects the best answer after a certain time. Answerers whose an-swers are selected as the best answer gain experience points, which provide a motivation for answering others’ questions.
2.2
Dataset Characteristics
We use a sample set of questions and answers posted in Yahoo! Answers during a 12-month period, from October 2009 to September 2010. The sample is restricted to posts originating from the US and contains 34M questions, 132M answers, and 412M sentences. In this sample, about 2.4M users have participated as either an asker or an answerer. We were able to obtain self-provided demographic information for about 1.5M users, of which 54.5% are females and 45.5% are males. The users in our sample are mainly young people, whose ages vary between 15 and 30 (Fig. 1 (left)).
In our data, a user posts 5.5 questions and 32.7 answers, on average.2
Populations of users who posted a specific num-ber of questions or answers both follow a power law distri-bution, as shown in Figs. 1 (right) and 2 (left), respectively. In Fig. 2 (left), it is interesting to note the sudden jump at 20 answers, due to many users aiming to post at least 20 answers since a new level is gained at this point. As seen in Fig. 2 (right), the distribution of the number of answers a question receives is also highly skewed (on average, 13.3 answers, excluding questions without any answer).
In Yahoo! Answers, there are 1676 editorially defined cate-gories, 26 of which are top-level categories (e.g., Computers & Internet, Politics & Government). The rest are either second-level or third-level subcategories. A question is la-beled with the lowest-level category selected by its asker.
2
3.
ANALYSIS FRAMEWORK
Our analysis framework involves the following steps. We first process our sample data to extract questions posted in Yahoo! Answers and their corresponding answers. We then obtain the demographics information of users who posted these questions and answers. Within these two steps, we also extract a number of features that facilitate our analy-sis. Next, we compute the sentiment scores for individual sentences in the posts, using a state-of-the-art sentiment analysis software as a black box [22]. Based on the senti-ment scores obtained at the sentence level, we compute two metrics, referred to as attitude and sentimentality, for dif-ferent granularities of text. The details of these steps are provided in the rest of this section.
3.1
Question and Answer Extraction
In our framework, a question is represented by the sen-tences in the title section of the question,3
i.e., the sentences in the abstract section, which provides more details about the question, are ignored. Together with the question text, we also extract some features related to the question (e.g., question length, category, time/date, asker’s current experi-ence, and ZIP code). Since the adopted tools cannot handle non-English text, we omit questions which are submitted to a frontend whose language is not English.
We represent an answer by the set of sentences it contains. To split answers into sentences, we use the Stanford parser.4
Very short (less than 5 characters) or long sentences (more than 400 characters) are ignored. Since the language of the frontend is not always present in our data, we require that either the language is present and set to English or that the location is present and set to the US. Only answers given in response to questions submitted to an English frontend are considered. During the answer extraction process, we also extract some features related to answers (e.g., time/date, answerer’s current experience, and ZIP code).
3.2
Demographics Extraction
To post either a question or an answer on Yahoo! Answers, a user must have an account and be logged in. Although initially Yahoo!-Answers-only accounts existed, for several years, a general Yahoo! account has been required. For these accounts, we obtain self-provided registration information, which includes birth year, gender, ZIP code, and country.
For users with an existing US ZIP code, we obtain de-mographic estimates of their income (as quantified by the annual per-capita income), their education level (as quanti-fied by the fraction of the population holding a bachelor’s degree or higher), and even their race via the 2000 Govern-mental Census Data,5
using the same approach as in [26]. We classify ZIP codes and their corresponding users under the White, Black, and Asian classes6 if the fraction of the
corresponding race in that ZIP code surpasses 50%. In all plots and tables, we always report the results for the largest suitable user population. For example, if a user does not have a valid ZIP code, we do not involve the user in exper-iments about income, but the user contributes to statistics about the age distribution.
3Typically, the title contains a single question sentence. 4
http://nlp.stanford.edu/software/lex-parser.shtml
5
http://factfinder.census.gov/
6
We use the terminology used in the US census.
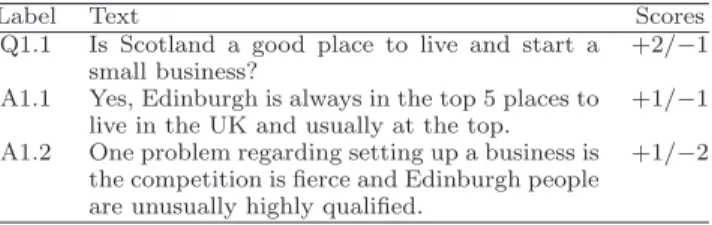
Table 1: An example question and the first two sen-tences of the answer
Label Text Scores
Q1.1 Is Scotland a good place to live and start a
small business? +2/−1
A1.1 Yes, Edinburgh is always in the top 5 places to
live in the UK and usually at the top.
+1/−1
A1.2 One problem regarding setting up a business is
the competition is fierce and Edinburgh people are unusually highly qualified.
+1/−2
3.3
Sentiment Score Computation
To assign numerical scores to sentiments of an individ-ual sentence, we use the SentiStrength7
tool developed by Thelwall et al. [22]. This tool simultaneously assigns both a positive and a negative score to bits of English text, the idea being that users can express both types of sentiments at the same time, such as in “I love you, but I also hate you”. Pos-itive sentiment strength scores range from +1 (not posPos-itive) to +5 (extremely positive). Similarly, negative sentiment strength scores range from −1 to −5. The tool works by as-signing scores to tokens in a dictionary which includes com-mon emoticons. For example, “love” is mapped to +3/−1 and “stink” is mapped to +1/−3. Modifier words or sym-bols can boost the score such that “really love” is mapped to +4/−1 (the same for “love!!” or “looove”). The final pos-itive sentiment strength for a bit of text is then computed by taking the maximum score among all individual positive scores. The negative sentiment strength is similarly calcu-lated. Table 1 gives an example of a question, its answer, and the corresponding sentiment scores.
Fig. 3 (left) shows the distribution of sentiment scores given to sentences in answers. The vast majority of sentences are assigned a neutral +1/−1 sentiment score (58.26%). Slightly negative (+1/−2) and slightly positive (+2/−1) scores are also common (6.04% and 15.87%, respectively). Sentences with very strong sentiments, having either a posi-tive score of +4 or higher or a negaposi-tive score of −4 or lower, make up merely 4.18% of the total sentence volume.
3.4
Metrics: Attitude and Sentimentality
Before introducing the metrics of attitude and sentimen-tality, we introduce some notation. We use qj, sℓ, Ak, Aj,
Ki, and Rito represent the basic types in our data: a
ques-tion, a particular sentence within an answer, an answer given to a question, the set of answers given to question qj, an
asker, and an answerer, respectively. We also use notation Sk, Qi, and Pi to denote the set of sentences in A
k, the
set of questions posted by asker Ki, and the set of answers
posted by answerer Ri, respectively. Positive and negative
sentiment scores generated by the sentiment analysis soft-ware for a given question qj are denoted by ϕ+(qj) and
ϕ−
(qj). Similarly, ϕ+(sℓ) and ϕ−(sℓ) denote the positive
and negative sentiment scores for a given sentence sℓ.
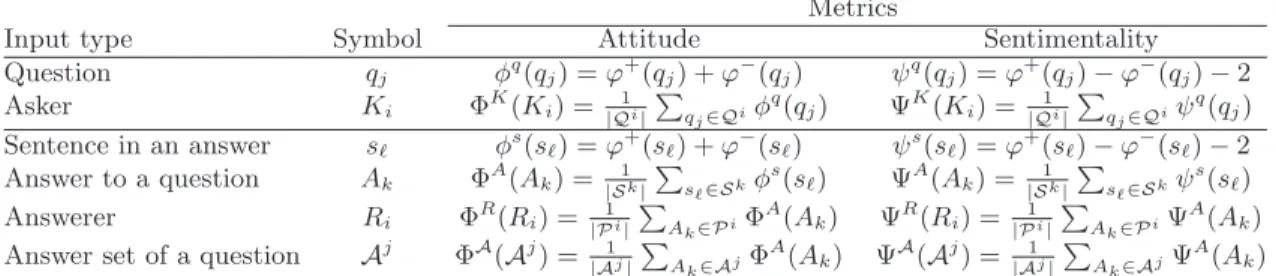
Based on this notation, we now define the attitude and sentimentality metrics. The attitude metric computes the inclination towards positive or negative sentiments. The sen-timentality metric computes the amount of sentiments. In a sense, the former metric indicates the sign of sentiments while the latter indicates their magnitude. These metrics are computed by the formulas shown in Table 2, for
differ-7
Table 2: The formulas used for computing the attitude and sentimentality metrics Metrics
Input type Symbol Attitude Sentimentality
Question qj φq(qj) = ϕ+(qj) + ϕ−(qj) ψq(qj) = ϕ+(qj) − ϕ−(qj) − 2 Asker Ki ΦK(Ki) =|Q1i| P qj∈Qiφ q(q j) ΨK(Ki) =|Q1i| P qj∈Qiψ q(q j) Sentence in an answer sℓ φs(sℓ) = ϕ+(sℓ) + ϕ−(sℓ) ψs(sℓ) = ϕ+(sℓ) − ϕ−(sℓ) − 2 Answer to a question Ak ΦA(Ak) = |S1k| P sℓ∈Skφ s(s ℓ) ΨA(Ak) = |S1k| P sℓ∈Skψ s(s ℓ) Answerer Ri ΦR(Ri) =|P1i| P Ak∈PiΦA(Ak) ΨR(Ri) = |P1i| P Ak∈PiΨA(Ak)
Answer set of a question Aj
ΦA (Aj) = 1 |Aj| P Ak∈AjΦ A(A k) ΨA(Aj) = |A1j| P Ak∈AjΨ A(A k) ! " # $ % !% !$ !# !" !! &'& &'$ &'" &'( ! )*+,-./012./0 345,-./012./0 !
678901:/,:;,-./0./9.-Y! Answers Ciao MySpace TwitterSlashdot Y! News 0.00 0.16 0.32 Attitude 0.32 0.64 0.96 Sentimentality Average
Figure 3: Distribution of sentiment scores for sen-tences in answers (left), average attitude and senti-mentality for different web datasets (right).
ent fields of the data: question, asker, sentence in an answer, answer, answerer, and set of answers to a question. All re-sults in the rest of the paper are reported by averaging the metrics shown in Table 2. At the beginning of each section, we indicate the specific formula we used in the experiments related to that section.
4.
CAVEATS
4.1
Inferring Demographics
Certain online user attributes (e.g., race) can be inferred by aggregating real-life data, obtained from online Web re-sources. In our work, we aggregate the online data of people living in a region with a specific ZIP code to infer certain attributes of Yahoo! Answers users who provided the same ZIP code. Obviously, this kind of an inference can be quite noisy, especially if the demographical classes within a ZIP code are uniformly distributed (e.g., almost equal number of males and females in every ZIP code) or if the distribution of classes across the ZIP codes is highly skewed (e.g., very few regions where the Asians are the dominant race). We believe that the education level and income attributes, which we in-fer based on ZIP codes, are relatively less error-prone in this respect as the distribution of these attributes are typically neither uniform within a ZIP code nor very skewed across different ZIP codes.
4.2
Sentiment Analysis
We use sentiment analysis as the main technique to quan-tify the attitude and sentimentality. Obviously, there is no perfect sentiment analysis tool to date. The tool we use in-deed performs a simple syntactical analysis over sentences rather than a sophisticated semantic analysis. However, we still hope the erroneous cases to be minimal as the accuracy of the tool has been shown to be good enough in another
do-main [22]. Moreover, the vast amount of data we use helps supporting the significance of the reported results.
4.3
User Bias
We emphasize that our results cannot be generalized to the entire population of the world as the user sample we have in our data may have a biased distribution. In partic-ular, certain demographic classes may be under represented in the Internet. Even if they are represented in the Internet with similar likelihood, their distribution in Yahoo! Answers may be skewed. Finally, although they might be equally well presented in Yahoo! Answers, the rate at which they contribute to the posts may differ. Consequently, our find-ings are limited to the Yahoo! Answers users who actively participate in the questions and answers.
4.4
Site Bias
The generalizability of our results to other web sites may be questioned. To reveal any potential bias, we compute the attitude and sentimentality metrics over six web datasets,8
each with different characteristics. The selected datasets in-clude questions and answers from Yahoo! Answers, movie reviews from Ciao, forum discussions from MySpace, short messages from Twitter, comments on news-related posts from Slashdot, and news in English from Yahoo! News. For this experiment, we randomly sample 40K sentences from each dataset and compute the attitude and sentimentality metrics by averaging the respective scores over all sentences. According to Fig. 3 (right), the Ciao dataset has the most positive attitude and a relatively higher sentimentality. The most negative attitude is observed in the Slashdot dataset. The Yahoo! Answers dataset stands very close to the average over all datasets, in terms of both the attitude and sentimen-tality metrics. This observation further justifies our use of Yahoo! Answers as a representative data source.
5.
FEATURE ANALYSIS
We group the features used in our analysis under five head-ings: textual, topical, demographical, spatial, and temporal features (Table 3). All features are extracted from both questions and answers, except for the textual features, which are only extracted from questions. The rest of the section in-vestigates the correlation of the extracted features with the previously defined attitude and sentimentality metrics. Due to space constraints, a detailed analysis of certain features is omitted. We note that, in all results presented in the pa-per, we report only the findings that are statistically signifi-cant according to a two-tailed t-test for equality of means at
8
Table 3: Summary of extracted features
Applicable to
Type Feature Range Question Answer
Textual
Question length N
Yes No
# of ? symbols N
# of ! symbols N
First word String
Topical Top category 1–26 Yes Yes
Leaf category 1–1676 Demog. Gender {M, F} Yes Yes Age N Race {A, B, W} Income R+ Educ. degree 0-100% Experience N
Spatial ZIP code 00000–99999 Yes Yes
Temporal Month 1–12 Yes Yes Day of month 1–31 Day of week 1–7 Hour of day 1–24 0.08 0.16 0.24 Attitude 0.48 0.56 0.64 0.72 Sentimentality 5 10 15 20
Question length (in words)
Volume 0.08 0.16 0.24 0.32 0.40 Attitude 0.56 0.64 0.72 0.80 0.88 0.96 Sentimentality 1 2 3 4 5 6 7 8 9 10
Number of question marks
Volume
Figure 4: Attitude and sentimentality as the ques-tion’s length (left) and the number of question marks it contains (right) increases.
the 95% confidence level. Similarly, we only display results where all of the three pairs (maximum, median), (maximum, minimum), and (median, minimum) differ at the 95% confi-dence level or above. This ensures that the reported results are “meaningful” and not merely noise.
5.1
Textual Features
The results reported in this section are obtained by aver-aging the φq and ψqvalues over all questions.
Question length. The sentimentality correlates posi-tively with the question length in words (Fig. 4 (left)). This is somewhat expected as the probability of having sentimen-tal words increases as new words are added to the question.9
Interestingly, however, the attitude demonstrates a decreas-ing trend. This might suggest that shorter questions are more likely to contain positive sentiments and negative sen-timents are more common in longer questions.
Number of question marks. We observe relatively higher sentimentality and attitude in questions that con-tain multiple question marks (Fig. 4 (right)). Both metrics reach a maximum value when there are three or four ques-tion marks in the quesques-tion. This increase is simply because of question titles that contain multiple question sentences (remember that we do not split questions into sentences).
9
Recall that the sentiment scores of a sentence are cumu-lated by taking the maximum over the words in the sentence. Hence, scores are not normalized by the sentence length.
Table 4: Attitude and sentimentality for the most popular question starting words
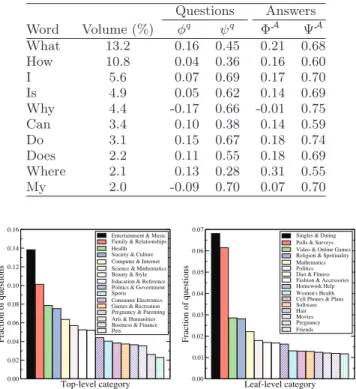
Questions Answers Word Volume (%) φq ψq ΦA ΨA What 13.2 0.16 0.45 0.21 0.68 How 10.8 0.04 0.36 0.16 0.60 I 5.6 0.07 0.69 0.17 0.70 Is 4.9 0.05 0.62 0.14 0.69 Why 4.4 -0.17 0.66 -0.01 0.75 Can 3.4 0.10 0.38 0.14 0.59 Do 3.1 0.15 0.67 0.18 0.74 Does 2.2 0.11 0.55 0.18 0.69 Where 2.1 0.13 0.28 0.31 0.55 My 2.0 -0.09 0.70 0.07 0.70 !"#$%&'&%()*+&,"-. /0// /0/1 /0/2 /0/3 /0/4 /05/ /051 /052 /053 6-*)+7"8("9(:;&<+7"8< =8+&-+*78>&8+(?(@;<7) 6*>7%.(?(A&%*+7"8<B7#< C&*%+B D")7&+.(?(E;%+;-& E">#;+&-(?(F8+&-8&+ D)7&8)&(?(@*+B&>*+7)< G&*;+.(?(D+.%& =H;)*+7"8(?(A&9&-&8)& I"%7+7)<(?(J"'&-8>&8+ D#"-+< E"8<;>&-(=%&)+-"87)< J*>&<(?(A&)-&*+7"8 I-&,8*8).(?(I*-&8+78, K-+<(?(C;>*87+7&< G;<78&<<(?(678*8)& I&+< !"#$%&"'"&()#*"+,-. /0// /0/1 /0/2 /0/3 /0/4 /0/5 /0/6 /0/7 8-#)*9,:(,$(;<"=*9,:= >9:+&"=(?(@#*9:+ A,&&=(?(><-'".= B9C",(?(D:&9:"(E#F"= G"&9+9,:(?(>H-9*9<#&9*. I#*J"F#*9)= A,&9*9)= @9"*(?(89*:"== 8#=J9,:(?(K))"==,-9"= L,F"M,-N(L"&H O,F":P=(L"#&*J Q"&&(AJ,:"=(?(A&#:= >,$*M#-" L#9-I,'9"= A-"+:#:). 8-9":C=
Figure 5: Most popular top-level (left) and leaf-level (right) categories.
Interestingly, however, the further increase in the number of question marks results in a decrease in the metrics.
Starting words. Table 4 shows the attitude and senti-mentality of questions with the most popular starting words, listed in decreasing order of popularity. According to the table, the only words with negative attitude are “Why” and “My” while the rest imply mostly positive attitude. In terms of sentimentality, questions starting with words “What”, “How”, “Can”, and “Where” have the lowest sentimentality. In general, we observe that questions seeking information have lower sentimentality than those asking for opinions.
5.2
Topical Features
The results reported in this section are obtained by aver-aging the φqand ψqvalues of questions and also by averaging
the φA and ψA values of answers under specific categories.
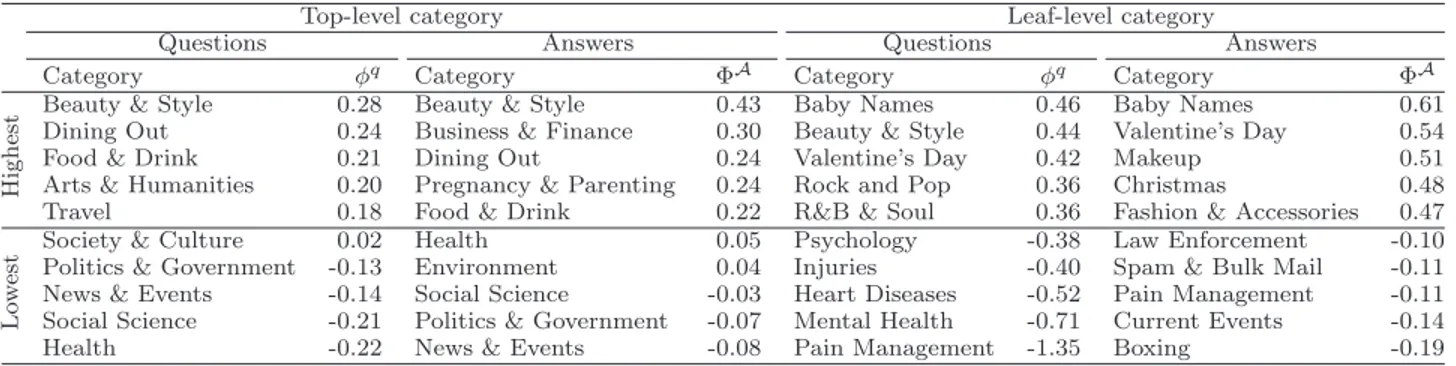
Category. Fig. 5 shows the distribution of questions posted in the 16 most popular top-level and leaf-level cat-egories. Table 5 shows the categories with the highest and lowest attitude, both for questions and answers. Similarly, Table 6 shows the categories with the highest and lowest sentimentality, again both for questions and answers. These results indicate that both the attitude and sentimentality of questions and answers are highly influenced by the category in which they are posted.
Since the dependence of the attitude and sentimentality on the topic is so pronounced, we test whether the topical differences induce all other differences. That is, we test if the differences between classes can be fully explained by the fact that class members have different topical interests. To test this hypothesis, we look at demographic differences for the attitude, averaged over all sentences in the set of
an-Table 5: Highest and lowest attitude values for top-level and leaf-level categories
Top-level category Leaf-level category
Questions Answers Questions Answers
Category φ q Category ΦA Category φ q Category ΦA H igh est
Beauty & Style 0.28 Beauty & Style 0.43 Baby Names 0.46 Baby Names 0.61
Dining Out 0.24 Business & Finance 0.30 Beauty & Style 0.44 Valentine’s Day 0.54
Food & Drink 0.21 Dining Out 0.24 Valentine’s Day 0.42 Makeup 0.51
Arts & Humanities 0.20 Pregnancy & Parenting 0.24 Rock and Pop 0.36 Christmas 0.48
Travel 0.18 Food & Drink 0.22 R&B & Soul 0.36 Fashion & Accessories 0.47
L
o
w
est
Society & Culture 0.02 Health 0.05 Psychology -0.38 Law Enforcement -0.10
Politics & Government -0.13 Environment 0.04 Injuries -0.40 Spam & Bulk Mail -0.11
News & Events -0.14 Social Science -0.03 Heart Diseases -0.52 Pain Management -0.11
Social Science -0.21 Politics & Government -0.07 Mental Health -0.71 Current Events -0.14
Health -0.22 News & Events -0.08 Pain Management -1.35 Boxing -0.19
Table 6: Highest and lowest sentimentality values for top-level and leaf-level categories
Top-level category Leaf-level category
Questions Answers Questions Answers
Category ψ q Category ΨA Category ψ q Category ΨA H igh est
Family & Relationships 0.91 Family & Relationships 0.91 Pain Management 1.74 Poetry 1.02
Social Science 0.81 Social Science 0.83 Mental Health 1.25 Mental Health 0.97
Health 0.68 Beauty & Style 0.78 Psychology 1.01 Singles & Dating 0.94
Society & Culture 0.62 Pregnancy & Parenting 0.78 Friends 0.95 Friends 0.92
News & Events 0.62 Business & Finance 0.76 Family & Relationships 0.95 Family & Relationships 0.91
L
o
w
est
Home & Garden 0.32 Cars & Transportation 0.48 Yahoo! Mail 0.19 Astronomy & Space 0.36
Business & Finance 0.32 Home & Garden 0.47 Embassies & Consulates 0.18 Biology 0.35
Consumer Electronics 0.32 Science & Mathematics 0.46 Packing & Preparation 0.17 Accounts & Passwords 0.35
Cars & Transportation 0.30 Local Businesses 0.46 Addr. Book & Calendar 0.17 Geography 0.32
Local Businesses 0.27 Comp. & Internet 0.45 External Mail 0.17 Yahoo! Mail 0.32
Table 7: Differences in demographical features on a per-topic basis
Topic Gender Age Race Ed. level
Beauty & Style 0.111 0.164 −0.049 0.028 Business & Fin. −0.025 0.119 0.010 −0.047 Arts & Human. 0.180 0.233 0.015 0.103 Pregn. & Parent. 0.154 0.172 −0.020 −0.081 News & Events 0.015 −0.018 0.036 −0.024 Games & Recr. 0.090 0.015 −0.008 −0.003 Science & Math. −0.001 0.103 0.018 0.034 swers, on a per-topic basis. Table 7 shows the difference of the average attitudes for a selection of topics. In the table, differences that are significant at the 1% level for a two-sided t-test for equality of means are indicated in bold font. The attitude differences correspond to the numerical difference for the attitude of each of the following demographic group pairs: female versus male genders, [10, 20] versus [70, 80] age intervals, Black versus White races, and [0%, 5%) ver-sus [50%, 55%) of population having a bachelor’s degree or higher. The main finding of this experiment is that topi-cal differences are not sufficient to explain the differences between demographic groups and that, even for the same topic, different groups express different sentiments.
5.3
Demographical Features
The results of this section are obtained by averaging the ΦK and ΨK
values of askers and also by averaging the ΦR
and ΨRvalues of answerers in a certain demographic group.
Gender. Our analysis suggest that women are more sen-timental when answering a question than men (on average, ΨR= 0.76 and ΨR= 0.66 for women and men, respectively).
We also observe that, in terms of attitude, men are more
0.04 0.08 0.12 Attitude 0.32 0.40 0.48 Sentimentality 10-19 20-29 30-39 40-49 50-59 60-69 70-79 80-89 Age interval Volume 0.12 0.16 0.20 Attitude 0.60 0.64 0.68 0.72 0.76 Sentimentality 10-19 20-29 30-39 40-49 50-59 60-69 70-79 80-89 Age interval Volume
Figure 6: Attitude and sentimentality based on askers’ (left) and answerers’ (right) age.
neutral, whereas women have more positive attitude in their answers (on average, ΦR
= 0.23 and ΦR= 0.13 for women
and men, respectively). We observe a similar behavior in the questions they post.
Age. Fig. 6 shows the attitude and sentimentality values for askers and answerers of varying age. We observe that, in general, the sentimentality decreases with increasing age. We also observe a trend towards negative attitude as the reported age of the user increases.
Race. We observe that users from predominantly Black ZIP codes have more neutral attitude values (on average, ΦR
= 0.19, ΦR
= 0.17, and ΦR= 0.19, for Asian, Black,
and White, respectively). Users from predominantly Asian ZIP code are less sentimental in both asking and answering among these race groups (on average, ΦR
= 0.67, ΦR= 0.71,
and ΦR= 0.72, for Asian, Black, and White, respectively). Education level. As the education level increases, the data suggest that the sentimentality of askers tend to
in-0.08 0.09 0.10 Attitude 0.47 0.48 0.49 0.50 0.51 Sentimentality 0-5 10-15 20-25 30-35 40-45 50-55 60-65 70-75 Bachelors degree (%) Volume 0.18 0.19 0.20 0.21 Attitude 0.70 0.71 0.72 0.73 0.74 Sentimentality 0-5 10-15 20-25 30-35 40-45 50-55 60-65 70-75 Bachelors degree (%) Volume
Figure 7: Attitude and sentimentality based on askers’ (left) and answerers’ (right) education level.
0.06 0.08 0.10 Attitude 0.42 0.44 0.46 0.48 0.50 Sentimentality 10 20 30 40 50 60 70 80 90 ZIP code (first two digits)
Volume
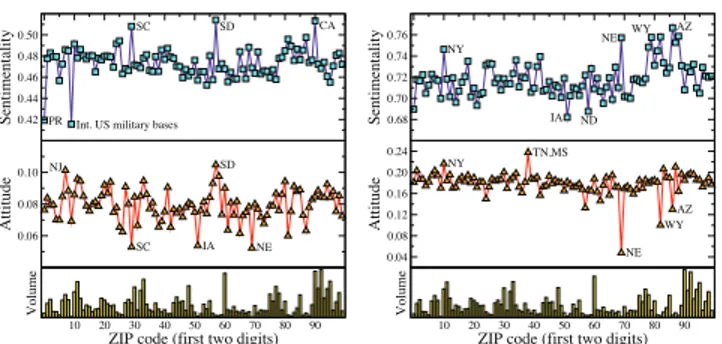
Int. US military bases PR SC SD CA SC IA NE SD NJ 0.04 0.08 0.12 0.16 0.20 0.24 Attitude 0.68 0.70 0.72 0.74 0.76 Sentimentality 10 20 30 40 50 60 70 80 90 ZIP code (first two digits)
Volume NY NE AZ WY IA ND TN,MS AZ WY NE NY
Figure 8: Attitude and sentimentality based on askers’ (left) and answerers’ (right) location. crease (Fig. 7). However, answerers become more neutral as education level increases. On the other hand, the attitude shows a similar increasing trend for both askers and an-swerers with increasing education level. Irregularities in the 55%–60% interval are due to the relatively high volume of users with the self-provided ZIP code 90210 (Beverly Hills).
5.4
Spatial Features
The results of this section are obtained by averaging the ΦK
and ΨK
values of askers and by averaging the ΦR and
ΨR values of answerers who reported a specific ZIP code. ZIP code. We do not observe a clear effect of the location on sentimentality. Hence, we only display the two-digit ZIP code prefixes and corresponding states where the highest and lowest sentimentality values are observed (Fig. 8).10 The
attitude distribution is not very conclusive either, but it gives some hints about the user profiles of certain states.
5.5
Temporal Features
The results in this section are obtained by averaging the ΦA and ΨA values of all answers posted in a specific time
interval. In all cases, the Eastern Time Zone11
is used as the timestamps in our data are in this timezone.
Month. The attitude and sentimentality show signifi-cant variation across the months. Answers posted during the summer and in the holiday season (i.e., December) have higher sentimentality and more positive attitude. Both the lowest sentimentality and attitude are observed in March.
Day of month. The variance over days of the month is very minor. Hence, we omit a discussion on this feature.
10Note that ZIP code prefixes typically correspond to
ge-ographically adjacent regions. See http://en.wikipedia. org/wiki/List_of_ZIP_code_prefixes. 11 http://en.wikipedia.org/wiki/Eastern_Time_Zone 0.116 0.120 0.124 0.128 Attitude 0.70 0.71 Sentimentality
Sun Mon Tue Wed Thu Fri Sat Day of week Volume 0.09 0.10 0.11 0.12 0.13 Attitude 0.69 0.70 0.71 0.72 Sentimentality 3 6 9 12 15 18 21 Hour of day Volume
Figure 9: Answers’ sentimentality and attitude ver-sus day of week (left) and hour of day (right).
Day of week. Interesting behaviors are observed for day of the week. Answers posted during the weekends and on Friday are more sentimental than those posted during the weekdays (Fig. 9 (left)). The attitude moves from positive to neutral as the days go from Sunday to Thursday. Then, it changes its trend on Friday and Saturday.
Hour of day. Sentimentality shows a slightly increasing trend during the day (Fig. 9 (right)). Especially, a sharper increase is observed between the 18:00 and 23:00 hours, fol-lowed by a decreasing trend throughout the night. The at-titude reaches its lowest value around 5:00 in the morning, which might correspond to an average of 3:00–4:00 on a na-tional level when correcting for the fact that we use the Eastern Time for all users.
6.
FURTHER ANALYSES
We determine five different concepts, for which we deepen our analysis on the attitude and sentimentality: topical con-text, class interaction, experience level, emotional congru-ence, and answer preference.
6.1
Topical Context
As mentioned in Section 5.2, the topical context plays an important role on the attitude and sentimentality of answers (Tables 5 and 6), i.e., the interpretation of a concept may dif-fer according to the context. The same concept may be men-tioned in a very positive sense in one category while the at-titude can be quite negative in another. As a representative example, in our sample, the opinions about “Tiger Woods” show high variation based on the context of the discussion.12
Questions about him receive answers with negative attitude in the News & Events (φs= −0.10) category, whereas the
an-swers are quite positive in the Sports (φs= 0.18) and Games
& Recreation (φs= 0.35) categories. We observe a neutral
attitude in Social Science (φs= −0.02) and Family &
Re-lationships (φs= 0.04) categories. We further quantify the
influence of the topical context in Section 7.
6.2
Class Interaction
Gender. We observe that the askers are more likely to receive answers from users with the same gender. Es-pecially, female askers receive most answers from other fe-males (%63.5). Female answerers have more positive atti-tude when the asker is a female (ΦR= 0.17). According to 12
In our case, opinions refer to sentences that include a named entity extracted with the Stanford CoreNLP tool (http://nlp.stanford.edu/software/corenlp.shtml).
!"!#" #"!$" $"!%" %"!&" &"!'" '"!(" ("!)" )"!*" !"!#" #"!$" $"!%" %"!&" &"!'" '"!(" ("!)" )"!*" !"+"& " "+"& "+! "+!& "+# "+#& "+$ ! ,-./01012.3450 ,.6012.3450 ! ,77879:0 !"!#" #"!$" $"!%" %"!&" &"!'" '"!(" ("!)" )"!*" !"!#" #"!$" $"!%" %"!&" &"!'" '"!(" ("!)" )"!*" "+& "+' "+( "+) "+* "+& "+' "+( "+) ! ,-./01012.3450 ,.6012.3450 ! 70-89:0-84;98<
Figure 10: Class interaction: Attitude (left) and sentimentality (right) of answers versus ages of askers and answerers.
0.10 0.12 0.14 0.16 0.18 Attitude 0.64 0.68 0.72 Sentimentality 20 40 60 80 100 120 140 160 180 Reputation score (x 100) Volume 0.08 0.12 0.16 Attitude 0.64 0.68 0.72 0.76 Sentimentality 20 40 60 80 100 120 140 160 180 Reputation score (x 100) Volume
Figure 11: Experience level: Attitude and sentimen-tality for questions (left) and answers (right) based on users’ experience.
our analysis, the lowest attitude is observed when both the asker and answerer are males (ΦR= 0.03).
Age. Younger people post and receive answers with a more positive attitude (Fig. 10). The attitude reaches the maximum when both the asker and answerer are less than 20 years old. In particular, people are likely to respond to people of the same age in a more positive manner. On the other hand, we do not observe a sentimentality change in answers given to different age groups.
Income. When both the asker and answerer are within the 30K–50K income range, the attitude of answers is slightly more positive. Otherwise, we do not observe any strong trend with the income level.
6.3
Experience Level
As discussed in Section 2.2, Yahoo! Answers awards points to its users for answering questions, with additional points being awarded for best answers. The total number of ac-cumulated points can hence be seen as an indicator of the experience of the user in the system. Herein, we try to un-derstand whether more experienced users differ in the sen-timents they express in their questions and their answers.
As far as the questions are concerned, we observe that users with very little or no experience tend to issue the most positive questions, with the attitude of the question decreasing with an increase in experience (Fig. 11 (left)). On the other hand, as the experience increases, answerers become less sentimental in their answers (Fig. 11 (right)). This may indicate a correlation between the experience and the objectivity of answerers. This is also supported by the observation that the attitude becomes less positive as the experience increases. ! " # $ % !% !$ !# !" !! !&'! &'& &'! %'& ! ()*+,-./01-./ 234+,-./01-./ ! 5//067/-! " # $ % !% !$ !# !" !! &'& &'! %'& %'! $'& ! ()*+,-./01-./ 234+,-./01-./ ! 4-./01-./560/7
Figure 12: Emotional congruence: Questions’ pos-itive and negative sentiments versus the attitude (left) and sentimentality (right) of received answers.
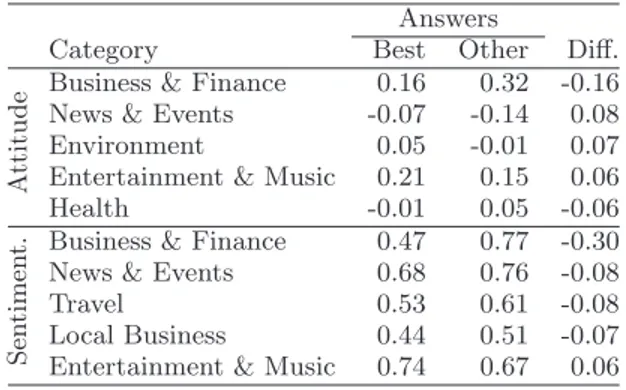
Table 8: Answer preference: Answers selected as the best answer differ from other answers in terms of both attitude and sentimentality
Answers
Category Best Other Diff.
A
tt
it
u
d
e Business & Finance 0.16 0.32 -0.16
News & Events -0.07 -0.14 0.08
Environment 0.05 -0.01 0.07
Entertainment & Music 0.21 0.15 0.06
Health -0.01 0.05 -0.06
S
en
timen
t. Business & Finance 0.47 0.77 -0.30
News & Events 0.68 0.76 -0.08
Travel 0.53 0.61 -0.08
Local Business 0.44 0.51 -0.07
Entertainment & Music 0.74 0.67 0.06
6.4
Emotional Congruence
Fig. 12 shows the attitude and sentimentality of answers that are posted in response to questions with different pos-itive and negative sentiment scores.13 In general, there is
a strong positive correlation between the sentimentality of initial questions and received answers. That is, highly senti-mental questions are more likely to receive very sentisenti-mental answers and vice versa. The way answers are created is also determined by the attitude of questions. More negative questions receive answers with negative attitude and vice versa, indicating a trend towards “emotional congruence” between the asker and the answerer.
6.5
Answer Preference
In general, the best answers, which are preferred over the other answers, have lower sentimentality (ΨA= 0.67 versus
ΨA= 0.71, on average). At the same time, the best answers
are more likely to be selected from answers with a more positive attitude (ΦA
= 0.16 versus ΦA= 0.14, on average).
For certain categories, the preference is even stronger (Ta-ble 8). As a striking example, in the Business & Finance category, the best answers are more inclined towards those with low sentimentality and neutral attitude. On the other hand, in the Entertainment & Music category, answers with higher sentimentality and more positive attitude seem to be preferred by the users.
13The data point (−5, 5) is omitted from the two plots due
Table 9: Feature importance
Feature Importance
Leaf-level category 100.0
Negative sentiment score 63.0 Positive sentiment score 39.7
Starting word 19.7 Number of ! symbols 12.0 Month 9.1 Question length 7.2 Gender of asker 6.7 Age of asker 3.7 Experience of asker 2.2
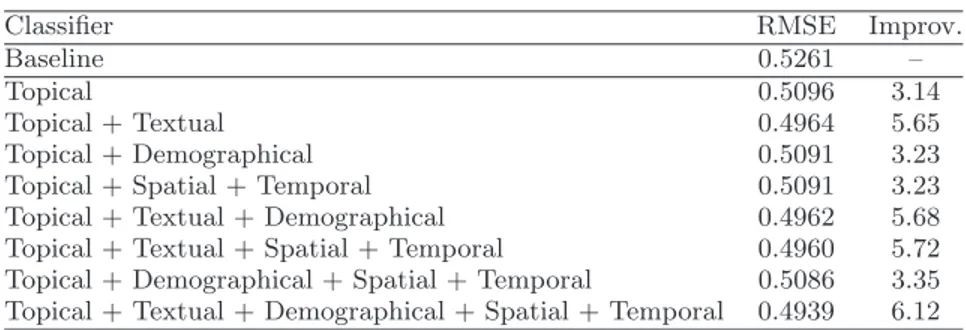
Table 10: Prediction performance
Classifier RMSE Improv.
Baseline 0.5261 –
Topical 0.5096 3.14
Topical + Textual 0.4964 5.65
Topical + Demographical 0.5091 3.23
Topical + Spatial + Temporal 0.5091 3.23
Topical + Textual + Demographical 0.4962 5.68
Topical + Textual + Spatial + Temporal 0.4960 5.72
Topical + Demographical + Spatial + Temporal 0.5086 3.35 Topical + Textual + Demographical + Spatial + Temporal 0.4939 6.12
7.
ATTITUDE PREDICTION
Is it possible to predict the attitude or sentimentality of the answers a particular question will attract before the an-swers are posted? Accurate prediction of attitude and senti-mentality can have different practical use cases. For exam-ple, questions that are predicted to generate high sentimen-tality can be boosted in visible areas (in the main page or as hot topics) to increase page views. As another example, questions that have the potential to lead to very negative attitude in answers may be sent to moderators, beforehand. Herein, we only focus on the problem of predicting the attitude in future answer posts. We formulate this particu-lar task as a machine learning problem. In general, this is a very challenging task as the only information comes from the question and the asker. Features about the answerer, which the previous sections found to be correlated with the attitude in the answer, are not used as they are not available until the answers are posted. In addition to the features in Table 3, we also extract and use positive and negative senti-ment scores of questions as features, which play a relatively important role in the prediction.14
In our task, the value we try to predict for each question instance is the average attitude of the answers given to a question, i.e., average ΦA
. We test the performance of the model over a dataset con-taining eight million question instances, obtained after filter-ing out questions whose askers’ demographics information is missing. We train our machine learning model using gradi-ent boosted decision trees [10, 27] and test on our data via 10-fold cross-validation.15 The 10 most important features,
as provided by the learning tool, are shown in Table 9. We adopt the root mean square error (RMSE) to evalu-ate the performance. As the baseline technique, we use a simple yet effective predictor which always predicts the av-erage attitude value observed in the training data. We build our classifier using different combinations of feature types to observe their individual contributions to the performance.
Table 10 shows the improvement, relative to the baseline, achieved by different classifiers trained with different combi-nations of feature types. When only the topical features are used, the prediction performance can be improved by 3.14%. Textual features also significantly improve the performance. The contributions of the asker’s demographics and spatio-temporal features are relatively low. When all features are used the classifier can improve the baseline by 6.12%.
14We place these two features under the textual features
cat-egory as they are obtained through text processing.
15In training, we set the number of trees to 40, the number
of leaf nodes per tree to 40, and the learning rate to 0.5.
8.
RELATED WORK
A large body of work so far have dealt with different as-pects of sentiment analysis, mainly sentiment extraction [1, 2, 7, 28], classification [8, 19, 25], retrieval [11, 12, 29], sum-marization [3, 17], and presentation [14]. The core applica-tion areas are finance [5, 7, 9], reviews [8, 19, 25], politics [16, 24], and news [13]. Herein, we omit a discussion of these works and focus only on works that are directly relevant to our work. Interested reader may refer to [18], for a detailed survey on sentiment analysis.
A large number of studies apply sentiment analysis to Twitter [4, 21]. These works differ from ours as they omit de-mographic factors and Twitter messages are explicitly writ-ten in a non-anonymous manner for mass consumption. The “We feel fine” project16
[15] is probably the most closely re-lated work. In that project, the authors use a large num-ber of blog posts and, wherever possible, annotate the posts with demographic information provided in public user pro-files as well as weather data for propro-files from which also the location could be extracted. The focus of their work is on interface design and on offering experimental data visualiza-tion. However, they also observe temporal patterns over the course of a day (lowest fraction of “joy” sentiments at night) and over the course of a week (high fraction of “relaxed” during the weekend). Similar to our finding, they observe a trend for older people to be less negative. As data mining is not their main focus, however, their quantitative findings are less comprehensive than ours and do not include features such as educational level or race in their analysis.
Apart from demographically annotated blogs, Facebook data is often used as it offers rich per-user profile informa-tion. Typically, sentiment analysis is applied to status mes-sages of users. It has been observed, for example, that users with a relationship status “in a relationship” or “married” are more likely to have a positive status message [6].
We note that neither Facebook status messages nor blog posts have the question-response interaction available in our data, which allows investigation of the effect of the original sentiment on the induced sentiments in answers. A tendency towards “emotion homophily” for comments left by friends on blogs is observed in [20]. The gender differences that we observed are independently observed in a small-scale study using MySpace blog posts [23]. Given that both blog posts and status messages on Facebook are not anonymous and written for explicit consumption by an ideally large group of people, it is surprising to see the general trends of sentiments to be re-confirmed in a question answering site.
16
9.
FUTURE WORK AND EXTENSIONS
Given that we observed significant differences concerning sentiments between different demographic groups, this could be used to “normalize” individual sentiments to obtain a bet-ter idea about deviations from the expected behavior. For example, a “pretty good” by an older person might be equiv-alent to an “absolutely amazing” by a teenager. The avail-ability of a topical classification makes it possible to differ-entiate sentiments attached to a particular entity according to the context. We plan to investigate this to obtain a more faceted representation of the opinions about an entity.
One interesting problem is to apply sentiment prediction techniques in other domains. For example, it would be inter-esting to predict the sentiments of comments left in response to a news article. Potentially, such techniques could even be used by blog writers to improve user engagement by provid-ing them with indications about how to make their posts more controversial. Similarly, we deem it interesting to gen-eralize our findings concerning the sentiments present in best answers to the more general problem of evaluating content quality. The presence/absence of sentiments in the text of, say, a news article might be an indication of its quality.
Finally, it seems promising to apply sentiment analysis to the content of pages from demographically annotated tool-bar histories. Such a combination may help to back up claims about general trends, such as women preferring more positive sentiments or a general drop of positive attitude in the early morning hours. It may also make it possible to combine the sentiment analysis with analysis about click-through rates and even properties of the clicked/ignored ads.
10.
ACKNOWLEDGMENTS
The authors thank Mike Thelwall for his kind support in making custom changes to the SentiStrength software. This work was partially supported by NSF grant, IIS-0546713 and by the Spanish Centre for the Development of Indus-trial Technology under the CENIT program, project CEN-20101037, “Social Media” (http://www.cenitsocialmedia.es)
11.
REFERENCES
[1] A. Abbasi, H. Chen, and A. Salem. Sentiment analysis in multiple languages: feature selection for opinion
classification in Web forums. ACM Trans. Inf. Syst., 26:12:1–12:34, 2008.
[2] X. Bai. Predicting consumer sentiments from online text.
Decis. Support Syst., 50:732–742, 2011.
[3] P. Beineke, T. Hastie, C. Manning, and S. Vaithyanathan. Exploring sentiment summarization. In Proc. AAAI Spring
Symp. Exploring Attitude and Affect in Text: Theories and
Applications, pages 1–4, 2004.
[4] J. Bollen, H. Mao, and A. Pepe. Determining the public mood state by analysis of microblogging posts. In Proc.
Alife XII Conf., pages 667–668, 2010.
[5] J. Bollen, H. Mao, and X. Zeng. Twitter mood predicts the stock market. J. Comput. Sci, 2:1–8, 2011.
[6] S. I. Calderon. Facebook shares new data on relationship status and sentiment, 2010.
http://www.insidefacebook.com/2010/02/15/
dr-facebook-is-in-people-in-relationships-are-happiest/. [7] S. R. Das and M. Y. Chen. Yahoo! for Amazon: sentiment
extraction from small talk on the Web. Manage. Sci., 53:1375–1388, 2007.
[8] K. Dave, S. Lawrence, and D. M. Pennock. Mining the peanut gallery: opinion extraction and semantic
classification of product reviews. In Proc. 12th Int’l Conf.
World Wide Web, pages 519–528, 2003.
[9] A. Devitt and K. Ahmad. Sentiment analysis in financial news: a cohesion-based approach. In Proc. 45th Annual
Meeting of the Assoc. for Computational Linguistics, pages
984–991, 2007.
[10] J. H. Friedman. Greedy function approximation: a gradient boosting machine. Ann. Stat., 29(5):1189–1232, 2001. [11] S. Gerani, M. J. Carman, and F. Crestani. Investigating
learning approaches for blog post opinion retrieval. In Proc.
31th Eur. Conf. Information Retrieval, pages 313–324,2009.
[12] S. Gerani, M. J. Carman, and F. Crestani. Proximity-based opinion retrieval. In Proc. 33rd Int’l ACM SIGIR Conf.
Research and Development in Information Retrieval, pages
403–410, 2010.
[13] N. Godbole, M. Srinivasaiah, and S. Skiena. Large-scale sentiment analysis for news and blogs. In Proc. Int’l Conf.
Weblogs and Social Media, 2007.
[14] M. L. Gregory, N. Chinchor, P. Whitney, R. Carter, E. Hetzler, and A. Turner. User-directed sentiment analysis: visualizing the affective content of documents. In
Proc. Workshop on Sentiment and Subjectivity in Text,
pages 23–30, 2006.
[15] S. D. Kamvar and J. Harris. We feel fine and searching the emotional web. In Proc. 4th ACM Int’l Conf. Web Search
and Data Mining, pages 117–126, 2011.
[16] S.-M. Kim and E. H. Hovy. Crystal: analyzing predictive opinions on the Web. In Proc. 2007 Joint Conf. Empirical
Methods in Natural Language and Computational Natural
Language Learning, pages 1056–1064, 2006.
[17] K. Lerman, S. Blair-Goldensohn, and R. McDonald. Sentiment summarization: evaluating and learning user preferences. In Proc. 12th Conf. European Chapter of the
Assoc. for Computational Linguistics, pages 514–522, 2009.
[18] B. Pang and L. Lee. Opinion mining and sentiment analysis. Found. Trends Inf. Retr., 2:1–135, 2008. [19] B. Pang, L. Lee, and S. Vaithyanathan. Thumbs up?:
sentiment classification using machine learning techniques. In Proc. 2002 Conf. Empirical Methods in Natural
Language Processing, pages 79–86, 2002.
[20] M. Thelwall. Emotion homophily in social network site messages. First Monday, 15(4-5), 2010.
[21] M. Thelwall, K. Buckley, and G. Paltoglou. Sentiment in Twitter events. J.Am.Soc.Inf.Sci.Techn., 62:406–418, 2011. [22] M. Thelwall, K. Buckley, G. Paltoglou, D. Cai, and
A. Kappas. Sentiment in short strength detection informal text. J. Am. Soc. Inf. Sci. Technol., 61:2544–2558, 2010. [23] M. Thelwall, D. Wilkinson, and S. Uppal. Data mining
emotion in social network communication: gender differences in MySpace. J. Am. Soc. Inf. Sci. Technol., 61(1):190–199, 2010.
[24] M. Thomas, B. Pang, and L. Lee. Get out the vote: determining support or opposition from congressional floor-debate transcripts. In Proc. Conf. Empirical Methods
in Natural Language Processing, pages 327–335, 2006.
[25] P. D. Turney. Thumbs up or thumbs down?: semantic orientation applied to unsupervised classification of reviews. In Proc. 40th Annual Meeting on Assoc. for
Computational Linguistics, pages 417–424, 2002.
[26] I. Weber and C. Castillo. The demographics of web search. In Proc. 33rd Int’l ACM SIGIR Conf. Research and
Development in Information Retrieval, pages 523–530,2010.
[27] J. Ye, J.-H. Chow, J. Chen, and Z. Zheng. Stochastic gradient boosted distributed decision trees. In Proc. 18th
ACM Conf. Information and Knowledge Management,
pages 2061–2064, 2009.
[28] J. Yi, T. Nasukawa, R. Bunescu, and W. Niblack. Sentiment analyzer: extracting sentiments about a given topic using natural language processing techniques. In Proc.
3rd IEEE Int’l Conf. Data Mining, pages 427–434, 2003.
[29] W. Zhang, C. Yu, and W. Meng. Opinion retrieval from blogs. In Proc. 16th ACM Conf. Information and