Policy Analysis
Jean Mercenier, C.R.D.E., Universite´ de Montre´al and THEMA, Universite´ de Cergy-Pontoise
Erinc¸ Yeldan, Department of Economics, Bilkent University
The technical difficulties associated with building and solving applied general equilib-rium (GE) models seem to have distracted our attention from the data. In this article, we forcefully stress that whatever the sophistication of the GE analysis, it is only worth the quality of the supporting data it utilizes. We first highlight an example of a flagrant flaw in officially published input–output data (factor–income shares) by an LDC (Turkey), which many researchers use without question. We then make use of an applied GE model to evaluate the dynamic gains for Turkey from currently debated trade policy options and compare the predictions using conservatively adjusted, rather than official, data on factor shares. We show that the predicted welfare gains are not only of a different order of magnitude, but in some cases, of a different sign; hence, suggesting contradictory policy
recommendations. 1999 Society for Policy Modeling. Published by Elsevier Science
Inc.
Key Words: Applied general equilibrium; Policy analysis; Development; Data; Turkey.
1. INTRODUCTION
It is well known that official data sources of many developing nations suffer from numerous defects, including missing data
Address correspondence to Jean Mercenier, THEMA, Universite´ de Cergy-Pontoise 33, Bd. du Port, 95011 Cergy-Pontoise, France.
We thank Irma Adelman and Tim Kehoe for constructive suggestions and discussions. The first version of the article was written while Mercenier was visiting the Research Department of the Federal Reserve Bank of Minneapolis, and Yeldan was visiting the Applied Economics Department of the University of Minnesota; the hospitality of those institutions is gratefully acknowledged. Mercenier also thanks the Social Sciences and Humanities Research Council (SSHRC) of Canada for financial support. The views ex-pressed herein are those of the authors, and not necessarily those of the Federal Reserve Bank of Minneapolis or the Federal Reserve System.
Received August 1997; final draft accepted February 1998.
Journal of Policy Modeling 21(7):851–873 (1999)
1999 Society for Policy Modeling 0161-8938/99/$–see front matter
points, dubious gathering techniques, and inconsistent definitions. Concerns about the lack of quality of the data sets available for policy analysis in LDCs recently motivated a symposium entitled “Data Base for Development Analysis,” published in the Journal of Development Economics. The primary recommendation of the group of experts was that “greater resources have to be provided internationally and nationally for improving data gathering and analytical capability of most developing countries. Policy analysis with the existing data base is fraught with potentially serious pit-falls” (Srinivasan, 1994a, p. 2).
Perhaps what is lacking in the aforementioned publication is a spectacular and provocative example of how even the most basic officially reported data can be (presumably more often than not) unquestionably erroneous, and how such flaws can render mean-ingless any quantitative policy analysis. Such an example can only have forcefully complemented recommendations “that are stated in a somewhat provocative language to stimulate discussion and possibly some corrective action” (Srinivasan, 1994b, p. 24), by addressing a clear message to policy modelers: whatever the so-phistication of the analysis, it is only worth the quality of the supporting data it utilizes. A refocus of attention on the data is particularly called for in applied general equilibrium (GE) analy-sis, where technical difficulties may have distorted our priorities in the past.
It is our aim in this article to provide one such example. More specifically, we highlight the fact that, according to the officially published Turkish input–output (I–O) data, the Turkish economy is highly capital intensive, with capital shares in value added close to 80 percent in most sectors. Such numbers are unquestionably inconsistent with current economic theory, and suggest substantial measurement errors. We then use an applied GE model of trade and production to evaluate the dynamic gains for Turkey from alternative trade policies and compare the model’s predictions under arbitrarily—although conservatively—adjusted, rather than official, data on factor shares. We report predicted welfare gains not only of a different order of magnitude, but in some cases, of a different sign; hence, suggesting contradictory policy recommen-dations.
Spectacular as it is, there is nothing pathological about this example. It is actually interesting in many different respects:
1. Although possibly not as good as India’s, Turkey’s statistical system of data collection, processing, and analysis is fairly
well developed, certainly more so than systems in most less-developed countries (LDCs). In terms of reliability, one can, therefore, expect Turkish official data to be above LDC averages.
2. Similar data have been used by many different authors, some from international institutions, without any mention of the
data problem.1
3. A large overstatement of the capital share in value added is not uncommon in LDC official statistics. Kehoe and Kehoe (1994, p. 18) have recently called attention to the fact that official Mexican sources report labor as generating only 30 percent of total factor income in Mexico. According to their investigation, many of the most influential applied GE assess-ments of the potential impact of the North American Free Trade Agreement (NAFTA) use these numbers without question. It is, therefore, hardly surprising that liberalizing capital flows has been predicted to generate large welfare gains for Mexico. In view of the unreasonably capital-inten-sive nature of the Mexican technology utilized for making these predictions, one should be suspicious of the likelihood that these welfare gains can be realized. Thus, Srinivasan’s accusing comments that “[u]nfortunately, it would appear that researchers either are not aware of or, worse still, have chosen to ignore the fact that the published data, national and international, suffer from serious conceptual problems, measurement biases and errors” (Srinivasan, 1994b, p. 4) should not be taken as an overstatement and should be paid due attention.
4. The example also highlights the potential danger of excessive international standardization in data processing and
defini-tions. It appears2 that the most likely explanation for the
unreasonably high share of capital income in Mexico is that,
1Among others, Ozmucur, 1991, Harrison, Rutherford, and Tarr, 1993, 1996, Santis,
1996, and Yeldan, 1995. A notable exception is Celasun, 1989, who identifies the problem and restricts his analysis accordingly. He warns about “the limited share of wage labor in total employment in interpreting the estimated factor shares in national income” (Celasun, 1989, p. 9). He argues that the historical series for the labor market have been altered each time a new 5-year development plan is drafted and that about 70 percent of total employment remains in the nonwage status, mainly in agriculture. Under such data limita-tions, he goes on to limit his analysis on “broad structural features and major proportional shifts over time” (Celasum, 1989, p. 5).
following U.S. practice, the earnings of self-employed labor are treated as capital rents. Although this may make sense in the United States where such remuneration is relatively small, it is obviously much more questionable in the Mexican context. The same explanation apparently applies to Turkey
as well.3 Similar expedient statistical treatment of
self-employed labor earnings could actually be quite widespread in LDCs.
5. The importance of systematic sensitivity analysis with respect to exogenously supplied parameter values is emphasized in the applied GE literature (e.g., Harrison et al., 1993). The example provided here suggests, however, that a critical as-sessment on the data underlying the calibrated parameters may be equally important if not potentially more so. 6. Last but not least—and worth stressing—we do not make
any assumption specific to the purpose at hand in designing the model structure and policy experiments reported in this article. The model builds on previous work on European integration (Mercenier and Akitoby, 1993; Mercenier, 1995a) using sound modern trade theory, and the policy issue under focus—whether it is advisable for Turkey to trade integrate with Europe—is currently one of the most actively debated questions in that country.
This article is organized as follows. Section 2 states the data problem. The policy questions and the applied GE framework are introduced in Section 3. Evidence is documented in Section 4 that trade policy prescriptions offered using the flawed data are potentially wrong. Section 5 is reserved for concluding comments. Some details on the data base, the model structure, the calibration, and the computational strategy are provided in the Appendix. 2. THE DATA PROBLEM
Turkey’s I–O data have been published at irregular, yet quite frequent, intervals by the State Institute of Statistics (SIS) with remarkably short lags; for instance, the most recent 1990 I–O
data were published by early 1994.4Clearly, this commitment to
frequent and rapid publication of economic data by the Turkish
3According to M. Celasun, personal communication.
4For the sake of comparison, the latest I–O data officially published in Belgium are
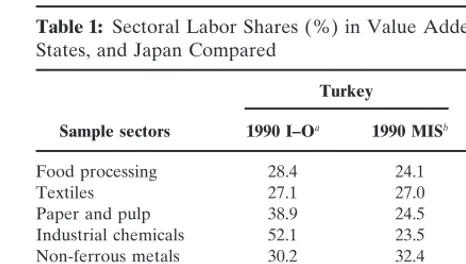
Table 1: Sectoral Labor Shares (%) in Value Added: Turkey, the United States, and Japan Compared
Turkey United States Japan
Sample sectors 1990 I–Oa 1990 MISb 1985c 1985c
Food processing 28.4 24.1 49.9 57.7
Textiles 27.1 27.0 80.9 74.8
Paper and pulp 38.9 24.5 64.4 59.2
Industrial chemicals 52.1 23.5 65.0 45.3 Non-ferrous metals 30.2 32.4 84.4 50.7 Metal products 28.4 22.0 72.0 66.6 Machinery (except electrical) 31.3 31.9 79.3 57.9 Electrical machinery 35.1 22.3 79.2 55.8 Transport equipment (vehicles, etc.) 45.2 30.6 82.3 57.9
Average for the
whole economy 32.4 20.3 49.6 66.1
aInput–Output tables. Source: SIS 1994.
bManufacturing industry survey. Source: SIS 1995.
cSource: MITI 1989. (We thank Hiro Lee for generously providing these numbers.)
authorities reflects a strong political willingness to foster discussion of important economic policy issues facing the nation. It also demonstrates a fairly sophisticated state of the data collection and processing technology. Yet, even the most basic data are repeatedly reported with obviously large biases and are regularly used without question by economists and researchers of the Turk-ish economy. Table 1 shows the share of wages and salaries in aggregate value added as they officially appear in the I–O tables for 1990 (SIS, 1994) and the Manufacturing Industry Survey for 1990 (SIS, 1995). Although the original sources distinguish 64 sectors of production, to conserve on space, we report here only the numbers for a few important representative activities and for the economy as a whole. The two sources report sizable differ-ences, but consistently reveal unexpectedly low values: on average 32 percent in the former, and 20 percent in the latter. Similar orders of magnitude are obtained from other sources, such as the Chamber of Industry Surveys of the 500 largest Industrial Firms. The SIS also published data on income distribution based on household income surveys, which has a wider coverage. The most
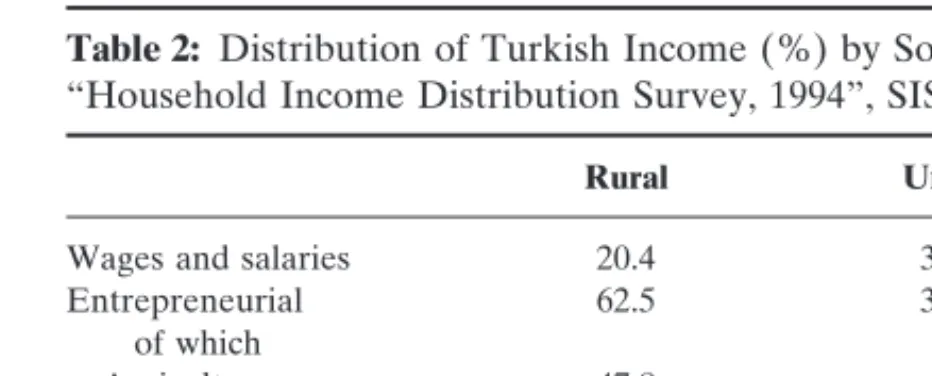
Table 2: Distribution of Turkish Income (%) by Sources as Reported by the “Household Income Distribution Survey, 1994”, SIS (1996)
Rural Urban Aggregate
Wages and salaries 20.4 32.0 25.3
Entrepreneurial 62.5 33.2 42.4 of which Agriculture 47.8 2.6 16.7 Manufacturing 2.1 5.4 4.4 Construction 0.4 2.4 1.7 Commerce 8.9 16.8 14.4 Services 3.3 6.0 5.2 Assets, securities 7.7 24.5 22.3 Unrequited 9.4 10.3 10.0
recent data are suggestive of similar magnitudes. In Table 2, we report sources of household income by functional categories. The tendency for the low share of labor is obvious when remunerations are measured only as “wages and salaries.” These numbers clearly suggest that a portion of labor’s income is being recorded under “entrepreneurial” and “unrequited” income sources.
Clearly, if one were to accept the officially published data at face value and characterize neoclassical production technologies accordingly, the Turkish economy would be two to three times more capital intensive than the U.S. or the Japanese economy (see Table 1). Turkey would be avidly trading capital-intensive goods for Japanese or U.S. labor-intensive commodities! It is difficult to imagine how even heroic departures from neoclassical assumptions could be consistent with such numbers. There can be no doubt that the definitions used by Turkish statisticians differ substantially from those used by economists. In their current raw form, these data are clearly unfit for economic analysis, as will be shown in a later section.
After this article was written, Kose and Yeldan (1996) attempted to remedy this problem. They introduced a database that incorpo-rates a categorization of labor as the “formal” and “informal” types. While the labor belonging to the former labor category earns officially recorded wages and salaries, the latter category earns income from the self-employed, and the family employment units of small-scale production. These income sources were generated from the SIS data. This data set is observed to significantly reduce the aforementioned bias; nevertheless, the share of capital in value
added is still observed to remain puzzlingly high in some sectors (another display of the Leontief paradox?; a result of the import-substitution policies as argued, among others, by Balassa, 1983?). 3. THE POLICY QUESTIONS AND
ANALYTICAL FRAMEWORK
Turkey has long held aspirations of becoming a full member of the former European Economic Community (EEC), now the
European Union (EU).5Despite the rejection of its official
reappli-cation for full membership in April 1987, Turkey pursued its trade liberalization efforts vis-a`-vis the EEC by reducing its sectoral tariffs on its European imports annually. In March 1995, both sides agreed to harmonize the Turkish tariff structure with that of the EU in a customs union that was put in effect in January 1996. Not surprisingly, therefore, Turkish policy makers are keen to understand how and by how much the completion of the European Single Market will affect the Turkish economy. In this new interna-tional environment, the Turkish authorities face, among others, two important and actively debated questions: (a) is a complete tariff elimination vis-a`-vis European partners welfare-improving? Or could such a policy be undesirable because of strongly distorted domestic markets? (b) If Turkey were to join the European Single Market today—which would imply the elimination of all forms of tariff and non-tariff barriers to trade with Europe—how important would the induced intersectoral and intertemporal resource reallo-cations be? And how welfare improving would such a policy be for the country?
To answer these questions quantitatively, we introduce Turkey into the multicountry, multisector applied GE model built by Mer-cenier (1995a) to study European integration issues. This model recognizes that in some manufacturing sectors, firms use increasing returns to scale technologies and behave as Cournot oligopolies, producing differentiated goods. We embed this detailed structure into an optimal growth framework along the lines of Mercenier
5Turkey’s first official application to join the EEC was made as early as 1959. This led
to the 1963 Ankara Agreement and the 1970 Added Protocol, which provided a specific blueprint of adjustment toward harmonization of the Turkish economy with its European counterparts. The relations suffered a stalemate between 1980 and 1986, as a result of the military coup of September 1980.
and Akitoby (1993), and we make use of recent theoretical results on dynamic aggregation by Mercenier and Michel (1994a) to ap-prehend transitional dynamic effects. To conserve on space, here we only provide an overview of the model structure (see Mercen-ier, 1995a, 1995b, and the appendix for details).
Turkey is part of a world economy consisting of itself and six other regions: Great Britain, the Federal Republic of Germany, France, Italy, the rest of the EU, and the rest of the world. Each country has nine sectors of production, of which four are perfectly
competitive.6 In these sectors, countries are linked by an
Arm-ington system so that commodities are differentiated in demand by their geographical origin. The other five industries are modeled
as noncompetitive.7In the latter sectors, firms are assumed to be
symmetric within national boundaries. They operate with fixed primary factor costs, and therefore, face increasing returns to scale in production. They have no monopsony power on any market for inputs, either primary or intermediate. Each individual oligopolist produces a different good. Industry structure is assumed fixed in the short run; oligopolistic firms may then experience nonzero profits. In the long run, however, entry and exit of competitors in a Chamberlinian fashion ensure that these rents vanish. The competitive game between oligopolistic firms is assumed to be Nash in the volume of sales. The instantaneous GE concept adopted is a compromise in terms of informational requirements between the primitive conjectural Cournot-Nash-Walras equilib-rium of Negishi (1961), and the objective Cournot-Nash-Walras
equilibrium introduced by Gabszewicz and Vial (1972).8 In all
sectors, competitive and noncompetitive, a detailed country- and sector-specific system of price-responsive intermediate demands is specified that recognizes differences among products from indi-vidual oligopolistic suppliers a` la Ethier (1982).
6The four perfectly competitive sectors are agriculture and primary products; food,
beverage, and tobacco; other manufacturing industries (textile, wood, paper, metallurgy, and minerals); and transport and services.
7The noncompetitive industries are pharmaceutical products; chemistry other than
pharmaceutical products; motor vehicles; office machinery; and other machinery and trans-port materials.
8Noncompetitive firms are endowed with full knowledge of the preferences and
technol-ogies of their clients, and they make use of this knowledge when maximizing profits. In their maximization, however, they neglect the feedback effect of their decisions on their profits via income (the Ford effect, see Gabszewicz and Vial, 1972) and via input–output multipliers (the Nikaido effect, see Nikaido, 1975).
Final demand decisions are made in each country by a single representative household that is competitive, infinitely lived, and utility maximizing. The domestic household owns all the country’s primary factors, namely, labor and physical capital, which it rents to domestic firms only, at the same competitive price regardless of the sector. In the short run, however, total returns to capital may differ across industries: oligopolistic profits may add to capital rental earnings because of unexpected shocks. We abstract from leisure/labor decisions and population growth so that the variables under household control are consumption and investment. In mak-ing optimal decisions subject to their intertemporal budget con-straints, households can borrow or lend on international markets. All final demands recognize differences among products from individual oligopolistic firms a` la Dixit and Stiglitz (1977).
The only explicit role of the government is to raise tariffs, the proceeds of which are rebated to domestic consumers lump sum. National markets are assumed to be segmented in the initial equilibrium: because of various more or less pernicious forms of non-tariff barriers (NTBs)—such as norms, government procure-ment policies, security regulations—that prevent consumers from crossborder arbitraging, noncompetitive firms behave as price-discriminating oligopolists. Following Smith and Venables (1988), we implement the completion of the European Single Market by forcing firms to adopt a single pricing rule within Europe, determined on the basis of their average EU-wide monopoly power. The elimination of the possibility for firms to discriminate among client countries within the EU is interpreted as resulting from the removal of the NTBs underlying the initial price spread. Central to our analysis is the measure of welfare gains, which
we now make precise. Let Cˆ (t) be the reference stream of
con-sumption, and C(t) be the corresponding time profile computed
after implementation at t5 0 of a (previously unexpected) trade
policy change. The welfare gain is measured by the index φ deter-mined from the following utility indifference condition:
#
0∞e 2rt[Cˆ (t) (1 1 φ)] 12g 12 g dt5#
∞ 0e 2rtC(t) 12g 12 gdt .(wherer is the discounted rate and g is the inverse of the
intertem-poral substitution elasticity).9 That is, the welfare gain resulting
9We adopt the same parameter values as in Mercenier and Akitoby (1993):r 5 7.5%
from the policy change is equivalent from the perspective of the representative Turkish household to increasing the reference con-sumption profile by φ percent. The measure φ accounts for both transitional and long-term effects of the policy on the household’s well-being, putting relatively low weight on the latter because of discounting. It is sometimes useful to restrict the welfare analy-sis to steady-state effects, in particular when making compari-sons with predictions from static models. To do this, we define limt→∞Cˆ (t) 5 Cˆss, limt→∞C(t) 5 Css, and we plug these constant
values into the utility indifference condition. Rearranging, we get
Cˆss(11 φss)5 Css,
where φssis the (equivalent variation) welfare measure most
fre-quently used in static applied GE analysis.
4. UNRELIABLE POLICY PRESCRIPTIONS FROM FLAWED DATA
Nominally at least, the European Single Market has been com-pleted since January 1993. In practice, of course, the program will take some time to become fully implemented, and indeed longer still before its effects can be observed in the data. Our first task, therefore, is to simulate the likely consequences of the European integration effort, that is, to set the new international environment in which Turkey has to make its future policy decisions. We do this simulation for two alternative characterizations of the Turkish production technologies, which we refer to as specifications 1 and 2. In the first, we calibrate using the officially published factor shares, whereas in the second, we use 50 percent downwardly adjusted
capital-income shares.10
As one could have expected, the effects on the Turkish economy of intra-European trade integration are extremely mild, and this is true whichever specification is used. To conserve space, we, therefore, do not dwell on the predominantly European issue, and we refer to Mercenier (1995a) for extensive discussion. We report here only the welfare effects φ, which are
slightly negative with both specifications: respectively,20.07 and
20.05 percent. These two solutions serve as competing bench-marks against which Turkish trade options are to be evaluated.
10Note from Table 1 that this adjustment, although in appearance quite drastic, still
The first policy option we consider is the elimination of all tariffs on imports from Europe. Table 3 shows the solution time profile of major aggregate variables. See also Figure 1. Under both technology specifications, trade liberalization induces a strong deterioration of the terms of trade, which shifts the profile of consumption downward. The wealth contraction is milder in the first case. Investment increases over the whole time horizon, how-ever, despite the negative wealth shock. This is because consumers find it optimal to substitute future for current consumption, more so the more capital intensive the technology is, because investment then yields higher returns. Hence, production capacities increase monotonously with the first specification, whereas with the second specification, the capital stock overshoots its new steady-state level during the transition. As a result, the long-term supply of capital services increases by 4.3 and 1.5 percent, respectively. Rationaliza-tion of imperfectly competitive industries generates long-term ag-gregate efficiency gains (i.e., real cost savings achieved due to increased scale on initial output) by 3.7 and 2.8 percent. Despite these common features, the long-term effects of the policy are qualitatively different: the trade liberalization boosts consumption
upward by half a percentage point (φss 5 0.59%) with the first
specification, while cutting consumption by a similar amount
(φss 5 20.42%) with the second specification. Hence, based on
steady-state welfare, the recommendation built on official data is to eliminate tariffs on European imports—a policy actually re-cently adopted by Turkey—yet, implementation of more realistic technologies suggests that such a policy is not desirable. Reassur-ingly, if transitional dynamics are taken into account in the welfare analysis, the contradiction disappears. This is because the long-term increase in consumption predicted when unadjusted technol-ogies are used is too small to compensate for the transitional costs, so that to be indifferent between the initial and the tariff-free equilibria, the Turkish household would need to be compensated by an amount equivalent to 0.66 percent of its consumption flow
over the whole time horizon (φ5 20.66%; with adjusted factor
shares, φ5 20.91%).
If Turkey were to join the European Single Market, it would have to get rid not only of tariffs but also of all forms of nontariff barriers. Table 4 and Figure 2 summarize the findings. Observe how little the elimination of NTBs affects the time profile of aggregate variables. Yet, the overall impact on the economy is
Table 3: Elimination of All Tariffs on European Goods (% Deviations From Benchmark) Time Wage Rental rate Price of Price of Capital Terms of Aggregate (years) rate of capital consumption Consumption investment Investment stock trade efficiency Specification 1: Technologies calibrated on official factor shares (welfare gains: φ 52 0.66%) 1 2 7.33 2 7.18 2 8.91 2 2.15 2 9.74 10.92 0.00 2 8.70 2 4.76 5 2 7.25 2 8.60 2 9.68 2 1.33 2 10.44 9.85 1.56 2 9.47 2 2.56 10 2 7.49 2 9.94 2 10.48 2 0.45 2 11.15 6.24 2.74 2 10.26 2 0.63 20 2 7.65 2 10.98 2 11.04 0.18 2 11.64 4.93 3.74 2 10.80 1.48 35 2 8.01 2 11.72 2 11.40 0.59 2 11.94 4.26 4.26 2 11.15 3.69 Specification 2: Technologies calibrated on adjusted factor shares (welfare gains: φ 52 0.91%) 1 2 8.01 2 7.97 2 9.52 2 1.67 2 10.30 4.21 0.00 2 9.30 2 4.19 5 2 8.12 2 9.97 2 10.08 2 1.05 2 10.80 3.21 1.93 2 9.87 2 2.35 10 2 8.38 2 10.79 2 10.37 2 0.74 2 11.05 2.24 2.53 2 10.15 2 1.19 20 2 8.87 2 11.07 2 10.51 2 0.57 2 11.16 1.74 2.26 2 10.32 0.40 35 2 9.65 2 11.22 2 10.65 2 0.42 2 11.28 1.55 1.55 2 10.51 2.85
Figure 1. Elimination of all tariffs on European goods.
Table 4: Full Integration in the European Single Market (% Deviations From Benchmark) Time Wage Rental rate Price of Price of Capital Terms of Aggregate (years) rate of capital consumption Consumption investment Investment stock trade efficiency Specification 1: Technologies calibrated on official factor shares (welfare gains: φ 51 0.24%) 1 2 4.99 2 4.68 2 7.63 2 1.97 2 8.53 16.00 0.00 2 7.27 7.52 5 2 4.83 2 6.81 2 8.78 2 0.75 2 9.57 14.51 2.29 2 8.41 10.22 10 2 5.16 2 8.83 2 9.98 0.57 2 10.65 9.17 4.02 2 9.58 12.62 20 2 5.33 2 10.39 2 10.81 1.50 2 11.39 7.27 5.49 2 10.38 15.52 35 2 5.70 2 11.50 2 11.33 2.10 2 11.83 6.26 6.26 2 10.86 19.14 Specification 2: Technologies calibrated on adjusted factor shares (welfare gains: φ 52 0.10%) 1 2 5.88 2 5.78 2 8.49 2 1.21 2 9.31 6.36 0.00 2 8.10 8.11 5 2 6.02 2 8.82 2 9.34 2 0.29 2 10.08 4.91 2.93 2 8.95 10.73 10 2 6.37 2 10.06 2 9.76 0.17 2 10.45 3.45 3.84 2 9.35 12.65 20 2 7.05 2 10.48 2 9.96 0.40 2 10.61 2.74 3.48 2 9.58 15.87 35 2 8.10 2 10.68 2 10.11 0.57 2 10.74 2.46 2.46 2 9.78 21.47
Figure 2. Full integration in the European Single Market.
quite substantial, independently of the factor shares used. The reason is found in sectors of activity initially dominated by ineffi-cient local oligopolists. The opening up of domestic markets to international competition forces Turkish producers to cut prices in the domestic market—where they have large shares and, hence, strong monopoly power—and to move down along their average cost curve to face the induced expansion of demand. The efficiency gains, achieved range between 12 and 18 percent; not surprisingly, they appear quite robust to the factor shares used for calibration. The cost-saving shock has a positive wealth effect that shifts the profile of consumption upward. It also induces more capital accu-mulation than was the case in the tariff elimination-only experi-ment. As a result, steady-state consumption increases with both
specifications of technologies (φss5 2.10 and 0.57%). This could
suggest an unambiguous policy recommendation. It is not the case, however, because ambiguous welfare conclusions arise when transitional dynamics are taken into account. Based on official data, the analysis recommends that joining the European Single
Market is desirable from a Turkish perspective (φ5 0.24%). If
we use the adjusted factor-income ratios instead, the same analysis indicates that the long-term gains from the integration policy could fall short of compensating the representative Turkish household
from the short-term adjustment costs (φ5 20.10%).
5. CONCLUSION
We have highlighted an example of considerable bias in officially published data by an LDC. The country, Turkey, is, most plausibly, above LDC averages in terms of the quality of its statistical system. The questioned data on factor income shares are among the most fundamental, as they characterize production technology that is at the heart of quantitative economic development and growth analysis. Yet, researchers recurrently use these flawed data when building policy recommendations, ignoring or unaware of the problem.
To demonstrate the potential seriousness of the problem, we have made use of an applied GE model of the Turkish economy and shown how unreliable even qualitative answers are to such important policy questions as: Is trade liberalization desirable? The same verdict holds when the welfare analysis is restricted to steady-state comparisons or extended to account for transitional
effects. It is worth stressing that the example provided in this article is by no means an isolated case: the same data problem has been identified for Mexico (Kehoe and Kehoe, 1994) and apparently equally ignored by modelers in their appraisals of the potential welfare effects of the NAFTA.
These examples unambiguously call for a more critical attitude of the profession towards the data used for building policy recom-mendations. Failure to do so will result in a loss of credibility and erode economists’ ability to influence policy making in LDCs. APPENDIX: DATA, MODEL SPECIFICATION,
CALIBRATION, AND COMPUTATIONAL STRATEGY A1. The Data
For the European Economies, we use Mercenier’s (1995) database. Data on the Turkish economy is compiled from the 1990 Input– Output Table of SIS (1994). To achieve sectoral consistency with the European counterparts as laid out in Mercenier (1995a), the original sectoral structure of the Turkish I–O Table, which consists of 64 production sectors, is aggregated to 9. Data on sectoral gross tariffs, as well as final demand structure, are also derived from the same source. The tariff data clearly do not represent the official rates of tariffication, but rather give the actual revenues of the government that have accrued to the central budget. The effective rate of protection of the Turkish tariffication system, which is well beyond the subject of this article, is examined in detail in Togan (1993).
Data on concentration ratios of the Turkish manufacturing in-dustry are mainly derived from the SIS (1993) (see also Kaytaz, Altin, and Bunes, 1993, for a characterization of the organizational structure of the Turkish industry). The number of Chamberlinian symmetric firms in each imperfectly competitive industry is derived from the Herfindahl indices, which are reported therein.
A2. The Model Structure
The structure of the instantaneous equilibrium differs only slightly from the one used, and extensively described, by Mercen-ier (1995a). We, therefore, limit ourselves here to the description of the dynamic structure.
In each country, there is a single representative household that is competitive, infinitely lived, and utility maximizing. The domestic household owns all the country’s primary factors, namely, labor and physical capital, which it rents to domestic firms only, at com-petitive prices w(t) and r(t), respectively. (For notational conve-nience, we drop the country subscript here.) We abstract from leisure/labor decisions and population growth so that labor is in fixed supply L. The decision variables of the household are consumption C(t) and investment I(t). In making these optimal decisions, the household has access to international financial mar-kets on which it can borrow or lend. Its intertemporal decision problem is to maximize
#
0∞e 2rtC(t) 12g 12 gdt , (A.1) subject to K˙ (t)5 I(t) 2 dK(t), (A.2)#
0∞e 2rt[p c(t)C(t)1 pI(t)I(t)]dt<#
0∞e 2rt[w(t)L1 r(t)K(t) 1o
s ps(t)1 G(t)]dt 1 F(0), (A.3) K(0), F(0) given.Equation (A.2) accounts for capital accumulation with exponen-tial depreciation. Equation (A.3) is the household’s intertemporal budget constraint. It specifies that the sum of discounted stream of consumption and investment expenditures (for convenience, all prices are defined as undiscounted) cannot exceed the dis-counted sum of revenues earned from primary factor ownership and from government lump-sum rebate of tariff revenues G(t)
plus initial holding of foreign assets F(0). The termSsps(t) in the
budget constraint accounts for the possibility that, in the short run, because of unexpected shocks to imperfectly competitive industries, supranormal profits may add to capital rental earnings.
All countries have the same constant discount ratesr. By solving
this intertemporal problem, households determine their optimal aggregate consumption and investment expenditures, which are allocated across sector via Dixit-Stiglitz preferences/technologies (see Mercenier, 1995a).
In imperfectly competitive industries, concentration adjusts with inertia to the existence of nonnegative oligopoly rents so that, in the long run, these rents are null. The process of entry and exit
of firms is implemented in the following way: nis(0) given, nis(∞) such thatpis(∞)5 0,
n˙is(t)5 u[nis(∞)2 nis(0)], 0, u , 1,
where nis(t) is the number of symmetric competitors in industry
s of country i.
A3. Calibration and Computation
The calibration procedure for the instantaneous GE is exten-sively discussed by Mercenier (1995a). We avoid duplication and focus our discussion on the treatment of dynamics.
We first note that the budget constraint (A.3) can be equiva-lently written in the following differential form:
F˙(t)5 rF(t) 1 w(t)L 1 r(t)K(t) 1
o
s ps(t)1 G(t) 2 [pc(t)C(t)1 pI(t)I(t)], F(0) given, lim t→∞e 2rtF(t)5 0,where, again, we neglect country subscripts for notational ease. We next make use of results by Mercenier and Michel (1994a) on dynamic aggregation and write the following finite-horizon discrete-time approximation to the individual household’s inter-temporal choice problem:
Max
o
N21 n50 anDn C(tn)12g 12 g 1 bN 1 r C(tN)12g 12 g such that F(tn11)2 F(tn)5 Dn[rF(tn)1 w(tn)L1 r(tn)K(tn)1o
s ps(tn)1 G(tn) 2 pc(tn) C(tn)2 pI(tn)I(tn)], K(tn11)2 K(tn)5 Dn[I(tn)2 dK(tn)], F(t0), K(t0) given,where tn(n5 0, . . . , N) are possibly unequally spaced dates, Dn5
tn112 tn, andanandbNare (unknown) discount factors. Proposition
2 of Mercenier and Michel (1994a) ensures that this dynamic aggregation satisfies the property of steady-state invariance (i.e., a stationary equilibrium of (A.1) through (A.3) is also a constant solution of the time-aggregated approximation) if and only if the
discount factorsan and bNsatisfy an115 an (11 r Dn11) , 0< n < N 2 2, bN5 aN21.
Assuming the world economy initially is in steady state,11these
results make the calibration of the intertemporal equilibrium straightforward using the following first-order conditions:
3
C(tn21) C(tn)4
2g 5pc(tn21) pc(tn) , 0, n < N, pI(tn21)5 1 11 rDn [Dnr(tn)1 (1 2 dDn) pI(tn)], 0, n , N, pI(tN)5 1 r[r(tN)2 d pI(tN)].We solve the model on a horizon of 35 years using five unequally
distant grid dates: t05 1, t1 5 5, t2 5 10, t3 5 20, and tN 5 t4 5
35. Although the time aggregation bias is obviously unknown—to evaluate this would require solving the system on a dense time grid, which is not possible given the size of the model—results reported in Mercenier and Michel (1994a, 1994b) suggest that such approximations are quite accurate.
In the time-aggregated framework, the welfare criterion be-comes the following: determine φ such that
o
N21 n50 anDn [Cˆ (tn) (11 φ)]12g 12 g 1 bN 1 r [Cˆ (tN) (11 φ)]12g 12 g 5o
N21 n50 anDn C(tn)12g 12 g 1 bN 1 r C(tN)12g 12 g ,where Cˆ (tn) and C(tn), n 5 0, . . . , N denote respectively, the
benchmark and counterfactual equilibrium profiles of aggregate consumption.
11Although unrealistic for most LDCs, the steady-state assumption is systematically
adopted in applied intertemporal GE models (e.g., Go, 1994), in particular, because it is extremely convenient for calibration. The only effort at departure from this assumption in a large-scale model that we are aware of is by Mercenier and Sampaı¨o de Souza, 1994, who calibrate a small open economy—Brazil—on a transition path. (For a similar effort in a one-sector growth model, see Stokey, 1994). Whether the additional complication is useful is still an open question.
Reduced as it is by dynamic aggregation, the dimensionality of this five-period model is still a numerical challenge. To overcome this problem, we build on Negishi’s (1961) existence proof of an imperfectly competitive GE. We first exogenize oligopolistic mark-ups and solve for the intertemporal equilibrium allocations, prices,
and industry structures.12 Using these newly computed prices and
market shares, we then upgrade the optimal markups. We iterate the Gauss-Seidel way until convergence to a fixed point.
This numerical procedure proved quite reliable, and no compu-tational difficulty is worth reporting. Nevertheless, there is little control on the search path with such a strategy, and no serious exploration of the possible existence of more than one equilibrium is possible. This is particularly unpleasant in view of the recent results of Mercenier (1995b), which suggest that in this generation of applied GE models, multiple equilibria can exist. It should be emphasized, however, that even though the structure of the instantaneous GE equilibrium of this model bears strong similari-ties to that of Mercenier (1995b), the treatment of factor markets differs substantially: we do not assume here that factors and factor owners move internationally. Although there is no reason to be-lieve that the change eliminates the risk of nonuniqueness, numeri-cal tests with Mercenier’s (1995b) model suggest that the risk is actually reduced.
REFERENCES
Balassa, B. (1983) Outward Orientation and Exchange Rate Policy in Developing Coun-tries: The Turkish Experience. Middle East Journal (December):429–447. Brooke, A., Kendrick, D., Meeraus, A. (1988) GAMS: A User’s Guide. San Francisco:
Scientific Press.
Celasun, M. (1989) Income Distribution and Employment Aspects of Turkey’s Post-1980 Adjustment. METU Studies in Development 16:1–32.
Dixit, A.K., and Stiglitz, J.E. (1977) Monopolistic Competition and Optimum Product Diversity. American Economic Review 67:297–308.
Ethier, W.J. (1982) National and International Returns to Scale in the Modern Theory of International Trade. American Economic Review 72:389–405.
Gabszewicz, J.J., and Vial, J.P. (1972) Oligopoly ‘a` la Cournot’ in a General Equilibrium Analysis. Journal of Economic Theory 4:381–400.
Go, D. (1994) External Shocks, Adjustment Policies and Investment in a Developing Economy: Illustrations from a Forward-Looking CGE Model of the Philippines.
Journal of Development Economics 44:229–261.
12All computations have been performed using GAMS/MINOS (Brooke, Kendrick,
Harrison, G., Rutherford, T., and Tarr, D. (1993) Trade Reform in the Partially Liberalized Economy of Turkey. World Bank Economic Review 7:191–217.
Harrison, G., Rutherford, T., and Tarr, D. (1996) Economic Implications for Turkey of a Customs Union with the European Union. The World Bank International Trade Division, Policy research Working Paper #1599, May.
Kaytaz, M., Altin, S., and Gunes, M. (1993) Turkiye Imalat Sanayiinde Yogunlasma (Concentration in the Turkish Manufacturing Industry). TMMOB, 1993 Sanayi Odasi Bildiriler Kitabi 1.
Kehoe, P., and Kehoe, T. (1994) Capturing NAFTA’s Impact With Applied General Equilibrium Models. Federal Reserve Bank of Minneapolis Quarterly Review Spring:17–33. (Also in: Kehoe, P., and Kehoe, T., Eds) (1995) Modeling North
American Economic Integration. Boston: Kluwer Academic Publishers.
Kose, A., and Yeldan, E. (1996) Turkiye Ekonomisinde Sektorel Isgucu Istihdami ve Ucret Yapisi Uzerine Bir Deneme (A Note on the Sectoral Labor Employment and Wage Structure of the Turkish Economy). Iktisat Isletme Ve Finans 11:18–25. Mercenier, J. (1995a) Can ‘1992’ Reduce Unemployment in Europe? On Welfare and Employment Effects of Europe’s Move to a Single Market. Journal of Policy
Model-ing 17:1–37.
Mercenier, J. (1995b) Nonuniqueness of Solutions in Applied General Equilibrium Models with Scale Economies and Imperfect Competition. Economic Theory 6:161–177. Mercenier, J., and Akitoby, B. (1993) On Intertemporal General-Equilibrium Reallocation
Effects of Europe’s Move to a Single Market. Institute for Empirical Macroeconom-ics Working Paper 87, Federal Reserve Bank of Minneapolis.
Mercenier, J., and Michel, P. (1994a) Discrete Time Finite Horizon Approximation of Optimal Growth with Steady State Invariance. Econometrica 62:635–656. Mercenier, J., and Michel, P. (1994b) A Criterion for Time Aggregation in Intertemporal
Dynamic Models. Mathematical Programming 64:179–197.
Mercenier, J., and Sampaio de Souza, M.C. (1994) Structural Adjustment and Growth in a Highly Indebted Economy: Brazil. In Applied General Equilibrium Analysis and
Economic Development: Present Achievements and Future Trends. J. Mercenier and
T.N. Srinivasan, Eds. Ann Harbor: University of Michigan Press, pp. 281–310. Ministry of International Trade and Industry (MITI). (1989) The 1985 Japan–U.S. Input–
Output Table. Tokyo: MITI.
Negishi, T. (1961) Monopolistic Competition and General Equilibrium. Review of
Eco-nomic Studies 28:196–201.
Nikaido, H. (1975) Monopolistic Competition and Effective Demand. Princeton, NJ: Princeton University Press.
Ozmucur, S. (1991) Girdi/Cikti Tablolarindan Elde Edilen Faktor Gelirlerinin Dagilimi (Distribution of Factor Incomes Based on Input–Output Tables). Bogazici Univer-sity Research Paper SBE/EC 91-11.
Santis, R. (1996) The Economic Effects of the Customs Union Between Turkey and the European Union: A Static Applied General Equilibrium Model for the Turkish Economy. Paper presented at the 11th European Economic Association Meeting, August 21–24, Istanbul.
State Institute of Statistics (SIS). (1996) Household Income Distribution Surveys, 1994. Ankara: SIS.
State Institute of Statistics (SIS). (1995) Statistical Yearbook of Turkey. Ankara: SIS. State Institute of Statistics (SIS). (1994) The Input Output Structure of the Turkish Economy
State Institute of Statistics (SIS). (1993) Concentration in the Turkish Manufacturing
Indus-try, 1985–1989. Ankara: SIS.
Smith, A., and Venables, A.J. (1988) Completing the Internal Market in the European Community: Some Industry Simulations. European Economic Review 32:1501–1525. Srinivasan, T.N. (1994a) Introduction. Journal of Development Economics 44:1–2. Srinivasan, T.N. (1994b) Data Base for Development Analysis: An Overview. Journal of
Development Economics 44:3–27.
Stokey, N. (1994) NAFTA and Mexican Development. Mimeo, University of Chicago (August).
Togan, S. (1993) 1980’li Yillarda Turk Dis Ticaret Rejimi ve Dis Ticaretin Liberalizasyonu (Turkish Foreign Trade Regime and Its Liberalization in the 1980’s). Turk Exim-bank, Ankara.
Yeldan, E. (1995) Political Economy Perspectives on the 1994 Turkish Economic Crisis: A CGE Modeling Analysis. University of Minnesota Economic Development Center Bulletin 95-3 (March).