Journal of Instrumentation
Gas gain stabilisation in the ATLAS TRT detector
To cite this article: B. Mindur et al 2016 JINST 11 P04027View the article online for updates and enhancements.
Related content
The ATLAS TRT Barrel Detector The ATLAS TRT collaboration, E Abat, T N Addy et al.
-The ATLAS TRT electronics
The ATLAS TRT collaboration, E Abat, T N Addy et al.
-Combined performance tests before installation of the ATLAS Semiconductor and Transition Radiation Tracking Detectors
E Abat, A Abdesselam, T N Addy et al.
-2016 JINST 11 P04027
Published by IOP Publishing for Sissa MedialabReceived: March 21, 2016 Accepted: April 21, 2016 Published: April 29, 2016
Gas gain stabilisation in the ATLAS TRT detector
The ATLAS TRT collaboration
B. Mindur,h,1T.P.A. Åkesson,nF. Anghinolfi,f A. Antonov,qO. Arslan,eO.K. Baker,y
E. Banas,iC. Bault,f A.J. Beddall,aJ. Bendotti,f D.P. Benjamin,jH. Bertelsen,gA. Bingul,b A. Bocci,j A.S. Boldyrev,r I. Brock,e M. Capeáns Garrido,f A. Catinaccio,f E. Celebi,c S.A. Cetin,dK. Choi,lM. Dam,gH. Danielsson,f D. Davis,jC. Degeorge,l D. Derendarz,i K. Desch,eB. Di Girolamo ,f F. Dittus,f N. Dixon,f N. Dressnandt,uF.A. Dubinin,p H. Evans,l P. Farthouat,f O.L. Fedin,vD. Froidevaux,f I.L. Gavrilenko,p C. Gay,xZ. Gecse,x
J. Godlewski,iC. Grefe,eS. Gurbuz,cZ. Hajduk,iM. Hance,u B. Haney,uJ.B. Hansen,g P.H. Hansen,gA.D. Hawkins,nS. Heim,u K. Holway,jV.A. Kantserov,q S. Katounine,v F. Kayumov,pP.T. Keener,u B. Kisielewski,iN.V. Klopov,vS.P. Konovalov,pS. Koperny,h N.A. Korotkova,r T.Z. Kowalski,hV. Kramarenko,r D. Krasnopevtsev,q M. Kruse,j L.G. Kudin,v P. Lichard,f A. Loginov,y N. Lorenzo Martinez,lA. Lucotte,k F. Luehring,l E. Lytken,nV.P. Maleev,vA.S. Maevskiy,r J. Manjarres Ramos,z R.Y. Mashinistov,pC. Meyer,u V. Mialkovski,mK. Mistry,uV.A. Mitsou,w A.V. Nadtochi,v F.M. Newcomer,u
E.G. Novodvorski,v H. Ogren,lS.H. Oh,j S.B. Oleshko,vJ. Olszowska,iW. Ostrowicz,i G. Palacino,z S. Patrichev,vJ. Penwell,lF. Perez-Gomez,f V.D. Peshekhonov,mO. Røhne,t M.B. Reilly,uC. Rembser,f O. Ricken,eA. Romaniouk,qD. Rousseau,s V. Ryjov,m
U. Sasmaz,bS. Schaepe,eV.A. Schegelsky,vA.P. Shmeleva,pE. Shulga,qS. Sivoklokov,r S. Smirnov,qYu. Smirnov,qL.N. Smirnova,r E. Soldatov,qV.V. Sulin,pG. Tartarelli,o W. Taylor,zE. Thomson,uV.O. Tikhomirov,pP. Tipton,y J.A. Valls Ferrer,w R. Van Berg,u J. Vasquez,yL.F. Vasilyeva,pO. Vlazlo,nB. Weinert,lH.H. Williams,uV. Wong,xK.I. Zhukovp and D. Zieminskal
aBahcesehir University, Faculty of Engineering and Natural Sciences, 34353, Besiktas, Istanbul, Turkey bGaziantep University, Department of Physics Engineering, 27300, Sehitkamil, Gaziantep, Turkey cBogazici University, Department of Physics, 34342, Bebek, Istanbul, Turkey
dIstanbul Bilgi University, Faculty of Engineering and Natural Sciences, 34060, Eyup, Istanbul, Turkey ePhysikalisches Institut, University of Bonn, Bonn, Germany
fCERN, CH - 1211 Geneva 23, Switzerland, Switzerland
gNiels Bohr Institute, University of Copenhagen, Blegdamsvej 17, DK - 2100 Kobenhavn 0, Denmark hFaculty of Physics and Applied Computer Science of the AGH-University of Science and Technology,
(FPACS, AGH-UST), al. Mickiewicza 30, PL-30059 Cracow, Poland 1Corresponding author.
2016 JINST 11 P04027
iHenryk Niewodniczanski Institute of Nuclear Physics, Polish Academy of Sciences, ul. Radzikowskiego 152, PL - 31342 Cracow, Poland
jDuke University, Department of Physics, Durham, NC 27708, U.S.A.
kLaboratoire de Physique Subatomique et de Cosmologie, CNRS-IN2P3, Universite Joseph Fourier, INPG, 53 avenue des Martyrs, FR - 38026 Grenoble Cedex, France
lIndiana University, Department of Physics,
Swain Hall West, Room 117, 727 East Third St., Bloomington, IN 47405-7105, U.S.A. mJoint Institute for Nuclear Research, JINR Dubna, RU - 141 980 Moscow Region, Russia
nLunds Universitet, Fysiska Institutionen, Box 118, SE - 221 00 Lund, Sweden
oINFN Milano and Università di Milano, Dipartimento di Fisica, via Celoria 16, IT - 20133 Milano, Italy pP.N. Lebedev Institute of Physics, Academy of Sciences, Leninsky pr. 53, RU - 117 924 Moscow, Russia qNational Research Nuclear University MEPhI, Kashirskoe Shosse 31, RU -115409 Moscow, Russia rLomonosov Moscow State University, Skobeltsyn Institute of Nuclear Physics,
RU - 119 992 Moscow Lenskie gory 1, Russia sLAL, Univ. Paris-Sud, IN2P3/CNRS, Orsay, France
tDepartment of Physics, University of Oslo, Blindern, NO - 0316 Oslo 3, Norway uUniversity of Pennsylvania, Department of Physics & Astronomy,
209 S. 33rd Street, Philadelphia, PA 19104, U.S.A.
vPetersburg Nuclear Physics Institute, RU - 188 300 Gatchina, Russia
wInstituto de Física Corpuscular (IFIC), Centro Mixto UVEG-CSIC, Apdo. 22085, ES-46071 Valencia; Dept. Física At., Mol. y Nuclear, Univ. of Valencia and Instituto de Microelectrónica de Barcelona (IMB-CNM-CSIC), 08193 Bellaterra, Barcelona, Spain
xUniversity of British Columbia, Department of Physics,
6224 Agriculture Road, CA - Vancouver, B.C. V6T 1Z1, Canada
yYale University, Department of Physics, PO Box 208121, New Haven CT, 06520-8121, U.S.A. zYork University, Department of Physics and Astronomy, Toronto ON , Canada
E-mail: [email protected]
Abstract: The ATLAS (one of two general purpose detectors at the LHC) Transition Radiation Tracker (TRT) is the outermost of the three tracking subsystems of the ATLAS Inner Detector. It is a large straw-based detector and contains about 350,000 electronics channels. The performance of the TRT as tracking and particularly particle identification detector strongly depends on stability of the operation parameters with most important parameter being the gas gain which must be kept constant across the detector volume. The gas gain in the straws can vary significantly with atmospheric pressure, temperature, and gas mixture composition changes. This paper presents a concept of the gas gain stabilisation in the TRT and describes in detail the Gas Gain Stabilisation System (GGSS) integrated into the Detector Control System (DCS). Operation stability of the GGSS during Run-1 is demonstrated.
Keywords: Gaseous detectors; Particle tracking detectors (Gaseous detectors); Transition radiation detectors; Wire chambers (MWPC, Thin-gap chambers, drift chambers, drift tubes, proportional chambers etc)
2016 JINST 11 P04027
Contents1 Introduction 1
2 Gas gain stabilisation in the ATLAS TRT 3
3 Operation principles of the Gas Gain Stabilisation System 5
4 Properties of the reference straw tubes and related components 7
4.1 Gas gain measurements 7
4.2 Gas gain temperature dependence 9
5 Design of the Gas Gain Stabilisation System 9
5.1 Hardware 9
5.2 Software 11
6 Longterm system performance 12
6.1 Reference high voltage 12
6.2 Gas gain stability 13
7 Conclusions 14
1 Introduction
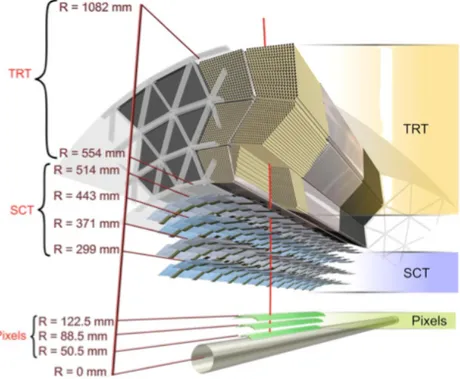
The ATLAS Inner Detector (ID) is composed of three detector sub-systems: the silicon-based Pixel and SemiConductor Tracker (SCT) detectors, and the gaseous drift tube (straw) based Transition
Radiation Tracker (TRT) [1]. Schematically the design of the ATLAS Inner detector is shown in
figures1and2.
The TRT is the outermost of the three sub-systems (see [2–4] for more details). The active
region of the TRT detector contains 298,304 straw drift tubes of 4 mm diameter (350,848 electronics channels). The barrel section of the TRT covers 560 < R < 1080 mm and |z| < 720 mm and has the straws aligned parallel to the direction of the beam axis. The two end-cap sections cover 827 < |z| < 2744 mm and 617 < R < 1106 mm and have the straws arranged radially in wheels.
The TRT exploits a novel design which combines continuous tracking capability with particle identification (PID) based on transition radiation (TR). The latter functionality provides substantial discriminating power between electrons and pions over the energy range between 1 and 100 GeV and is a crucial component of the ‘tight’ electron selection criteria in ATLAS. The TRT straws are
filled with a gas mixture of 70% Xe, 27% CO2and 3% O2. Xenon is used for its high efficiency to
absorb TR photons of typical energy 6–15 keV. The space between the straws is filled with radiator material. The TR photons (soft X-rays) emitted in the radiator are absorbed in the gas inside the straw tubes, which serve as detecting elements both for tracking and for particle identification (more
2016 JINST 11 P04027
Figure 1. Schematic view of the Barrel part of the ATLAS Inner detector.
Figure 2.Schematic view of the End Cap (EC) part of the ATLAS Inner detector.
about TRT performance can be found in [5]). The straw wall is held at a potential of about -1530 V
with respect to a 31 µm diameter gold-plated tungsten wire at the centre that is referenced to ground. The electrons drift towards the wire and cascade in the strong electric field very close to the wire
with a coefficient of 2.5 × 10⁴(gas gain), thus producing a detectable signal. The signal in each
2016 JINST 11 P04027
threshold (∼300 eV), is used to calculate the track to anode wire distance by measuring the drifttime of the closest electron cluster to the wire and the High Level (HL) threshold (∼6 keV) used to identify a large energy deposits from absorbed TR photons for particle identification.
The low level threshold is set to a minimum defined by the rate of electronics noise pulses. Any increase of this threshold leads to a worsening of the drift time accuracy measurement. For instance, an increase of the LL threshold by 20% leads to a change of a coordinate accuracy from
125 µm to 130 µm and to a reduction of drift time measurement efficiency by 5% [6].
Particle separation is based on probability to exceed the high level threshold. This probability is different for particles which produce TR (Lorentz γ factor above ∼500) and other particles with a γ factor below ∼500. This probability is highly sensitive to the value of the threshold. It has been shown that TRT particle separation power stays the same if the variation of the effective
threshold across the detector is stable to within 20% [5]. This constraint seems loose but it must
be maintained against all possible uncertainties like signal amplitude variations along the straws, electronics channel to channel gain variations, gas gain variations etc. Some of these sources of am-plitude variations are quite stable over time and can be partially compensated by regular calibration procedures. However there are other sources of amplitude variation for which the environmental change is too short of a time (hours) to be compensated by an offline compensation procedure. The gas gain is sensitive to three such varying parameters: the gas pressure, gas temperature and gas composition. Since these parameters can and do change over the course of a run, a real-time hard-ware compensation system to adjust the high voltage on the straws called the Gas Gain Stabilisation System was developed. Apart from global variations of temperature and pressure there are local variations of temperatures within the TRT detector volume which also must be compensated.
During the Large Hadron Collider (LHC) collisions the ionisation currents generated within straws are sufficiently large such that they heat the gas inside the straws and temperature within the detector becomes dependent on the LHC luminosity leading to an unavoidable time dependence of the gas gain of the course of each run. The design of the ATLAS inner detector assumed thermal neutrality of neighbouring subdetectors. That is, the design tried to keep the inevitable heat production (e.g. electronics, ionisation in straws) confined within the originating subsystem until it could be removed by a cooling system. Thermal barriers between the TRT, which run at
room-temperature and the silicon detectors, which run well below 0◦C, were foreseen by design
but do not guarantee a uniform temperature distribution across the TRT detector volume. In order to compensate the effect of the temperature on the gas gain, each partition of the TRT (2 barrel, 2 end-cap) is equipped with 236 temperature sensors. Data from these sensors is used to adjust the TRT high voltages in real time.
This paper describes in detail the concept and implementation of the TRT gas gain stabilisation. The design requirement to control the gas gain time variation in all TRT straws is determined such that the effective threshold variation is below ∼5%.
2 Gas gain stabilisation in the ATLAS TRT
The ATLAS TRT Gas Gain Stabilisation System maintains gas gain stability throughout the TRT
by using the Detector Control System (DCS) [7, 8, 13] to adjust in real time the high voltage
(HV) in ∼2000 TRT HV partitions. The GGSS produces the single reference voltage (HVr e f) that
2016 JINST 11 P04027
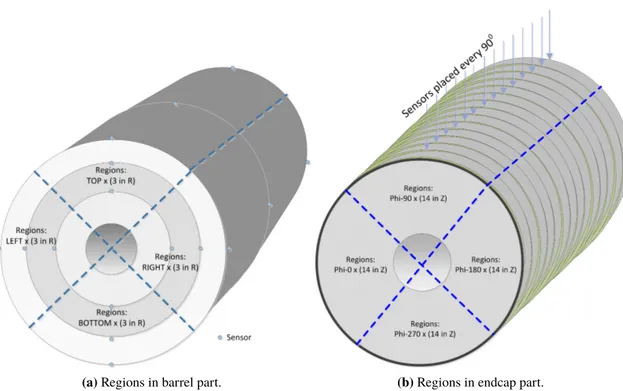
pressure. The TRT has a completely closed loop active gas system which constantly adjusts the gascomposition sent to the detector. The GGSS draws sample gas directly from the TRT gas system closed loop return manifold guaranteeing that the HV adjustments are based on the actual flow condition of the active gas. The GGSS operates at atmospheric pressure while the gas pressure in the TRT is regulated to be within a few tens of mbar above atmosphere. Since the working gas composition and pressure are essentially the same within the GGSS and throughout the entire TRT, only variations in temperature across the detector need to be taken into account when calculating the high voltage settings for different regions of the detector. The number of temperature sensors used for stabilisation purposes is far less than the number of HV partitions, hence, the detector has to be divided into regions which are chosen according to the sensor topology and mechanical
granularity (see figure3).
The TRT Barrel is divided into 4 φ sectors (±45◦) and into the 3 layers of barrel modules and
thus, the barrel contains 12 regions where the HV is regulated independently following temperature measurements. Each of these 12 regions has 3 temperature sensors along Z near the outside radius of the region. The average of these 3 measurements is taken as ’regional temperature’ used for HV
correction (see also figure3a).
The TRT end-caps form stacks of wheels that for stabilisation purposes are divided in φ into 4 sectors(±45◦) and into the number of wheels in Z (14) and thus each end-cap contains 56 regions
(see figure3b). Each of these regions have sensors on their front an back in Z and the average of
these two sensors is taken as representative for the region.
(a)Regions in barrel part. (b)Regions in endcap part.
Figure 3. Detector segmentation used for the TRT gas gain stabilisation based on the detector temperature
2016 JINST 11 P04027
The temperature inside the GGSS system is quite stable and measured with an accuracy ofabout 0.1◦C, while the temperature variations within the TRT detector are much larger. Within an
hour of powering the electronics, the temperatures across the detector start to stabilise. However, at
different regions of the TRT the temperature variation is significant (6-9◦C). During the course of a
run, regional temperatures are varying depending on local particles fluence and amount of ionisation deposition hence the variations must be compensated for in real time. The single reference voltage value produced by GGSS system is sent to the TRT DCS HV controllers where the HV for each detector region is recalculated and set according to the following formula:
HVcor = HVref+ α(Treg− Tggss) (2.1)
where: HVcoris the voltage to be applied in region, HVrefreference voltage, α is thermal coefficient
of the active gas and Treg and Tggss are the regional and the GGSS temperatures respectively. To
protect the TRT sensors (i.e. straws) against failures of the GGSS and dangerous environmental conditions, the TRT HV DCS system has several protection mechanisms. The calculated setting is compared to a maximum voltage value protecting the detector against overvoltage. If an overvoltage
setting is requested, the HV is set to the maximal value. The GGSS also sends HVref quality flags
after every measurement cycle to provide information whether voltage value is to be trusted or not. If any of these flags are true, the TRT HV is not changed.
3 Operation principles of the Gas Gain Stabilisation System
GGSS operation is based on a stabilisation of the signal amplitude produced by 55Fe X-rays in
reference (test) straws. The operation of proportional gaseous counter is thoroughly explained in
basic textbooks and the key parameter governing this is the value of the gas gain A, (A = n/n0)
(where n0is number of primary ion pairs liberated in active gas). Changes in the peak position of
the pulse height spectrum of the 5.9 keV X-ray emission line of a55Fe source irradiating reference
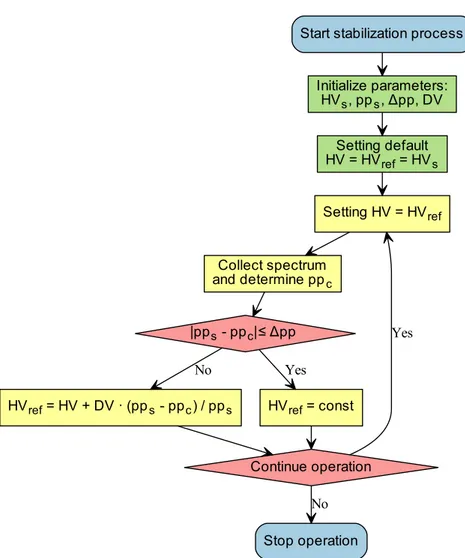
straws are interpreted as changes in the gas gain. The high voltage on the reference straws is adjusted to maintain the fitted peak at a fixed average value that defines the design gas gain value. After each measuring cycle, the reference voltage is recalculated to maintain the design gas gain and then sent to the DCS which then adjusts the high voltage in each TRT region taking into account the local temperature. The steps by which the high voltage is modified to maintain the nominal gas gain are
as follows (see also figure4):
• the starting values for the high voltage (HVs) and peak position (pps) are manually entered to
initialise the GGSS when it is turned on (the default values are selected to be typical values for the TRT straws),
• the spectrum of55Fe is collected for the currently set HV,
• peak position — ppc, energy resolution, and skewness are calculated using a Gaussian fit of
the spectrum,
2016 JINST 11 P04027
Start stabilization processInitialize parameters: HVs, pps, Δpp, DV Stop operation Setting default HV = HVref= HVs Setting HV = HVref Collect spectrum and determine ppc pps- ppc≤ Δpp HVref= HV + DV · (pps- ppc) / pps Continue operation HVref= const No Yes No Yes | |
Figure 4.Simplified block diagram of the GGSS operation.
• once a good measurement is obtained, the new HV value is calculated from the formula:
HV = HVs+
pps− ppc
pps DV (3.1)
where DV is the voltage needed to double the gas gain (i.e. 70 V),
• the new value of the HV is applied to the test straw and the procedure is repeated until the
condition | pps− ppc | ≤ ∆ppis met (where: ∆pp is the required accuracy of peak position
stabilisation, in this case is equal to 10% of pps),
• when | pps− ppc | ≤ ∆ppis achieved, the procedure than sets HVref = HV, where HVref
is the voltage sent to DCS. To ensure robustness of the HVref value it is calculated as the
mean, HV, of the values obtained in each of the reference straws (using only straws with good values).
2016 JINST 11 P04027
4 Properties of the reference straw tubes and related componentsStable operation of the GGSS is a key factor for successful TRT operation. Significant work has been carried out to ensure good knowledge of the performance of the basic components of the system and study their properties. The straw tubes used as reference detectors have been carefully examined and were selected for the uniformity of their response. The following parameters were measured in selecting the final straw tubes used in the GGSS:
• the gas gain as a function of high voltage and position of radiation source along the straws, • the counting characteristics (i.e plateau curves),
• the gas gain response to pressure and temperature variations,
• the energy resolution, measured as55Fe spectrum peak width,
• the long-term stability,
• minimal change in straw tube operation from radiation-induced ageing.
4.1 Gas gain measurements
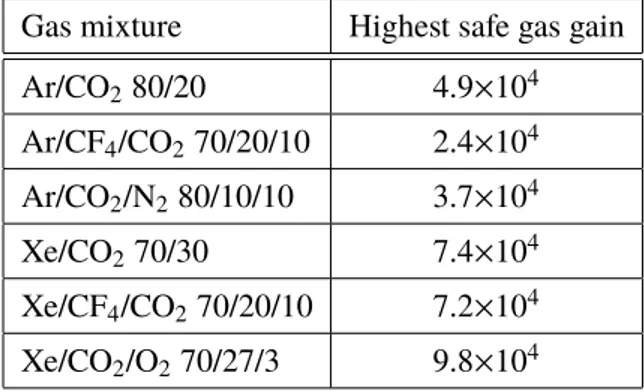
The gas amplification (gain) is a function of the high voltage applied to the straws and gas
amplifi-cation factors ranging from 1 to 7 × 10⁵, were determined using a current measurement technique
for various gas mixtures (see table1). The gas gain A was determined from the ratio I/I0, where I
and I0are the measured currents for a constant flux of X-ray photons for the applied voltage and for
the ionisation chamber regimes (the HV value when all ionisation is collected on the anode without gas gain), respectively. All measurements have been performed at atmospheric pressure. In order to eliminate space charge effects, the measured current was kept below 1 nA. The accuracy of gas gain measurements is limited by the currents measurements and do not exceed 5%. The results
shown in figures5aand5bare for the full set of studied gas mixtures.
Table1shows the maximum safe operating gas gain for all studied gas mixtures. Above this
value, the probability of self quenched (limited) streamers (SQS) becomes significant which leads to an increase of discharge probability.
Table 1.Maximum gas gain for a safe straw operation.
Gas mixture Highest safe gas gain
Ar/CO280/20 4.9×10⁴ Ar/CF4/CO270/20/10 2.4×10⁴ Ar/CO2/N280/10/10 3.7×10⁴ Xe/CO270/30 7.4×10⁴ Xe/CF4/CO270/20/10 7.2×10⁴ Xe/CO2/O270/27/3 9.8×10⁴
2016 JINST 11 P04027
200 400 600 800 1000 1200 1400 1600 1800 Voltage [V] 100 101 102 103 104 105 106 Gas gain [-]Ar/CF
4/CO
270/20/10
Ar/CO
280/20
Ar/CO
2/N
280/10/10
(a)Ar-based gas mixtures.
0 500 1000 1500 2000 Voltage [V] 10-1 100 101 102 103 104 105 106 107 Gas gain [-] Xe/CF4/CO2 70/20/10 Xe/CO2 70/30 Xe/CO2/O2 70/27/3
(b)Xe-based gas mixtures.
Figure 5. Gas gain as the function of voltage applied between anode and cathode of straws for studied
mixtures, p=1030 hPa, T=293◦K.
The energy resolution (FWHM) has also been measured as a function of the applied voltage.
The results obtained are presented in figure6a,6band table1. Energy resolution worsens close to
the gas gain safety limit. In order to ensure maximum stability of the GGSS, the working point was
chosen to be slightly below the nominal TRT gas gain of 2.5 × 10⁴.
1100 1200 1300 1400 1500 1600 Voltage [V] 16 18 20 22 24 26 28 30 32 34 Energy resolution [%]
Ar/CF
4/CO
270/20/10
Ar/CO
280/20
Ar/CO
2/N
280/10/10
(a)Ar-based gas mixtures.
1300 1400 1500 1600 1700 1800 1900 Voltage [V] 0.15 0.20 0.25 0.30 0.35 0.40 0.45 Energy resolution [%] Xe/CF4/CO2 70/20/10 Xe/CO2 70/30 Xe/CO2/O2 70/27/3
(b)Xe-based gas mixtures.
Figure 6. Energy resolution for 5.9 keV55Fe X-Ray line as a function of anode voltage for different gas
2016 JINST 11 P04027
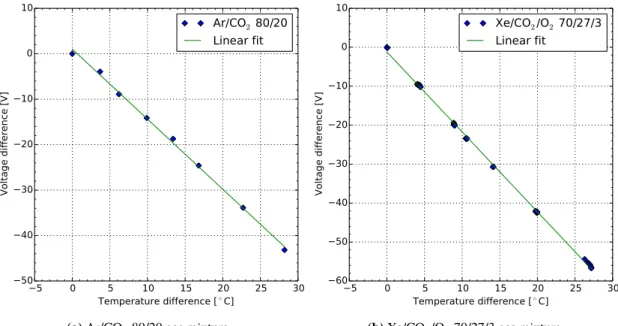
4.2 Gas gain temperature dependence
The electron amplification process near the wire is very sensitive to the density of the working
gas and thus to both temperature and pressure variations. A temperature change of ∆T = 1◦K at
293◦K causes a change of gas pressure ∆p = 3.53 hPa at a pressure of p = 1035 hPa. While both
the TRT and the GGSS operate at atmospheric pressure, gain variations caused by temperature differences can be significant and are compensated by applying HV corrections for each TRT region
separately. The influence of temperature on the gas gain was studied in straw tubes from 15◦C to
45◦C for the 80/20 Ar/CO
2gas mixture and the TRT baseline gas mixture (Xe/CO2/O270/27/3). A
special set-up which provided a thermal stability of 0.1◦C was used for the temperature dependence
study. The results of this study are presented in figures 7a and7b which show the high voltage
adjustment needed to compensate the temperature differences. As seen in figure7, the temperature
dependence of peak position (and thus the gas gain) can be accurately approximated by straight
line. The thermal coefficient of the gas gain (pulse height) is -1.54 V/◦C for the 80/20 Ar-based gas
mixture and -2.13 V/◦C for the TRT baseline mixture Xe/CO
2/O2(70/27/3). 5 0 5 10 15 20 25 30 Temperature difference [◦C] 50 40 30 20 10 0 10 Voltage difference [V]
Ar/CO
280/20
Linear fit
(a)Ar/CO280/20 gas mixture.
5 0 5 10 15 20 25 30 Temperature difference [◦C] 60 50 40 30 20 10 0 10 Voltage difference [V]
Xe/CO
2/O
270/27/3
Linear fit
(b)Xe/CO2/O270/27/3 gas mixture.
Figure 7. Voltage adjustment needed to keep a constant gas gain as a function of a temperature change (the
lower temperature was 15◦C).
5 Design of the Gas Gain Stabilisation System
5.1 Hardware
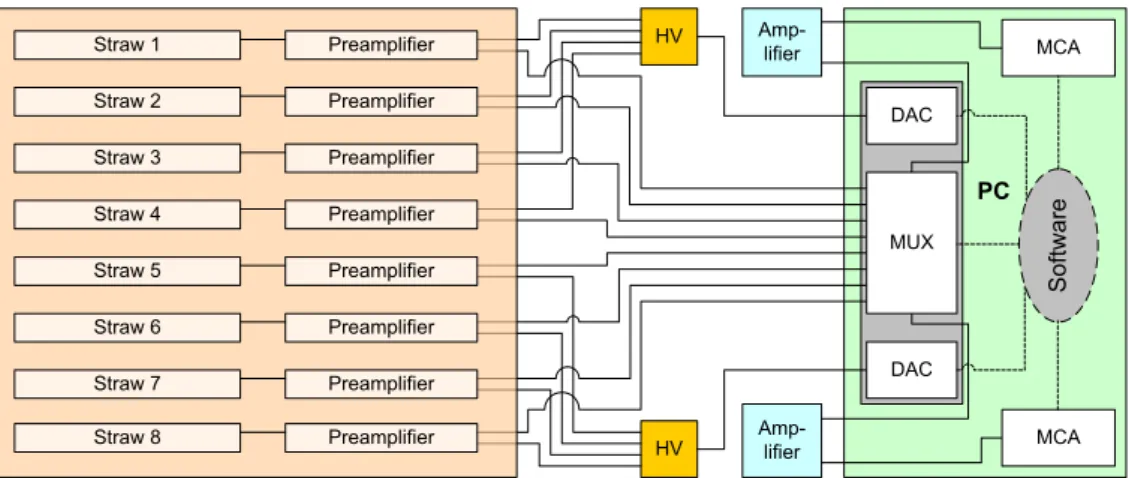
The TRT GGSS consists of:
• two reference detectors with eight straws (15 cm in length) each enclosed in a brass box, • 16 preamplifiers — one for each straw,
2016 JINST 11 P04027
• three high voltage power supplies and three DAC’s for their control (12 channels in total),• two analogue signal multiplexers, • two spectroscopic amplifiers, • two multichannel analysers (MCA), • and a control PC.
The straws are mounted inside a gas tight brass box that is equipped with gas inlet and outlet manifolds which supply the straws with active gas in parallel. The straws (the cathodes) are connected to the ground and the central wires (the anodes) connected to individual high voltage lines and preamplifiers. The straws run at a slightly lower voltage (50 V) than the detector to minimise radiation induced ageing. There are two PT1000 sensors measuring active gas temperature with
accuracy of ∼0.1◦. Each box has a gas tight Kapton window in its cover separating the straws
and 55Fe source. The signals generated by the straws are preamplified, then multiplexed to the
spectroscopic amplifier, before finally being sent to a Multi Channel Analyser (MCA) for analysis. Because of the critical role of the GGSS in the TRT operation, every component has at least one hot spare. During normal operation only one box is used and a second fully-equipped box provides a redundant backup in case of problems. A simplified schematic view of all major GGSS
modules and their interconnections are shown in figure8. To monitor all critical working parameters
(temperatures, gas flow, etc.) an Embedded Local Monitor Board (ELMB) is used [11]. It has 64
input analogue channels from which information is send to the DCS for long term storage to allow historical trend monitoring.
HV HV Amp-lifier Amp-lifier MUX MCA MCA DAC DAC Software Straw 1 Straw 2 Straw 3 Straw 4 Straw 5 Straw 6 Straw 7 Straw 8 Preamplifier Preamplifier Preamplifier Preamplifier Preamplifier Preamplifier Preamplifier Preamplifier PC
Figure 8. Block diagram of the GGSS; Straw (1-8) — four stabilisation, two monitored and two spares;
Preamplifier — charge sensitive, home made; HV — high voltage power suppliers CAEN model N472; Amplifier — ORTEC model 575A; DAC - digital analogue converters — MEN Mikro Elektronik GmbH model M37; MUX — analogue multiplexer — MEN Mikro Elektronik GmbH model M56; MCA — multichannel analyser — ORTEC model MCB — Trump PCI 2k.
2016 JINST 11 P04027
5.2 Software
Dedicated control software for the GGSS is integrated into the TRT DCS [13] and hence the global
ATLAS control system. The core GGSS control application is written in C++ and runs as a service on a dedicated computer. The application communicates exchanging data and commands with
DCS via the Distributed Information Manager (DIM) [12]. The software is responsible for the
configuration and control of hardware components, data collection of measurements, and validation of calculated results. The outputs sent to DCS are the reference high voltage, the gas temperature, and their quality flags as well as any warnings or errors reported by the system.
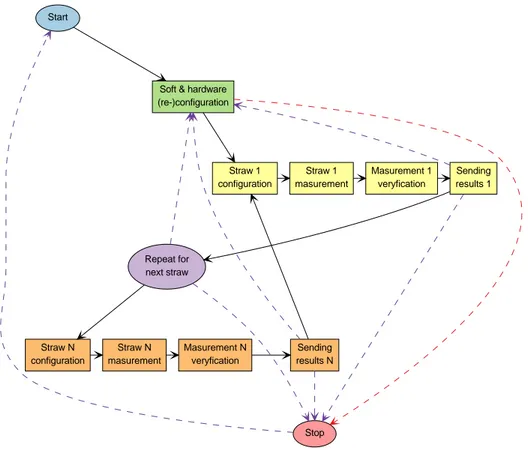
A sketch of a simplified schema of software modules is shown in figure9. The GGSS software
uses signals from four “stabilisation” straws to compute a new value of the reference high voltage. The system collects spectra sequentially (using the multiplexer which routes the signals to the amplitude analyser). When the spectra of all four “stabilisation” straws are measured, a new value of reference high voltage is computed as the mean value of the high voltages calculated for the correctly working stabilisation straws. The reference voltage is then applied to additional “monitored” straws to check that its value results in the correct signal peak position. This cross-check is also used for longterm monitoring of the system behaviour. The whole procedure (which takes ∼10 min) is repeated continuously as long as the GGSS is in operation. There are also two spare straws in the GGSS box which are to be used in case of problems with any of the “stabilisation” straws.
Start
Soft & hardware (re-)configuration Straw N configuration Straw 1 configuration Straw N masurement Stop Straw 1 masurement Masurement 1 veryfication Sending results 1 Repeat for next straw Masurement N veryfication Sending results N
2016 JINST 11 P04027
6 Longterm system performanceFor the entire LHC Run-1 (almost four years) the GGSS operated continuously during all periods of ATLAS physics data taking.
6.1 Reference high voltage
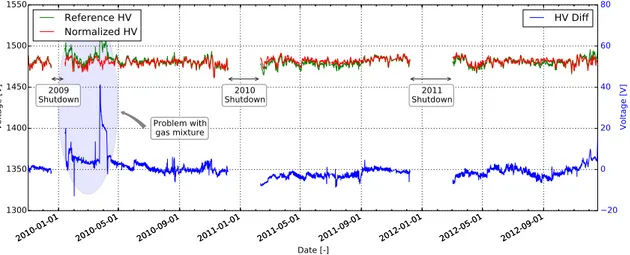
The reference voltage is calculated using GGSS operation voltage and the known dependence of
the gas gain on voltage. Under stable operating conditions HVref depends only on temperature and
atmospheric pressure but will also react to gas mixture composition variation and changes to other
parameters. A normalised high voltage (HVnorm) value was introduced in order to monitor the
operation parameter stability. It is calculated using first principles using following formula:
HVnorm = (HVstart+ ΩT(T − Tstart)+ Ωp(p − pstart)) (6.1)
where HVnorm is the normalised high voltage as function of the temperature T and pressure p.
The parameters in the formula are HVstartthe reference high voltage (1483.8 V), Tstartthe reference
gas temperature (23.6◦C), p
startthe reference pressure (976.5 hPa), ΩT the temperature coefficient
(−2.13 V/◦C), and Ω
pthe pressure coefficient (0.55 V/hPa ). The parameters shown were measured
when the detector was running in optimal conditions at 2009-10-25 23:00:00. Figure10shows the
longterm behaviour of the reference (green line) and normalised (red line) high voltages as well as their difference (blue line) where this difference should ideally be zero. Significant deviation from
zerousually indicates a problem with the gas composition. For instance after restarting the detector
in 2010 this difference reached a level of almost 40 V caused by a miscalibration of the gas analyser which was used for active gas mixture control. This event demonstrates another important function of the GGSS — monitoring the stability of the detector gas mixture which is critical to the proper TRT operation. 2010-01-01 2010-05-01 2010-09-01 2011-01-01 2011-05-01 2011-09-01 2012-01-01 2012-05-01 2012-09-01 1300 1350 1400 1450 1500 1550 Voltage [V] 2009
Shutdown Shutdown2010 Shutdown2011
Problem with gas mixture Reference HV Normalized HV 2010-01-01 2010-05-01 2010-09-01 2011-01-01 2011-05-01 2011-09-01 2012-01-01 2012-05-01 2012-09-01 Date [-] 20 0 20 40 60 80 Voltage [V] HV Diff
Figure 10. Reference and normalised HV (left black scale/red and green lines) and their difference (right
blue scale/line) during GGSS performance over the three and a half year period from December 2009 to March 2013.
2016 JINST 11 P04027
6.2 Gas gain stability
The historic trend of the peak position for one of the stabilisation straws and for one of the monitoring
straws over a period of about 2 years is shown on figures11and12. One sees an excellent stability
with the 55Fe line position maintained within ±1% for one of the gas gain stabilisation straws.
The peak position for monitoring straw, figure 12, over long period of time is also stable within
±1% except for some deviations that were caused by miscalibration of a high voltage power supply.
Atmospheric pressure is a major factor of the the gas gain variation and figure13shows a variation
of HVref (black curve) compared to the variation of atmospheric pressure (blue curve).
Figure 11.Peak position of55Fe line for straw used for gas gain stabilisation (a highlighted region represents
±1% range).
2016 JINST 11 P04027
950 960 970 980 990 1000 Pressure [hPa] 1460 1465 1470 1475 1480 1485 1490 1495 1500 Voltage [V] 2012-04-01 2012-05-01 2012-06-01 2012-07-01 2012-08-01 2012-09-01 2012-10-01 2012-11-01 2012-12-01 Date [-]Figure 13. Longterm trends of crucial GGSS parameters: HVr e f (black) and gas pressure (blue) in 2012;
one can observe the expected strong correlation between the two.
In 2012, the luminosity of LHC reached a value where deposited ionisation in straws started to
cause noticeable heating. Figure14, shows TRT HV setting for one of the barrel HV region for a
20 hour period during which there were two LHC fills producing significant numbers of collisions. From the top to bottom plot (a) shows the current in one barrel HV line which follows LHC instantaneous luminosity, plot (b) shows temperatures measured by probes in one barrel region, plot (c) shows variation of the applied high voltages in the same barrel region and plot (d) shows the
value of HVref received by DCS from the GGSS.
Electron separation from a hadron background is calculated from the fraction of straws crossed by a track with energy deposition above ∼6 keV, the high level hit fraction. For electrons this fraction is about ∼25% and for pions it is ∼5%. In order to suppress pions, a cut on this parameter of about
∼15% is applied so that a track with a high level hit fraction of more than 15% is considered to
be an electron track. This cut allows rejections of ∼95% of pions at a price of an ∼10% loss of electrons. The cut is a part of software analysis tool and is not expected to change during data taking. Any significant change of the gas gain would lead to a change of high level hit fraction on particle track and hence to change in the fraction of pions which pass the cut along with change in electron acceptance efficiency. A change of the gas gain by 10% leads to a change of high level hit
fraction by 20%. Figure15shows a variation of the HL fraction during the 2011 running period.
One sees that HL hit fraction varies by ∼3%, which corresponds to the gas gain variation of ∼1.5% within the TRT detector.
7 Conclusions
The excellent stability of the TRT during Run-1 to a large extent resulted from the TRT GGSS system maintaining nearly constant gas gain over the entire running period. Beyond maintaining stable gas gain in all parts of the TRT, the GGSS provides an efficient monitoring tool to detect
2016 JINST 11 P04027
(a)
(b)
(c)
Time [h]
HV
[V
]
(d)
T [
oC]
I [µA
]
Figure 14. Current in one HV channel of the TRT (a); Trends of the temperature in one of the barrel TRT
regions (b); High voltages applied to the same barrel region HVcor(c); the GGSS voltage HVref (following
the atmospheric pressure) (d).
changes in the gas mixture composition not detected by other analysis devices of the TRT gas system. It should be emphasised that during Run-1, GGSS was operating 100 % of the time when the TRT and ATLAS were taking physics data. To the date of this publication, the GGSS has not had a single fatal failure proving the robustness of the system design and of the methods and components chosen to build the system.
The GGSS has proven to be a key and very reliable component of the TRT detector meeting all design goals: system reliability confirmed by no fatal failures, accuracy of the gain stabilisation well within the range of ∼1 %. Moreover the GGSS is very sensitive to any active gas mixture changes, therefore it acts as a fast and accurate “sensor” of problems related to the active gas.
2016 JINST 11 P04027
2011
st
Days since March,1
0 20 40 60 80 100 120 140 160 HL/LL 0.062 0.064 0.066 0.068 0.07 0.072 0.074 0.076 0.078 0.08
Figure 15.Variation of HL hit faction on particle track during the 2011 running period.
The GGSS has contributed significantly to the global quality of the data acquired by the TRT detector and hence by whole ATLAS experiment. This was achieved by keeping the gas gain in the TRT detector within ∼1.5 % stable range, therefore HL hit fraction variation was reduced to about ∼3 %, which significantly contributes to the high capability of the particle identification in the ATLAS experiment.
After a successful major GGSS upgrade during the Long Shutdown 1 of the LHC, the system was ready for Run-2 physics data taking period and continues its operation.
Acknowledgments
This work was supported in part by the Polish National Science Centre, grant no. DEC-2013/08/M/ ST2/00320. This work was supported in part by the Turkish Atomic Energy Authority.
References
[1] ATLAS collaboration, The ATLAS Experiment at the CERN Large Hadron Collider,2008 JINST 3 S08003.
[2] ATLAS TRT collaboration, The ATLAS Transition Radiation Tracker (TRT) proportional drift tube:
design and performance,2008 JINST 3 P02013.
[3] ATLAS TRT collaboration, The ATLAS TRT end-cap detectors,2008 JINST 3 P10003. [4] ATLAS TRT collaboration, The ATLAS TRT Barrel Detector,2008 JINST 3 P02014.
[5] E. Hines for ATLAS collaboration, Performance of Particle Identification with the ATLAS Transition
Radiation Tracker, in Proceedings of Meeting of the APS Division of Particles and Fields (DPF 2011), Providence U.S.A. (2011) [arXiv:1109.5925].
2016 JINST 11 P04027
[6] T. Akesson et al., Straw tube drift-time properties and electronics parameters for the ATLAS TRTdetector,Nucl. Instrum. Meth. A 449(2000) 446.
[7] K. Lantzsch et al., The ATLAS Detector Control System,J. Phys. Conf. Ser. 396(2012) 1.
[8] A. Barriuso Poy et al., The detector control system of the ATLAS experiment,2008 JINST 3 P05006. [9] ATLAS TRT collaboration, The ATLAS TRT electronics,2008 JINST 3 P06007.
[10] T. Akesson et al., Particle identification using the time-over-threshold method in the ATLAS Transition
Radiation Tracker,Nucl. Instrum. Meth. A 474(2001) 172.
[11] B. Hallgren et al., The embedded local monitor board (ELMB) in the LHC front-end I/O control
system, at Electronics for LHC experiments, Stockholm Sweden (2001), pg. 325.
[12] C. Gaspar and B. Franek, Tools for the automation of large distributed control systems,IEEE Trans. Nucl. Sci. 53(2006) 974.
[13] J. Olszowska et al., The ATLAS Transition Radiation Tracker (TRT) Detector Control System, in