Nanotribological Properties of the h
‑BN/Au(111) Interface: A DFT
Study
Merve Baksi,
†Daniele Toffoli,
‡Oguz Gulseren,
§and Hande Ustunel
*
,† †Department of Physics, Middle East Technical University, Dumlupinar Blv 1, 06800 Ankara, Turkey‡Dipartimento di Scienze Chimiche e Farmaceutiche, Università degli Studi di Trieste, Via L. Giorgieri 1, I-34127 Trieste, Italy §Department of Physics, Bilkent University, 06800 Ankara, Turkey
*
S Supporting InformationABSTRACT: Understanding the quantum-mechanical ori-gins of friction forces has become increasingly important in the past decades with the advent of nanotechnology. At the nanometer scale, the universal Amontons−Coulomb laws cease to be valid, and each interface requires individual scrutiny. Because of the well-known lubricating properties of two-dimensional materials, a significant amount of research has been performed in an effort to understand interfaces they form with one another. However, the interfaces between these two-dimensional materials and metals red from a tribological point of view, important for such applications as friction force microscopy, have yet to be thoroughly investigated. In the current work, we present a detailed density functional theory
investigation of the hexagonal BN/Au(111) interface. Because of a good agreement between their characteristic lengths, a high level of commensurability is achieved in a suitably constructed model between the bulk surfaces of the two materials. As a result of our calculations, wefind that the corrugation in the potential energy surface and the lateral forces in this interface are low compared to other similar interfaces. The friction coefficient falls rapidly with increasing load down to 0.005 for the largest loads considered. In contrast, Aunclusters (n = 1, 4, 13, and 19) sliding on the h-BN surface exhibit much larger lateral forces,
indicating strong size and edge effects. The reduction of energy corrugation in going from the Au4to the Au19cluster may already indicate a decreasing trend with increasing size even at this very small scale.
1. INTRODUCTION
Two-dimensional materials have generated a great deal of interest due to their potential use as lubricants in nanoscale systems. In particular, graphene,1h-BN,2and MoS23have been predicted to exhibit exceptional performance in reducing friction and wear. In addition to providing a lubricating buffer layer between two surfaces in relative motion, two-dimensional materials have been observed to display very low friction forces while sliding on metal substrates.4 Ultralow friction, often termed superlubricity, most commonly emerges as a result of incommensurability between surfaces combined with weak interfacial interaction.5,6 However, even for components in perfect interfacial registry, such as bilayers of some two-dimensional materials, very low friction forces have been observed. A striking example of this is the fluorographene/ fluorographene bilayer interface7
where the energy corrugation, defined as the difference between the maximum and the minimum of the potential energy surface (PES), was calculated to be 0.31 meV/atom. In contrast, the graphene/graphene interface was found to display a corrugation of 6.47 meV/atom in a similar study.8
The experimental characterization of the tribological behavior of interfaces is performed with the use of atomic
force microscopy (AFM)9−11 or friction force microscopy (FFM)12,13techniques. The coating materials on the surfaces of the AFM/FFM tips can be chosen from a large selection including SiO2,10 Pt,14 and Cu.15 Whereas the tribological properties of interfaces between 2D materials have been extensively studied, the friction forces between these materials and metal substrates have been investigated in only a limited number of studies.16,17 Furthermore, as in the case of the graphene/Cu(111) interface,18 most asymmetric interfaces present a lattice mismatch, which calls for either large simulation cells or the application of strain. The h-BN/ Au(111) interface under investigation in the present work requires neither due to an extraordinarily high match between the two lattices, given a suitable choice of the simulation cell. We are therefore able to decouple the effect of the interaction from strain effects.
The theoretical basis of friction at the atomic level between two periodic surfaces was established by an array of seminal works. Building on the treatments in 1928 by Prandtl19and in Received: July 16, 2019
Revised: October 22, 2019
Published: October 28, 2019
pubs.acs.org/JPCC
1929 by Tomlinson,20 the earliest theory was developed by Sokoloff21 for two periodic surfaces in contact, whose atoms interact with simple springs. These models identified two regimes of relative motion, stick−slip and continuous sliding, which emerge through an interplay between the corrugation and the rigidity of the materials in contact. In a more modern treatment, Zhang and Tomanek illustrated the calculation of the lateral friction forces and eventually the friction coefficient for a model system of a single Pd atom sliding on a Pd surface using density functional theory (DFT).22 More recently, Cahangirov et al. presented a straightforward way of translating the DFT PES data to stick−slip criteria,23establishing the link between phenomenological parameters such as the stick−slip threshold and atomistic DFT results. The conclusion from this body of work is that a lower corrugation correlates with lower friction forces and motion in the continuous sliding regime.
Experimental setups designed to measure friction forces often involve contact and sliding between a coated AFM tip and the material of interest. It is, however, rather difficult to induce relative lateral motion between two sheets of material. Some techniques for overcoming this difficulty are summarized in the review by Baykara et al.24 In this respect, DFT calculations are of utmost utility since they can easily map the PES between surfaces of virtually any kind. For instance, the DFT work by Wang et al.8 identified the graphene/MoS2 contact as an extremely low-friction surface due to the lack of charge densityfluctuations during sliding.
In this work, we aim to investigate the static limit of the friction forces between the Au(111) surface and h-BN. We approach this problem from two different directions. The first part of our results deals with the atomically perfect interface between the bulk Au(111) surface and an infinitely repeated periodic h-BN sheet. In the second part, we focus on the friction forces between Aunclusters (n = 1, 4, 13, and 19) and a
perfect h-BN sheet. The motivation here is to understand the effect of imperfections such as tip edges or protrusions which usually act to increase the friction forces. Wefinally present a summary of our most important conclusions.
2. COMPUTATIONAL DETAILS
All of the calculations presented in this work were performed using the open-source code suite Quantum ESPRESSO.25The simulation cell used in the bulk interface calculations between the Au(111) surface and the h-BN sheet, shown with a red parallelogram inFigure 1, was composed of 12 Au atoms (4 atomic layers) and 4 BN pairs. Because of the exceedingly small energy differences between different configurations, all bulk calculations were performed within tight thresholds. Integrals over the Brillouin zone were computed using a 12× 20 × 1 Monkhorst−Pack26 k-point mesh along with a cold-smearing scheme of a width of 0.01 Ry.27The kinetic energy and augmentation charge thresholds for the plane-wave expansion were 60 and 600 Ry, respectively. Going from a cutoff energy of 50 Ry and a k-point mesh of 17 × 10 to a cutoff energy of 60 Ry and k-point mesh of 20 × 12 changes the corrugation in the total energy by only about 0.04 meV for the entire simulation cell. We therefore conclude that our results are well converged for the calculation parameters used. Geometry optimizations were performed using the Broyden− Fletcher−Goldfarb−Shanno (BFGS) algorithm28−31 until all atomic forces were lower than about 4.0× 10⁻⁵nN. During geometry optimizations involving the Au slab, the bottom two layers of the slab were fixed to mimic bulk behavior. The
convergence criterion for electronic energies within a single self-consistentfield step was kept at a conservative value of 0.5 × 10⁻¹²eV/atom. The vacuum between periodic images along
the direction normal to the surface was kept at∼13 Å. Larger vacuum values were tested and were found to yield very similar results. The weak interaction between the h-BN sheet and the underlying Au surface was modeled by using the vdW-DF232 functional with the C09 exchange partner.33The ion−electron interaction was modeled by using ultrasoft pseudopotentials.34 The figures of merit we consider here for quantifying interfacial friction are the magnitude of the corrugation in the PES of interaction between Au and h-BN and that of the lateral forces in the sliding direction as a function of vertical load. The corrugation is defined as
Δ =E Emax −Emin (1)
where Emaxand Eminare the maximum and minimum values of the PES within an entire spatial domain or along a certain direction. We constructed the PES by means of calculating the adhesion energy of the h-BN layer to the Au surface on an 11 × 11 grid of relative positions as shown inFigure 1. At each point of the grid, a partial geometry optimization was performed where the atoms were allowed to move along the normal axis (z-axis as defined in Figure 1) while kept fixed
Figure 1.h-BN/Au(111) interface is shown from the top (top panel). The red parallelogram represents the simulation cell used here. The slab geometry for the h-BN/Au(111) interface is shown from the top and from the side (middle panels). Path 1 and Path 2 correspond to the sliding directions followed for the fixed-distance calculations. Yellow, blue, and pink spheres represent gold, nitrogen, and boron atoms, respectively. The diminishing size of the yellow spheres indicates deeper crystal layers with respect to the surface. The potential energy surface (PES) of the interface is shown in the bottom left panel with some of the local minima and maxima labeled with letters. Configurations corresponding to each letter are shown in the lower right panel. The blue rectangle is a representative area included to clarify the relative location of the two materials.
along the plane of the sheet (the xy-plane). This procedure yields the PES under zero load.
In preparation for the finite load analysis, we performed single-point self-consistent field (SCF) calculations at a number of evenly spaced points, {xi}, along the directions labeled Path 1 and Path 2 inFigure 1. For each set of such calculations, the vertical distance between the two surfaces were keptfixed. We scanned vertical distances ranging from 2.8 to 3.6 Å in steps of 0.1 Å. At each vertical distance, we calculated the component of the total lateral force (FL(xi))
along the sliding path and the total vertical load (FN(xi)) for all {xi}. Once the data were collected, we obtained the lateral
force corresponding to the desired load, FN, via a spline interpolation at each point xi. The lateral forces FL(xi) were
calculated via two methods: using the total Hellmann− Feynman forces on the h-BN atoms, obtained directly at the end of the SCF run (the direct method) and by means of differentiating the total energy surface with respect to the sliding coordinate for the desired load (the derivative method). We then calculated the average of the lateral force over the total sliding direction using
∑
= ′ = F N F x 1 ( ) L i N L i 1 (2)where the prime refers to a condition imposed on the sum where only negative values of FL are considered. In other
words, only those positions that result in a force opposing the motion are included in the calculation of the average lateral force. N is then the total number of points included in this sum. As a simple check, the lateral forces were estimated by a third method, which we refer to as the Min/Max method. This method involves a simple division of the energy difference between the maximum and the minimum point of the energy landscape by the distance between them. Results from all three methods were seen to agree well as presented later in the text. Once the average lateral force, FL, over a certain distance
along the sliding path was calculated for a given load FN, the
static friction coefficient was calculated within the standard definition via
μ = F F
L
N (3)
Because the bulk calculations are performed for an infinite interface, we present our results in terms of the intensive normal pressureσN σ = F A N N (4)
where A is the surface area of the supercell described above. As a means of quantifying size and edge effects, we also investigated the lateral forces on Au1, Au4, Au13, and Au19 clusters as they slide along the armchair direction on a single h-BN sheet. At each point, the adsorption energies and the lateral forces were computed under zero load, which necessitates a geometry optimization with only the z-coordinates of the atomic positions free to move. We used 3× 3, 4 × 4, and 6 × 6 h-BN simulation cells for the Au1, Au4, and Au13clusters with Monkhorst−Pack meshes of 6 × 6 × 1, 4 × 4 × 1, 6 × 6 × 1, and 6× 6 × 1 kpoints, respectively. We used a larger kpoint set for the two largest cluster sizes for a more accurate calculation of potentially high magnetic moments. The plane-wave kinetic energy and the augmentation charge thresholds used for all
cluster calculations were 40 and 400 Ry, respectively. All cluster calculations were conducted within spin-polarized DFT. The morphology of Au clusters has been the subject of many theoretical studies.35−37 For the current treatment, the rhomboid, icosahedral truncated, and pyramid geometries were selected for the Au4, Au13, and Au19, respectively. All
clusters were initially geometry optimized in a large cubic unit cell at the Γ point. Following this initial optimization, the clusters were placed on the h-BN network at a suitable high-symmetry location, and the combined system was geometry optimized one more time. For details on the cluster geometries and their magnetic properties before and after their adsorption on the h-BN layer, we refer the reader to the Supporting Information.
In spite of the fact that variations in the energy surface are more relevant to the problem of tribology instead of the absolute values of the adhesion energies, we calculate the adhesion energies using the formula
= + − −
Eadh Esubst ads Esubst Eads (5)
where Esubst+ads is the total energy of the substrate and the
adsorbate, Esubstis the total geometry optimized energy of the
substrate by itself, and Eadsis the total energy of the geometry optimized adsorbate. In the case of the bulk interface, the h-BN layer is considered to be the adsorbate while in the case of the Au clusters, the term adsorbate refers to the cluster in question. The isolated adsorbate energies as well as those of the substrate were calculated by using the same vdW-DF2-C09 protocol of the main calculations for the sake of consistency. 3. RESULTS AND DISCUSSION
3.1. h-BN/Au(111) Interface. In most periodic DFT-based bulk interface studies, a strain is applied to one or both of the materials in question to fit both materials into a computationally accessible shared simulation cell. This strain may be tensile or compressive as needed. In the case of the h-BN/Au(111) interface, the choice of a 2× 2 h-BN cell on top of a 3× 1 Au(111) surface cell, shown inFigure 1, turns out to be a near perfect match, using our calculated bond lengths of dAu−Au= 2.90 Å and dB−N= 1.45 Å. As a result, no strain was applied to either material for our bulk calculations. If used instead of the computational ones, the experimentally determined bond lengths (2.87 Å for Au38and 1.44 Å for h-BN15) necessitate a 0.2% tensile strain on the h-BN component. This strain is still minimal and is not expected to affect the results significantly. The interface constructed as described has a high degree of coincidence because of its small repeating unit in addition to being strain-free. This model therefore presents an opportunity for exploring the upper limits of friction between the two components.
The PES calculated at zero load for this interface (Figure 1) presents an exceptionally mild corrugation of ∼0.3 meV/BN pair. As a comparison, Table 1 lists a set of corrugations calculated for a set of interfaces using DFT, taken from various sources in the literature. The h-BN/Au(111) interface studied here falls in the low corrugation regime among the values presented in this table, much smaller than the perfectly matching, symmetric interfaces displayed. Its corrugation is, on the other hand, much closer to the asymmetric interfaces FG/ MoS27 and graphene/MoS2.8 The corrugation of the graphene/MoS2 interface is the lowest of all the values
presented here; however, the degree of incommensurability is larger than our case. Furthermore, the“per atom” ΔE values The Journal of Physical Chemistry C
quoted for both the FG/MoS2and graphene/MoS2interfaces are likely a result of the division of the totalΔE value of the supercell by the total number of atoms, whereas in our case we divide only by the number of the BN atoms. We, thus, conclude that in spite of the coincidence between the atoms in our interface, the corrugation is small. Both of the asymmetric interfaces presented inTable 1 are between two-dimensional sheets. As a more relevant comparison, we mention the DFT study by Toyoda et al. where a peak-to-valley difference in the adhesion energy of about 12 meV/atom for the graphene/ Cu(111) interface18was reported. Even though this interface is known to be very weak, this value is much larger than our result. It must, however, be noted for the sake of a fair comparison that in the work of Toyoda et al. a 1× 1 unit cell of graphene was used, which was placed under strain to perfectly match the underlying Cu substrate.
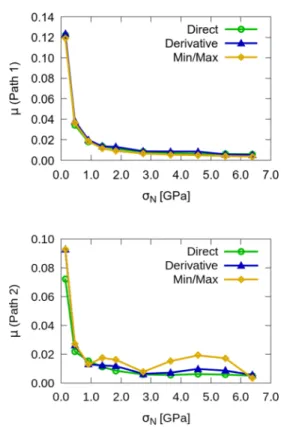
Small corrugation directly correlates with low friction coefficients under vertical load. In the current work, the behavior of the interface under vertical load along Path 1 and Path 2 inFigure 1is studied as described in theComputational Detailssection. The total lateral distance covered is∼1.45 Å along the x-direction for Path 1 and 1.68 Å along the y-direction for Path 2. The adhesion energies as a function of sliding distance are given inFigure S1for a variety of vertical separations. Maximum adhesion energies and corrugations for all separations are displayed inTable 2, and friction coefficients for variable a vertical load are reported inFigure 2.
The friction coefficients exhibit a rapidly decreasing trend with increasing vertical load. For the smallest load considered
here, namelyσN= 0.01 GPa, the friction coefficient calculated
by using the derivative of the PES is 0.12 for sliding along the x-direction. As the load increases,μ decreases all the way down to 0.005 atσN= 1.4 GPa. This behavior is commonly observed in atomically perfect interfaces.43 A careful analysis of the individual lateral components of the Hellmann−Feynman forces yields insight into this behavior. For this analysis, we concentrate on the range of separations between d = 2.8 Å and d = 3.1 Å. As depicted in Figure S2, the projection of the atomic forces onto the plane of the h-BN sheet varies greatly both in direction and in magnitude depending on relative location of the two materials. We therefore collect all individual atomic forces at all locations along each path and consider the trends. In this range of separations, overall, the lateral forces grow for motion along the x direction (Path 1 in
Figure 1) as a function of increasing load as shown inFigure 3. However, the increase in the average lateral forces in the direction opposite to motion turns out to be slower than the increase in the vertical load, thereby causing the emergence of a decreasing trend in FL/FN (lower panel of Figure 3). In addition to the slower increase of FL, it is also shifted; in other
words, FLis not zero at zero load. Along the y direction (Path 2), the forces appear to be largely independent of separation, once again resulting in a decrease in FL/FN. Separations larger than d = 3.1 Å resulted in atomic forces mostly along the direction of motion rather than in the opposite direction and are therefore excluded from this analysis. Exceptions to this behavior can be seen in other two-dimensional interfaces. For instance, the Tin+1CnMXenes investigated computationally by
Table 1. Potential Energy Surface Corrugation (meV/ Atom) Values Calculated for Interfaces in Several Computational Studies Are Compared with the Value Obtained in the Current Worka
interface ΔE source
graphene/Cu(111) ≈12 ref18
graphene/graphene ≈10 ref39
h-BN/h-BN ≈10 ref40
MoS2/MoS2 ≈3.3 ref41
HG/HG 0.96 ref7
FG/FG 0.31 ref7
FG/MoS2 0.14 ref42
graphene/MoS2 0.046 ref8
h-BN/Au(111) 0.15 current work
aHG and FG stand forfluorographene and hydrogenated graphene, respectively.
Table 2. Maximum Value of the Adhesion Energy (Eadhin
meV/BN unit) and the Corrugation (ΔExandΔEyin meV/ BN unit) of the h-BN/Au Interface as a Function of Interlayer Separationz (Å)
z max Eadh ΔEx ΔEy
2.8 120 1.83 1.45 2.9 145 1.47 1.30 3.0 160 1.22 1.09 3.1 168 0.93 0.84 3.2 170 0.73 0.70 3.3 168 0.58 0.65 3.4 164 0.48 0.45 3.5 157 0.40 0.39 3.6 150 0.33 0.25
Figure 2.Friction coefficient as a function of vertical pressure for Path 1 along x (upper panel) and Path 2 along y (lower panel). Results from three calculation methods are presented, namely from Hellmann−Feynman forces, numerical derivative of the PES, and the estimate from the maximum and minimum of the PES. For details, we refer the reader to theComputational Detailssection of the text.
Zhang show the opposite trend, where μ increases almost linearly withσN.
44
Several studies have linked the tribological behavior of interfaces to the interfacial charge density profile.45−47 The
majority of these studies focus on symmetric interfaces where both materials donate an equal amount of charge to the interface, whose magnitude determines the adhesion energy and friction forces. The h-BN/Au(111) interface is, however,
Figure 3.Atomic lateral forces (top) and the ratio of the atomic lateral forces to the load (bottom) are plotted for Path 1 (x direction) and Path 2 (y direction). Each data point corresponds to the Hellmann−Feynman force on a single atom along the orientation of displacement. Only those forces that point in the opposite direction to that of the displacement are displayed. The black line is the average of the points displayed in this graph. Each cluster of points refers to a different interlayer distance.
Figure 4.Charge density difference at a distance of z = 2.8 Å (left panels) and z = 3.1 Å (right panels) at the point (x, y) = (0, 1.45) Å as defined in
Figure 1. Countour plots at three heights (BN sheet (1), topmost Au layer (3), and the midplane between the two materials (2)) are also shown together with the plane-averaged charge density difference. On the plane-averaged Δρ plots the three planes are marked with vertical lines. Red areas represent an excess of negative charge, and blue areas represent depletion.
between a covalently bonded material with polar bonds and a metal. The behavior of the charge transfer upon the formation of the interface is therefore expected to be somewhat different. In Figure 4, we present the charge density difference and its plane-average (along z) for d = 2.8 Å and d = 3.1 Å. The interface appears to be highly polarized with an electron excess region near the Au(111) surface and an electron depletion region near the h-BN layer. Interestingly, the net electron charge is supplied by both materials. As a result, although the interface is polarized, its overall charge remains negative. It is also worth noting that although the amount of positive and negative charges are individually smaller for the d = 3.1 Å separation, the total integrated negative charge in the interface (defined as the distance between the top Au layer and the h-BN layer) increases from 1.0× 10⁻⁵to 1.6× 10⁻⁵e/Å3going
from d = 2.8 Å to d = 3.1 Å. This is consistent with the increase in the adhesion energy for the larger separation (seeTable 2). 3.2. Au Clusters on h-BN. The bulk model of the interface provides a rather idealized view of its tribological properties. In actual experiments, the metal component is either in the form of a sharp AFM tip10 or islands manipulated by an AFM tip.48−50 Through these experimental studies, the importance of the size and edge effects have been convincingly established. To address these issues and to understand the transition between a high-adhesion cluster geometry and a low-friction bulk interface, we analyze the frictional properties of the h-BN/Aun (n = 1, 4, 13, and 19) interface by means of comparing the lateral forces (Figure 5). Before transferring the clusters to the h-BN surface, a geometry optimization was performed. Upon interaction with h-BN, the Au4 and Au19
clusters maintain their geometry while the Au13 cluster was
seen to undergo a substantial structural rearrangement. For details of the cluster geometries before and after adsorption, see section 2 of theSupporting Informationalong withFigure S3.
The optimized geometries and optimized distances of the clusters at the beginning of the sliding path are displayed in
Figure S4. All four clusters are seen to rest at a vertical distance much smaller than the equilibrium h-BN/Au(111) separation in bulk form. The interaction is especially strong for Au4, which
assumes a tilted configuration even though the initial configuration before the geometry optimization is flat. This final tilted configuration was reproduced for different coverages and starting conditions and was therefore deemed to be robust. All cluster calculations were performed at zero load. The energy corrugation and the average friction force values are presented in Figure 5. Similarly to the bulk interface calculations, the forces are computed by using both the numerical derivatives of the energy and the Hellmann− Feynman forces. Once again, the agreement is very good (Figure S5).
Considered on a per atom basis, the single Au atom has the largest corrugation. However, in the case of the tilted Au4 cluster, there is a single atom in immediate contact with the surface. Similarly, in the case of the Au13and Au19clusters, four
and ten atoms are in direct contact with the surface, respectively. Viewed from this perspective, Au4 appears to
display the largestΔE/atom value while the corrugation is the smallest for Au19. The decreasing lateral forces with increasing
cluster size may possibly indicate a trend of decreasing friction force with increasing contact area.
Beyond these general observations, some details of the cluster results are also noteworthy. The maximum and the minimum of the Au1 energy profile shown in Figure 5
correspond to locations that are on top of a hollow site and directly on top of a B atom, respectively. As mentioned above, similarly to Au1, the Au4cluster also interacts with the surface mostly through a single atom namely the atom that is closest to the surface. As a result of this, the maximum and the minimum of the energy landscape appear at identical locations, namely on top of the B atom (configuration 1 inFigure 5) and the hollow site (configuration 3 inFigure 5). Because of the larger contact area of the Au13cluster, the minima and maxima are
not as well-defined as the smaller clusters. As explained in the
Supporting Information, upon adsorption on the h-BN sheet, the Au13 cluster undergoes a sizable distortion. In its new
distorted cuboctahedron geometry, the bottommost four atoms form a slightly distorted square. Configuration 1, displayed in Figure 5, corresponds to a geometry in which the geometric center of these four atoms are directly above a N atom. On the other hand, for configuration 3, this center is on top of a hollow site. In contrast, the Au19 cluster largely
maintains its truncated pyramidal shape upon adsorption. In configuration 1, all ten of the bottommost atoms are almost perfectly coincident with hexagon centers of the h-BN layer, whereas in configuration 3 the Au atoms are largely on top of B or N atoms.
As a means of providing a detailed account of atomic contributions to the lateral forces on the clusters, we break down the lateral forces as a function of vertical distance from the h-BN sheet. As shown inFigure S6, Au4, Au13, and Au19
can all be broken down into three atomic layers each. The bottom layer is defined to be the collection of those atoms (one, four, and ten atom in the case of Au4, Au13, and Au19
Figure 5.Top panels: adhesion energies and the total lateral forces for the Aunclusters (n = 1, 4, 13, and 19). Bottom panels: configurations that correspond to the extrema of the lateral forces labeled 1, 2, and 3 in the top panels.
clusters, respectively) that are closest to the h-BN sheet. The total lateral forces, summed over each layer, when plotted against displacement along the sliding direction, reveal that the interaction of Au4 with h-BN is predominantly due to the
bottommost layer (i.e., a single atom). This also applies to a large extent to Au13 and Au19; however, there is a sizable
contribution, at some points of equal magnitude, of the mid and top layers to lateral forces. Along most of the sliding path for both clusters, the forces on the mid and top layers are of similar magnitude and opposite direction and therefore cancel each other.
Another manifestation of the strong interaction and of the edge effects is the induction of ripples in the h-BN substrate as the clusters move along the sliding path illustrated inFigure 5. As the cluster moves, portions of h-BN directly underneath are depressed while adjacent portions are elevated (Figure S7). This effect is seen clearly in the animated sequences created for all four clusters as they slide, which is presented as a part of the
Supporting Information. The amplitudes of the ripples, defined as the difference between the highest and the lowest point of the h-BN sheet (Δz), are shown in Figure S7. According to these results, while the general trend is similar across all clusters, Au13and Au19clusters both induce distortions that are about 4 times larger than the other two clusters. It is also interesting to note that for all four clusters the extrema of the ripple magnitudes coincide with those of the lateral forces. This emphasizes once again the importance of the edge effects, especially for small clusters.
4. CONCLUSIONS
The interface between the h-BN and Au(111), explored here, to our knowledge for the first time in the nanotribological context, displays a wealth of interesting behavior. This interface offers a unique opportunity to explore the electronic origins of ultralow friction forces rather than structural ones since it presents a high level of coincidence between the two materials. At zero vertical load, the interface between the bulk materials presents an exceedingly small corrugation of about 0.3 meV/atom. As a direct result of this corrugation, the lateral friction forces opposing motion were also found to be small. The friction coefficients were found to vary inversely with vertical load between 0.12 and 0.005 for the range of loads studied here. These values can be considered low as defined in the literature.
In contrast to the bulk interface, the calculated corrugation for the sliding of Aun(n = 1, 4, and 13) clusters on h-BN is
much larger. The largest contribution to the lateral forces are due to those atoms of the cluster that are in direct contact with the h-BN layer. For the Au4and Au13clusters, this amounts to
one and four atoms, respectively. In addition to the larger lateral forces, secondary effects such as structural deformation of the clusters upon adsorption and ripples formed in the h-BN substrate during sliding provide further evidence to the importance of the edge and size effects on the nanotribological properties
■
ASSOCIATED CONTENT*
S Supporting InformationThe Supporting Information is available free of charge on the
ACS Publications websiteat DOI:10.1021/acs.jpcc.9b06767. Adhesion energy of the hBN/Au(111) surface along two perpendicular directions of sliding, atomic forces in
vector representation, geometry comparisons of isolated and adsorbed clusters, in-depth analysis of the forces on the clusters as they slide (PDF)
Four animated GIF sequences of the four clusters as they slide along the h-BN surface (ZIP)
■
AUTHOR INFORMATION Corresponding Author *E-mail:[email protected]. ORCID Daniele Toffoli:0000-0002-8225-6119 Oguz Gulseren:0000-0002-7632-0954 Hande Ustunel: 0000-0003-0307-9036 NotesThe authors declare no competingfinancial interest.
■
ACKNOWLEDGMENTSThis work isfinancially supported by TUÜBITAK, Scientific and Technological Research Council of Turkey (Grant 115F493). The computational resources were provided by the National Center for High Performance Computing (UHeM). The authors thank Dr. Mehmet Zeyyad Baykara for his valuable comments on the manuscript.
■
REFERENCES(1) Marchetto, D.; Feser, T.; Dienwiebel, M. Microscale study of frictional properties of graphene in ultra high vacuum. Friction 2015, 3, 161−169.
(2) Kimura, Y.; Wakabayashi, T.; Okada, K.; Wada, T.; Nishikawa, H. Boron nitride as a lubricant additive. Wear 1999, 232, 199−206.
(3) Domínguez-Meister, S.; Rojas, T. C.; Brizuela, M.; Sánchez-López, J. C. Solid lubricant behavior of MoS2 and WSe2-based nanocomposite coatings. Sci. Technol. Adv. Mater. 2017, 18, 122−133. (4) Kawai, S.; Benassi, A.; Gnecco, E.; Sode, H.; Pawlak, R.; Feng, X.; Mullen, K.; Passerone, D.; Pignedoli, C. A.; Ruffieux, P.; et al. Superlubricity of graphene nanoribbons on gold surfaces. Science 2016, 351, 957−961.
(5) Zhang, H.; Fu, Z. H.; Legut, D.; Germann, T. C.; Zhang, R. F. Stacking stability and sliding mechanism in weakly bonded 2D transition metal carbides by van der Waals force. RSC Adv. 2017, 7, 55912−55919.
(6) Pierno, M.; Bruschi, L.; Mistura, G.; Paolicelli, G.; Di Bona, A.; Valeri, S.; Guerra, R.; Vanossi, A.; Tosatti, E. Frictional transition from superlubric islands to pinned monolayers. Nat. Nanotechnol. 2015, 10, 714−718.
(7) Wang, L. F.; Ma, T. B.; Hu, Y. Z.; Wang, H.; Shao, T. M. Ab initio study of the friction mechanism of fluorographene and graphane. J. Phys. Chem. C 2013, 117, 12520−12525.
(8) Wang, L.; Zhou, X.; Ma, T.; Liu, D.; Gao, L.; Li, X.; Zhang, J.; Hu, Y.; Wang, H.; Dai, Y.; et al. Superlubricity of a graphene/MoS2 heterostructure: a combined experimental and DFT study. Nanoscale 2017, 9, 10846−10853.
(9) Vasić, B.; Stanković, I.; Matković, A.; Kratzer, M.; Ganser, C.; Gajić, R.; Teichert, C. Molecules on rails: Friction anisotropy and preferential sliding directions of organic nanocrystallites on two-dimensional materials. Nanoscale 2018, 10, 18835−18845.
(10) Jiang, T.; Zhu, Y. Measuring graphene adhesion using atomic force microscopy with a microsphere tip. Nanoscale 2015, 7, 10760− 6.
(11) Lee, C.; Wei, X. D.; Li, Q. Y.; Carpick, R.; Kysar, J. W.; Hone, J. Elastic and frictional properties of graphene. Phys. Status Solidi B 2009, 246, 2562−2567.
(12) Shi, R.; Gao, L.; Lu, H.; Li, Q.; Ma, T.-B.; Guo, H.; Du, S.; Feng, X.-Q.; Zhang, S.; Liu, Y.; et al. Moiré superlattice-level stick-slip
instability originated from geometrically corrugated graphene on a strongly interacting substrate. 2D Mater. 2017, 4, 025079.
(13) Filleter, T.; McChesney, J.; Bostwick, A.; Rotenberg, E.; Emtsev, K.; Seyller, T.; Horn, K.; Bennewitz, R. Friction and dissipation in epitaxial graphene films. Phys. Rev. Lett. 2009, 102, 086102.
(14) Carpick, R. W. Measurement of interfacial shear (friction) with an ultrahigh vacuum atomic force microscope. J. Vac. Sci. Technol., B: Microelectron. Process. Phenom. 1996, 14, 1289.
(15) Li, L. H.; Chen, Y.; Behan, G.; Zhang, H.; Petravic, M.; Glushenkov, A. M. Large-scale mechanical peeling of boron nitride nanosheets by low-energy ball milling. J. Mater. Chem. 2011, 21, 11862−11866.
(16) Restuccia, P.; Righi, M. C. Tribochemistry of graphene on iron and its possible role in lubrication of steel. Carbon 2016, 106, 118− 124.
(17) Trillitzsch, F.; Guerra, R.; Janas, A.; Manini, N.; Krok, F.; Gnecco, E. Directional and angular locking in the driven motion of Au islands on MoS2. Phys. Rev. B: Condens. Matter Mater. Phys. 2018, 98, 165417.
(18) Toyoda, K.; Nozawa, K.; Matsukawa, N.; Yoshii, S. Density functional theoretical study of graphene on transition-metal surfaces: The role of metal d-band in the potential-energy surface. J. Phys. Chem. C 2013, 117, 8156−8160.
(19) Prandtl, L. Ein gedankenmodell zur kinetischen theorie der festen krper. Z. Angew. Math. Mech. 1928, 8, 85−106.
(20) Tomlinson, G.A. A molecular theory of friction. Philos. Mag. 1929, 7, 905−939.
(21) Sokoloff, J. B. Theory of atomic level sliding friction between ideal crystal interfaces. J. Appl. Phys. 1992, 72, 1262−1270.
(22) Tomanek, D.; Zhong, W.; Thomas, H. Calculation of an atomically modulated friction force in atomic-force Microscopy. Europhys. Lett. 1991, 15, 887−892.
(23) Cahangirov, S.; Ataca, C.; Topsakal, M.; Sahin, H.; Ciraci, S. Frictional figures of merit for single layered nanostructures. Phys. Rev. Lett. 2012, 108, 1−5.
(24) Baykara, M. Z.; Vazirisereshk, M. R.; Martini, A. Emerging superlubricity: A review of the state of the art and perspectives on future research. Appl. Phys. Rev. 2018, 5, 041102.
(25) Giannozzi, P.; Baroni, S.; Bonini, N.; Calandra, M.; Car, R.; Cavazzoni, C.; Ceresoli, D.; Chiarotti, G. L.; Cococcioni, M.; Dabo, I.; et al. QUANTUM ESPRESSO: a modular and open-source software project for quantum simulations of materials. J. Phys.: Condens. Matter 2009, 21, 395502.
(26) Monkhorst, H. J.; Pack, J. D. Special points for Brillouin-zone integrations. Phys. Rev. B 1976, 13, 5188−5192.
(27) Marzari, N.; Vanderbilt, D.; Payne, M. C. Ensemble density-functional theory for ab initio molecular dynamics o f metals and finite-temperature insulators. Phys. Rev. Lett. 1997, 79, 1337−1340.
(28) Broyden, C. G. The convergence of a class of double-rank minimization algorithms 1. general considerations 1970, 6, 76−90.
(29) Fletcher, R. A new approach to variable metric algorithms. Computer Journal 1970, 13, 317−22.
(30) Goldfarb, D. A familly of variable-metric methods derived by variational means. Mathematics of Computation 1970, 24, 23−26.
(31) Shanno, D. F. Conditioning of quasi-Newton methods for function minimization. Mathematics of Computation 1970, 24, 647− 656.
(32) Lee, K.; Murray, E. D.; Kong, L.; Lundqvist, B. I.; Langreth, D. C. Higher-accuracy van der Waals density functional. Phys. Rev. B: Condens. Matter Mater. Phys. 2010, 82, 081101.
(33) Cooper, V. R. Van der Waals density functional: An appropriate exchange functional. Phys. Rev. B: Condens. Matter Mater. Phys. 2010, 81, 161104.
(34) Vanderbilt, D. Soft self-consistent pseudopotentials in a generalized eigenvalue formalism. Phys. Rev. B: Condens. Matter Mater. Phys. 1990, 41, 7892.
(35) Shafai, G.; Hong, S.; Bertino, M.; Rahman, T. S. Effect of ligands on the geometric and electronic structure of au13 clusters. J. Phys. Chem. C 2009, 113, 12072−12078.
(36) Mori, T.; Hegmann, T. Determining the composition of gold nanoparticles: a compilation of shapes, sizes, and calculations using geometric considerations. J. Nanopart. Res. 2016.
(37) Gruene, P.; Rayner, D. M.; Redlich, B.; van der Meer, A. F. G.; Lyon, J. T.; Meijer, G.; Fielicke, A. Structures of neutral Au7, Au19, and Au20 clusters in the gas phase. Science 2008, 321, 674−676.
(38) Davey, W. P. Precision measurements of the lattice constants of twelve common metals. Phys. Rev. 1925, 25, 753−761.
(39) Reguzzoni, M.; Fasolino, A.; Molinari, E.; Righi, M. C. Potential energy surface for graphene on graphene: Ab initio derivation, analytical description, and microscopic interpretation. Phys. Rev. B: Condens. Matter Mater. Phys. 2012, 86, 1−7.
(40) Gao, W.; Tkatchenko, A. Sliding mechanisms in multilayered hexagonal boron nitride and graphene: The effects of directionality, thickness, and sliding constraints. Phys. Rev. Lett. 2015, 114, 1−5.
(41) Wang, C.; Chen, W.; Zhang, Y.; Sun, Q.; Jia, Y. Effects of vdW interaction and electric field on friction in MoS2. Tribol. Lett. 2015, 59, 7.
(42) Wang, L.-F.; Ma, T.-B.; Hu, Y.-Z.; Zheng, Q.; Wang, H.; Luo, J. Superlubricity of two-dimensional fluorographene/MoS2heterostruc-ture: a first-principles study. Nanotechnology 2014, 25, 385701.
(43) Wang, J.; Li, J.; Li, C.; Cai, X.; Zhu, W.; Jia, Y. Tuning the nanofriction between two graphene layers by external electric fields: a density functional theory study. Tribol. Lett. 2016, 61, 1−6.
(44) Zhang, D.; Ashton, M.; Ostadhossein, A.; van Duin, A. C.; Hennig, R. G.; Sinnott, S. B. Computational study of low interlayer friction in Tin+1Cn (n = 1, 2 and 3) MXene. ACS Appl. Mater. Interfaces 2017, 9, 34467−34479.
(45) Wolloch, M.; Levita, G.; Restuccia, P.; Righi, M. C. Interfacial charge density and its connection to adhesion and frictional forces. Phys. Rev. Lett. 2018, 121, 26804.
(46) Wang, J.; Li, J.; Fang, L.; Sun, Q.; Jia, Y. Charge distribution view: large difference in friction performance between graphene and hydrogenated graphene systems. Tribol. Lett. 2014, 55, 405−412.
(47) Cahangirov, S.; Ciraci, S.; Özçelik, V. O. Superlubricity through graphene multilayers between Ni(111) surfaces. Phys. Rev. B: Condens. Matter Mater. Phys. 2013, 87, 1−8.
(48) Cihan, E.; Kusku, S. I.; Durgun, E.; Baykara, M. Z. Structural lubricity under ambient conditions. Nat. Commun. 2016, 7, 12055.
(49) Brndiar, J.; Turanský, R.; Dietzel, D.; Schirmeisen, A.; Stich, I. Understanding frictional duality and bi-duality: Sb-nanoparticles on HOPG. Nanotechnology 2011, 22, 085704.
(50) Varini, N.; Vanossi, A.; Guerra, R.; Mandelli, D.; Capozza, R.; Tosatti, E. Static friction scaling of physisorbed islands: the key is in the edge. Nanoscale 2015, 7, 2093−2101.