Contents lists available at ScienceDirect
The
Journal
of
Systems
and
Software
journal homepage: www.elsevier.com/locate/jss
Integrating
social
features
into
mobile
local
search
Basri
Kahveci
a , ∗,
˙Ismail
Sengör
Altıngövde
b,
Özgür
Ulusoy
a a Bilkent University, 06800 Bilkent, Ankara, Turkeyb Middle East Technical University, 06800 Çankaya, Ankara, Turkey
a
r
t
i
c
l
e
i
n
f
o
Article history: Received 24 April 2016 Revised 18 August 2016 Accepted 12 September 2016 Available online 13 September 2016 Keywords:
Mobile search Mobile local search
Location-based social networks
a
b
s
t
r
a
c
t
AsavailabilityofInternetaccessonmobiledevicesdevelopsyearafteryear,usershavebeenabletomake useofsearchserviceswhileonthego.Locationinformationonthesedeviceshasenabledmobileusers touselocal searchservicestoaccess varioustypesoflocation-relatedinformation easily.Mobile local searchisinherentlydifferentfromgeneralwebsearch.Namely,itfocusesonlocalbusinessesandpoints ofinterestinsteadofgeneralwebpages,andfindsrelevantsearchresultsbyevaluatingdifferentranking features. Italsostrongly dependsonseveralcontextualfactors,suchas time, weather,locationetc.In previousstudies,rankingsandmobileusercontexthavebeeninvestigatedwithasmallsetoffeatures. Wedevelopedamobilelocalsearchapplication,Gezinio,andcollectedadatasetoflocalsearchqueries withnovicesocialfeatures.Wealsobuiltrankingmodelstore-ranksearchresults.Werevealthatsocial featurescanimproveperformanceofthemachine-learnedrankingmodelswithrespecttoabaselinethat solelyrankstheresultsbasedontheirdistancetouser.Furthermore,wefindoutthatafeaturethatis importantforrankingresultsofacertainquerycategorymaynotbesousefulforothercategories.
© 2016 Elsevier Inc. All rights reserved.
1. Introduction
As availability of internet access on mobile devices increases year after year, users have been able to make use of mobile in- ternet and search services while on the go. In parallel with the growth of the mobile internet usage, many studies have been con- ducted in the field of mobile search. In an early study, Kamvar and Baluja (2006) state that diversity of queries and number of queries per session on mobile cellphones are far less than on desktop. They also compare search patterns across computers, iPhones and mobile cellphones in a later study ( Kamvar et al., 2009 ), and in- form that search behavior on high end smart-phones has become quite similar to the desktop, while conventional mobile cellphones demonstrate a different behavior as in Kamvar and Baluja (2006) . A recent Google report ( Google, 2016b ) states that more than half of the web traffic comes from smart phones & tablets, and number of mobile search queries surpasses desktop search.
Mobile search differs from general web search, not only be- cause of the differences between devices, but also the differ- ences in the information needs of the people when mobile. Mo- bile users tend to locate different types of content while on the go
∗ Corresponding author.
E-mail addresses: [email protected] , [email protected] (B. Kahveci), [email protected] ( ˙I.S. Altıngövde),
[email protected] (Ö. Ulusoy).
( Google, 2016a ). Local services, points of interest (POIs) and driving directions are some of the most popular mobile information needs of the users ( Church and Smyth, 2009; Sohn et al., 2008; Teevan et al., 2011; Kamvar and Baluja, 2006; Google, 2016a ). Location in- formation on the mobile devices has enabled people to use mobile local search services as 30% of all mobile searches are reported to be related to location ( Google, 2016b ).
Three fourths of people who issue a local search query visit a business within a day ( Google, 2016b ). Actionable nature of local search depends on spatial, temporal and social contexts of mo- bile users. Importance of the mobile user context and local search ranking features have been investigated by many studies ( Sohn et al., 2008; Church and Smyth, 2009; Teevan et al., 2011; Heimo- nen, 2009; Gasparetti, 2016 ). Although spatial and temporal con- text have been studied extensively, social context for mobile lo- cal search have been analyzed in a limited scope. In this study, we used data from a location-related social network, FourSquare, to enrich local search results with novice social features, and in- vestigated their effect on mobile local search in a broader view. To do so, we developed a mobile local search application, Gezinio. Mobile users issue local search queries via Gezinio and find vari- ous types of information about local businesses such as business hours, rating scores, reviews, number of visitors etc. We collected their queries, search results and result clicks anonymously between March 2014 and November 2014. Then, we performed offline anal- ysis to understand user behavior and effect of the social features on mobile local search.
http://dx.doi.org/10.1016/j.jss.2016.09.013 0164-1212/© 2016 Elsevier Inc. All rights reserved.
As first contribution of our study, we present some basic statis- tics of our query logs regarding search behavior, and identify sim- ilarities and differences with the earlier findings in the litera- ture. Secondly, we build machine-learned rankers for local mobile search by taking into account both well-known contextual features and several social (i.e., community generated) features available for the candidate POIs. Although some of the earlier works discussed before have addressed the impact of some of these features in iso- lation or in groups, to the best of our knowledge, none of these works employ such a large number of features of different types in a learning-to-rank setup for building models for mobile local search. As our final contribution, we focus on the social features and incorporate these features into our models.
Our findings reveal that social features can improve the perfor- mance of the machine-learned ranking models with respect to a baseline that solely ranks the results based on their distance from user location. Furthermore, we find out that a feature that is im- portant for ranking results of a certain query category may not be so useful for other categories, i.e., different query categories may assign different weights to a given feature in our models.
The reminder of the paper is organized as follows. In the next section, we present related work. In Section 3 , we introduce our mobile local search application and elaborate our study. We an- alyze our data set in Section 4 and provide some statistics. We explain our experiments in Section 5 and discuss our results in the following section, Section 6 . Finally, we conclude our study in Section 7 .
2. Related work
There exist a considerable number of studies in the literature that are closely related to our work in the sense that they attempt to improve the performance in mobile local search. In one of the relevant past works, Lymberopoulos et al. (2011) investigate how spatial context affects users’ decisions on mobile local search. They conduct a data-driven study by analyzing 2 million mobile local search queries issued across the US. They introduce a few location- aware features into the feature space, and build multiple ranking models for different layers of locational granularity using Multiple Additive Regression Trees (MART) ( Friedman and Meulman, 2003 ). They report that user location and other location-aware features are more important than the other contextual features, such as time of day, day of week, weather conditions etc. Additionally, they claim that importance of location-aware features varies across the ranking models, clearly showing existence of the variance in click behaviors of mobile users across different locations.
In another work, Lane et al. (2010) built a framework, Hapori, that models POI preferences of users by taking the temporal con- text (e.g., weather, time, location) into account, and forms a com- munity model based on behavioral similarity between people. Ha- pori recognizes how people’s POI preferences change from week- day to weekend, sunny days to rainy days, person to person, etc. The authors analyze over 80,0 0 0 local categorical search queries (i.e. food, drink, entertainment etc.). They show that search result click preferences vary across different times of day, days of week and weather conditions. They also state that behavioral commu- nities demonstrate different click behaviors based on their depen- dence to the temporal contextual factors. Lastly, they claim that ranking models built using these insights improve ranking per- formance by various degrees, depending on to what extend the framework utilizes contextual features and behavioral aspects for a query category.
Lv et al. (2012) focus on mobile ranking signals such as busi- ness rating score, review count, distance, and study how these sig- nals affect click decisions of users. They show that rating score of most of the clicked businesses are above their corresponding
mean category rating score. They interpret this finding as follows: although users do not really know the mean score of a category, they may be able to approximately estimate a mean value by look- ing over the retrieved businesses list, and tend to click businesses with higher than the mean value. Additionally, they report that this particular behavior is not clear for distance feature. One reasonable explanation of this observation is that users may understand the distance better than the business ratings since it is a physical and concrete concept.
Location-based social networks are the main platforms that ag- gregate information about user activities on local businesses and points of interest. Researchers collect data from these social net- works to improve local search rankings. Deveaud et al. (2014) ex- tract information about venues from FourSquare to define venue- related features (e.g., number of check-ins, number of likes, num- ber of tips (reviews), number of photos, rating, etc). They make use of learning to rank methods to provide venue suggestions to users based on their geographical context and preferences. They conclude that the models built with learning to rank methods outperform a language-modeling baseline. Additionally, they re- port that venue-dependent features are surprisingly more impor- tant than the user-dependent features for making relevant sug- gestions. Lastly, they conclude that likes and reviews become the most prominent indicator of relevance for a given venue. In an- other study, Yang et al. (2013) consider users’ check-ins, tags and tips as different types of feedback to the venues in FourSquare, and collect them to build fine-grained user preferences. Then, they use these user preference models to personalize relevant venues for lo- cal search queries.
Researchers also attempt to solve data sparseness and noise problems in mobile local search. Berberich et al. (2011) leverage external data sources, such as web pages of local businesses and driving-direction requests, to quantify business popularity and dis- tance features. They build ranking models and report that the fea- tures derived from external sources improve search result rankings significantly. In another study, Lv et al. (2013) cluster local busi- nesses based on either business categories or business chains, and build aggregate values to smooth customer ratings, number of re- views and click-through rates. Using these aggregated values, they build ranking models and report that cluster-based smoothing pro- vides improvements up to 5% on result rankings.
In this section, we reviewed many studies about mobile local search. The researchers in these studies investigate mobile local search ranking features and effect of context on users’ click de- cisions. Although they study spatial and temporal contexts exten- sively, they fall short to investigate the social context. We aim to study the impact of the social context on mobile local search with a broader view.
3. Gezinio, a mobile local search application
With the aim of studying impact of the social context on mo- bile local search, we developed a mobile local search application, ‘Gezinio’ ( Gezinio, 2016 ) for the Android platform. Users issue lo- cal search queries with our application. Gezinio backend system uses FourSquare Developer API (2016) to find relevant POIs around users. Our application displays extensive information about POIs with respect to their social aspects. We sort these POIs solely based on their distance to the user.
We collected the queries, search results and result clicks anony- mously. Then, we re-ranked our search results using learning-to- rank methods. We analyzed contribution of social features to the rankings provided by our models. We elaborate our study in the following sections.
We promoted our application in our university’s mail groups and a few number of mobile-related Turkish social platforms. To
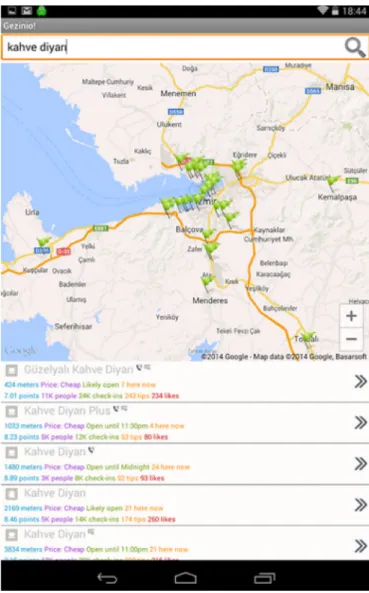
Fig. 1. Search results on the search screen.
make more users contribute to the study, we didn’t ask any per- sonal information from the users who installed the application. Nevertheless, we believe that our user base consists of users who are college students or have college degrees with familiarity to modern technologies.
3.1. Userinterface
Location-related mobile applications are usually organized by using a combination of a map component that focuses on the user position and a textual list component that ranks relevant infor- mative objects ( Meier et al., 2014 ). Maps are very useful for dis- playing information with spatial knowledge such as places, local businesses, points of interest and navigating between these kind of objects. On the other hand, lists are very useful to display or- dered informative objects. It is very sensible to combine these two types of components to display spatial information in a more use- ful manner. Meier et al. (2014) report that most popular mobile location-related information accessing applications follow this ap- proach. Accordingly, we followed a similar approach and developed a user interface that utilizes both map and list components.
Our application starts with a search screen. It consists of a search bar at the top, and a map view below. The location of the user is indicated by a blue flag on the map. Fig. 1 shows the POIs relevant to a user query. They are also displayed line by line in
the search result list below the map. For each POI, a map pin that indicates its location is placed on the map, along with summary information displayed in a result list entry.
3.2.Multiplelevelsofrelevance
Lane et al. (2010) ; Lv et al. (2012) ; Berberich et al. (2011) and Lymberopoulos et al. (2011) analyze mobile local search logs col- lected by a commercial mobile local search engine. All of these studies construct a binary relevance model by assessing the rele- vance of a POI by checking if the business is clicked or not. Al- though we can follow the same approach, users provide us multi- ple levels of relevance by performing different actions on the POIs that are shown in the search results. The following actions can be performed on the search results in Gezinio:
1. Tapping-to-map-pin: The user can tap to a pin on the map to see summary information about a POI in a small pop-up win- dow. Same information is displayed in the pop-up window and the result list line of the corresponding POI. We think this ac- tion may indicate that the user finds location of a POI relevant initially.
2. Tapping-to-result-list-entry: The user can tap to a POI in the re- sults list to see its position on the map. This action may indi- cate that the user initially finds the information displayed for a POI more relevant and wants to see where the POI is.
3. Tapping-to-right-arrow-icon: The user can tap to the right arrow icon placed on the right corner of a result list entry to view detailed information in a separate window, as shown in Fig. 2 . Although this action is very similar to the previous actions, we think that it implies a stronger degree of relevance.
3.3.Featureset
FourSquare API ( FourSquare Developer API, 2016 ) provides a very extensive POI feature set such as popularity, contact informa- tion, links to social accounts, check-in statistics, reviews, photos, etc. We categorize and elaborate these features as follows:
1. General features : name and location(latitude andlongitude) of a POI, distance between the querying user and a POI in meters, pricelevel enumerated with 1 to 4 ‘$’ signs, category of the POI displayed with an icon, specials such as campaigns and special events, querytime that divides a day into 6-hour long time in- tervals, weather condition which is also fetched from another third party API ( API, 2016 ).
2. Accessibility features that may help users to visit a POI more easily: openaddress, phone number and URLof theweb-site of a POI, is open to indicate whether a POI is open or not at the time of the query.
3. Popularity and social features reflect social aspects of POIs in the search results: usercount that indicates the number of users who have visited a POI, checkincount that indicates how many times a POI has been visited, a tip written by a FourSquare user about a POI, tipcount,likecount,herenow that shows the num- ber of users present at a POI at the time of the query, rating score as a numeric score between 0 and 10, userloyalty that is calculated by dividing checkincount by usercount to indicate a degree of loyalty users show to a POI and linkstosocialaccounts such as Facebook, Twitter shown as icons.
Social features described above are populated by community. They are derived from user activities on the POIs present in the FourSquare social network. Upon visiting a place, a FourSquare user can perform a few actions such as checking-in there, liking or rating the place, writing a tip, taking a photo, etc. Although some
Fig. 2. Point of interest details screen.
of these features, such as rating score, tip count, etc., have been studied in the previous works discussed in Section 2 , we introduce a few other social features (e.g., user count, check-in count, user loyalty, here now, like count, etc.) to provide more social informa- tion in the search results.
4. Search log analysis
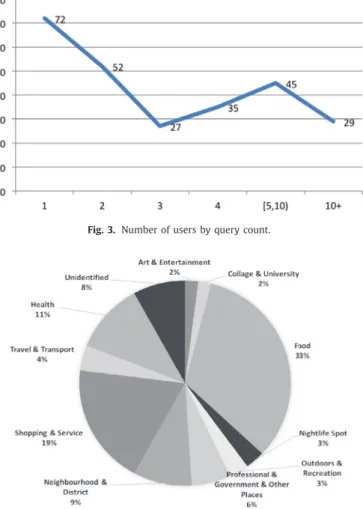
260 users installed the application and issued 1275 queries be- tween March 2014 and November 2014. Fig. 3 shows the number of users by query count. Some statistics about users and queries are given as following:
• The average number of queries per user is 4.9 with min = 1, max = 98, median = 3, standard deviation = 8.625.
• 72 users (27%) issued only 1 query.
• 73% of the users issued at least 2 queries.
• 52% of the users issued at least 3 queries.
• 28% of the users issued at least 5 queries.
• 231 users (88%) issued queries with at least 1 result click.
• 53% of the users issued at least 2 queries with at least 1 result click.
• 35% of the users used the application for at least two days for issuing a local search query.
• 64% of the queries contain at least 1 search result click.
Fig. 3. Number of users by query count.
Fig. 4. Percentage of queries per category.
Fig. 4 shows the query-category distribution of our data set. The most popular 3 categories are food (queries: cafe, pizza, burger king, etc.), shopping & services (queries: market, barber, etc.), and health. Gan et al. (2008) report a query-category dis- tribution that is similar to ours. Nightlife (restaurants, entertain- ment, etc.), medical (hospitals, pharmacies, etc.) and local busi- nesses (shops, etc.) are among the top categories in their distri- bution. Teevan et al. (2011) also report that restaurants and shop-ping are the top 2 categories of mobile information needs. Lastly, Montanez et al. (2014) claim in a recent study that food is a popular category among the queries issued via smart phones and tablets.
4.1. Toplevelstatistics 4.1.1. Queryandsessionlength
In our data set, 70% of the queries contain single query term and 58% of the queries contain 4–9 letters. Average number of terms per query and average number of letters per query is 1.37 and 8.52, respectively. Table 1 shows the top 10 queries issued to our application. Our queries tend to be shorter than general search queries ( Kamvar et al., 2009; Song et al., 2013 ). This difference might be attributed to the fact that our queries are domain-specific and mostly categorical. Moreover, our top 10 queries imply that users generally do not have a specific place in mind while issuing a local search query. Relatedly, geographical search query statistics reported by Gan et al. (2008) are higher than ours. Their queries contain terms related to user location such as street name, neigh- borhood, address, etc. On the other hand, our queries do not con-
Table 1 Top 10 queries. Query Occurrences Eczane 87 Kafe 69 Etliekmek 28 Restoran 27 Cami 23 Cafe 19 Berber 19 Pizza 17 Market 14 Bar 12
Fig. 5. Cumulative query frequencies.
tain locational terms since we use smart phones’ GPS sensors to detect the user location.
We specify session length by the number of queries within a 15-min duration. Average number of queries per session was ob- served to be 2.04. Our session length is slightly higher than 1.6 of ( Kamvar and Baluja, 2006; Kamvar et al., 2009 ) and 1.8 of ( Church et al., 2008 ). We speculate that local search results are not as satisfying as general search, and users tend to issue more queries per session. Ravari et al. (2015) report that the average number of queries per session is 1.74 for tablets and 1.49 for smart phones. Since they analyze queries issued to a navigation applica- tion, it is very likely that users have a specific destination in mind before issuing the query which results in fewer clicks.
4.1.2. Queryvariation
There are 399 singleton queries that occur only once in the search logs. Additionally, we have 606 unique queries that are ac- counted for 47% of the total query logs. Kamvar et al. (2009) in- form that iPhone queries are close to desktop queries in terms of diversity. Although our queries are also issued from smart phones, query diversity is smaller. There may be a few reasons behind this situation. Firstly, our application only deals with local search queries. Additionally, smart phone users are usually familiar with locational social networks. The most popular categories in loca- tional social networks are usually limited to categories such as food, shopping, etc. Therefore, we believe that similar to the pop- ular categories in locational social networks, diversity of the local search queries is not high.
Fig. 5 shows the cumulative frequency occupied by top 100 queries. It demonstrates that top 10, 25, 50, 100 queries oc- cupy 25%, 35%, 42%, 51% of the total query volume, respectively. Kamvar et al. (2009) report that 2% of the queries occupy less than 10% of the total query volume, which is less than one-third of ours. Referring to the long tail phenomenon, we can see that the “tail” is shorter for local search queries compared to the others.
Table 2
Number of queries by click types.
Click type Queries
Tap to map pin 151
Tap to result list entry 695
Tap to right arrow icon 578
Tap to result list entry or right arrow icon 776 Tap to result list entry and right arrow icon 497
Any type of tapping action 825
4.2.Clickrankstatistics
Here, we use the verbs tap and click interchangeably to indi- cate user interest on a search result. Table 2 shows the number of queries that contain a tapping action on the search results. 825 queries, that is 64% of the total query volume, contain at least 1 tapping on a search result. It is shown that Tapto map pin is the least preferred action with 11% among all the queries. On the contrary, 776 queries, that is 60% of the total query volume, con- tain at least one action that has occurred on the result list. Those actions are the ones that end up with focusing the map on the tapped POI, that is Tap to a result list entry, or opening a new screen that presents detailed information about the POI, that is Tapto right arrowicon. Church et al. (2010) compare map-based and text-based interfaces for mobile local search. They conclude that map-based interfaces are useful when a specific address has a strong impact on the preference while text-based interfaces are useful when many types of information are provided in the results. Since the POIs displayed in our search results contain many fea- tures and various kinds of information, users’ search result prefer- ences in our study support the claims given in Church et al. (2010) . Ravari et al. (2015) report that 70% of sessions result with routing (a user decides to drive to the target location). Similarly, 44% of our queries contain an action that results in displaying details and routing information about a POI. These conclusions correlate with actionable nature of the mobile local search.
We also investigate the distribution of number of clicks per query. We see that 18% of the total query volume contain only 1 result click. The percentage of queries that contain 2 result clicks is 29%, which is higher than the percentage of queries with only 1 result click. Additionally, 16% of the total query volume contain at least 3 result clicks. Given these percentages, average number of clicks per query is 1.56 among all queries. When we ignore the queries with no click, average number of clicks per query goes up to 2.41. Kamvar and Baluja (2006) report that the average number of clicks per query is 1.7 for the queries with at least one result click. Similar to our findings for average session length, we think that local search results are not as satisfying as general search re- sults yet and users perform more clicks to find a relevant search result.
Fig. 6 depicts the distribution of click ranks. We observe that the average position of a result selection is 6, with the ac- tual average click position value as 5.33. It is also shown that 56% of the queries contain a click within the top 3 ranks. The numbers we report are very close to the numbers reported by Church et al. (2008) . We can state that the click rank distribu- tion for mobile local search is similar to that of the general mobile search. Additionally, users have more tendency to click to items other than the first item in the result list, compared to the gen- eral web search. Baeza-Yates et al. (2005) report that more than 50% of result selections occur on the first result for the general web queries. Although users are just inherently more likely to se- lect top-ranked results ( Keane et al., 2008 ), information snippets about the POIs shown in the result lists may attract users to click on result items with lower ranks. Lastly, we see that there are con-
Fig. 6. Number of queries by click rank.
siderable amount of clicks in the lower ranks. We speculate the reason behind this as follows: In our application, users go up and down in the result list by scrolling. Scrolling is the action in which a user puts her finger to the screen and moves it up or down. Since it is a very simple action to perform, we think that users usually view the POIs and perform clicks in the lower ranks very easily. 5. Experiments
We formulate our work as a learning-to-rank problem. We use a learning-to-rank method, LambdaMART ( Wu et al., 2010 ), to build ranking models, and re-rank the search results. We build these ranking models by using different relevance models, learn- ing rates and ranking metrics. Then, we evaluate these models to see whether these re-rankings improve the performance of rank- ings or not. Additionally, we analyze our features to see how they contribute to the rankings. We investigate importance of individual features between ranking models that are trained with different parameters, and between queries of the most popular categories.
Learning-to-rank methods construct ranking models for produc- ing new permutations of the search results to improve the accu- racy of the rankings. LambdaMART ( Wu et al., 2010 ) is one of the well-known learning-to-rank methods. It uses gradient boosting ( Friedman and Meulman, 2003 ) to optimize cost functions which are commonly used by information retrieval systems.
There are various metrics that are commonly used for measur- ing performance of a search result ranking. Discounted Cumulative Gain (DCG) and its normalized variant Normalized Discounted Cu- mulative Gain (NDCG) are usually preferred in academic research when multiple levels of relevance are used ( Discounted Cumula- tive Gain, 2016 ). It uses a graded relevance scale to measure the usefulness of a search result based on its position in the search re- sult list. Gain of each search result is discounted at lower ranks. It accumulates the gain from the top to the bottom of the search result list ( Järvelin and Kekäläinen, 2002 ).
DCG assumes that a document in a given position has always the same gain and discount independent of the documents above it. However, the probability that a user browses to some position in the ranked list depends on usefulness of documents above the browsed rank ( Chapelle et al., 2009 ). Another model type, called cascade model, assumes that the likelihood of observation of a document at a specific rank depends on how much the user was satisfied with the previously observed documents in the search re- sult list. A new metric within this model, Expected Reciprocal Rank (ERR) that implicitly discounts documents which are shown below very relevant documents is proposed by Chapelle et al. (2009) .
We built our ranking models using 2 ranking metrics, 3 learning rates and 2 relevance models. For the ranking metrics, we prefer NDCG and ERR at top-10 and top-30 results. We select 0.1, 0.05 and 0.01 for the learning rates. Lastly, our relevance models are described as follows:
• The first relevance score model, named as MultiRel, assigns multiple relevance scores with a maximum value of 4. It dif- ferentiates different types of actions. Relevance scores are as- signed based on how much information a user can get when she makes a specific action on a search result. We explain the relevance score ordering as follows:
– 0 : No action on a search result.
– 1 : The user performs Tapping-to-map-pin on a search result. This action indicates that the user performs the action solely based on location of the search result.
– 2 : The user performs Tapping-to-result-list-entry on a search result. This action is for seeing location of a search result af- ter skimming various features shown in the result list. We speculate that it is a stronger level of relevance than the Tapping-to-map-pin action.
– 3 : The user performs Tapping-to-right-arrow-icon on a search result. This action opens a new screen in the application to show more information about the clicked POI such as its pictures, driving directions, etc. We speculate that it is a stronger level of relevance than the Tapping-to-result-list-entry action.
– 4 : Assigned when a user performs Tapping-to-right-arrow-icon after a Tapping-to-result-list-entry action. If a user per- forms Tapping-to-result-list-entry first, she initially sees the locations of the POIs on the map. A subsequent Tapping-to-right-arrow-icon action means that more information about the POI is needed besides its location.
• The second relevance score model, named as BinaryRel, assigns 1 to the relevance score if any type of action occurs on a search result, 0 otherwise.
Our data set contains 1275 queries. 260 of them are just ran- dom query strings or queries with no result. We removed these queries and we had 1015 queries left for the analysis. Additionally, we used only top 30 search results for each query since there is no click after top 30 results in the data set.
Since we use decision trees to build ranking models, we do not normalize our numerical features before training. For categorical features, we prefer binary representation.
Lastly, we randomly split the data set into 10 training / test- ing data pairs for 10-fold cross validation. Click distributions of the folds are as close as possible to each other.
6. Results and discussions
In this section, we present our performance results and discuss our findings. We first present the ranking results that are gener- ated by the trained models and compare them to the baseline. Then we extend our results by providing relative importance scores of our features for different ranking metrics and query categories. 6.1. Rankingmodels
Each of Tables 3 –5 through Table 6 presents performance of the ranking models which are trained with NDCG and ERR met- rics for top 10 and top 30 results. Baseline columns of the tables present performance of the relevance models with the search re- sults sorted solely by distance. For the other columns, each cell represents performance of a ranking model trained with a specific relevance model and a learning rate.
Table 3
Performance of the ranking models that optimize NDCG@10. BASELINE LR = 0.1 LR = 0.05 LR = 0.01 MultiRel 0 .4424 0 .4584 0 .4468 0 .4286 BinaryRel 0 .4529 0 .4638 0 .4558 0 .4383
Table 4
Performance of the ranking models that optimize NDCG@30. BASELINE LR = 0.1 LR = 0.05 LR = 0.01 MultiRel 0 .4686 0 .4831 0 .4739 0 .4574 BinaryRel 0 .4814 0 .4913 0 .4 84 8 0 .4 84 8
Table 5
Performance of the ranking models that optimize ERR@10. BASELINE LR = 0.1 LR = 0.05 LR = 0.01 MultiRel 0 .2719 0 .2837 0 .2763 0 .2562 BinaryRel 0 .2350 0 .2435 0 .2356 0 .2249
Table 6
Performance of the ranking models that optimize NDCG@30. BASELINE LR = 0.1 LR = 0.05 LR = 0.01 MultiRel 0 .2748 0 .2866 0 .2794 0 .2594 BinaryRel 0 .2382 0 .2465 0 .2387 0 .2282
We see that trained models manage to outperform the baseline models. Both NDCG and ERR scores are higher than their corre- sponding baseline scores. Ranking models with learningrate=0.1 perform better than the baselines for all of the relevance models. Using a smaller learning rate causes degradation on performance of the ranking models. Furthermore, setting learning rate = 0.01 causes ranking models to perform worse than the baselines. It is possible that decreasing learning rate causes the ranking algorithm to overfit on the training data. We investigate this result in the fol- lowing subsection.
We have a considerable amount of clicks on the search results after the top 10 ranks. Additionally, we have many queries with multiple search result clicks. In this regard, Tables 3 –5 through Table 6 show that the trained models improve the rankings for both top 10 and top 30 results.
LambdaMART models outperform the baseline models for both of the relevance models. We can see that social features contribute to a better search result ordering, compared to the results sorted by distance. Nevertheless, the degree of improvement varies be- tween the ranking models. MultiRel relevance model has the high- est difference between the trained models and the baselines. It provides 3% improvement for NDCG at top 30, and 4% improve- ment for ERR at top 30 with learningrate= 0.1. This is a reason- able outcome since MultiRel captures the rankings better than the simple BinaryRel model as it elaborates different types of actions on the search results.
6.2. Relativeimportancescores
We also investigate contributions of individual features to the ranking models to see to what extend social features can improve rankings. Using the ranking models trained by the LambdaMART algorithm, we calculate relative importance values of the features as described in Friedman and Meulman (2003) . To do so, we use all of the test queries in each 10-fold splits and calculate the aver- age value of importance scores. Then, the most important feature’s score is assigned to 1 and all other features are scored relatively to the most important feature. Figs. 7 and 8 show relative feature im-
Fig. 7. MultiRel-NDCG@30.
Fig. 8. MultiRel-ERR@30.
portance values for the models trained with NDCG and ERR metrics on the top 30 results.
For the models that are trained on NDCG@30 metric, Fig. 7 demonstrates that the most important feature is distance. It is followed by social features such as ratingscore and user loy-alty. We see that these 3 features are relatively more important than the other features. Other social features, such as here now and numberoflikes, follow these features. We can say that a rank- ing model trained with NDCG metric can improve the search re- sult rankings, compared to the rankings sorted by distance. Nev- ertheless, distance feature makes more contribution to the rank- ing model than our social features. We can also say that the rel- ative importance scores of features to the distance feature signifi- cantly decrease with smaller learning rates. Smaller learning rates make the ranking algorithm put more focus on the distance feature and fail to make use of the social features. Therefore, we can say that social features have a considerable contribution on the rank- ing models.
Fig. 8 demonstrates that ratingscore is the most important fea- ture for the models trained with ERR metric. It is closely followed by user loyalty and distance features. We also see that other so- cial features such as herenow,number oflikes, tipcount are rela- tively more important, compared to respective feature importance scores in the NDCG models. We can interpret that ranking models make more use of our social features when they are trained with ERR metric. Furthermore, in opposition to the NDCG models, im- portance scores of the social features increase for smaller learning rates. Although ERR metric captures contribution of the social fea- tures better than the NDCG models, decreasing the learning rate causes learning to rank algorithm to overfit and degrade the per- formance.
Lastly, we see that user loyalty turns out to be a much more useful feature than the features from which it is derived: user count and check-in count. Although their own relative importance scores are quite high, we conclude that the combination of these features is a more useful social feature for our ranking models.
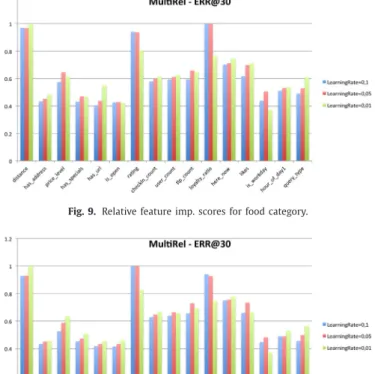
Fig. 9. Relative feature imp. scores for food category.
Fig. 10. Relative feature imp. scores for shopping category.
6.3.Categoricalcomparisonforrelativeimportancescoresofthe features
Lane et al. (2010) report that effect of the contextual factors on local search performance varies between query categories. Sim- ilarly, features can have varying degrees of contributions for the queries of different categories. With this motivation, we further in- vestigate relative feature importance scores for top 2 query cate- gories in our data set: Food and Shopping. We evaluate the MultiRel ranking models with the queries falling into these categories to ex- tract the relative feature importance scores.
Figs. 9 and 10 demonstrate that there are a few notable differ- ences between these two categories. Most important features are distance,ranking score, and user loyalty for food and shopping cat- egories. food category prefers to mainly rely on user loyalty fea- ture while shopping category relies on the ratingscore feature. We can interpret this result as follows: when a user makes a query related to food, she may prefer to click to restaurants that are vis- ited multiple times by the same users. When she issues a query related to shopping, quality of service of a local business may be- come more visible to the user through the rating score feature. Additionally, distance feature is relatively more important for the food category, compared to the shopping category. This implies that shopping is more likely to be a free-time activity. Therefore, users may not be paying much attention to the distance. On the other hand, users may want to eat something when they have a break while performing another activity, such as working, studying, etc. This makes the distance feature more apparent for the food queries since users may not want to spend much time on the road. 7. Conclusions
In this study, we mine mobile local search logs and understand how users take social features into consideration while evaluating
search results. Firstly, we see that our data set contains mostly short and categorical queries. We also observe that users tend to make multiple clicks on search results. We think that users do not have a specific POI in mind while making local search queries. Therefore, they prefer to issue categorical queries and evaluate multiple results.
Secondly, we build machine-learned rankers for local mobile search by taking into account both well-known contextual features and several social (i.e., community generated) features available for the candidate POIs. Our findings reveal that social features can improve the performance of the machine-learned ranking models with respect to a baseline that solely ranks the results based on their distance to the user. Furthermore, we show that a feature that is important for ranking results of a certain query category may not be so useful for other categories, i.e., different query cate- gories may assign different weights to a given feature in our mod- els.
Mobile local search is a still-emerging area and contains a lot room for future research. We can investigate the queries with no- click and compare them to the queries with search result clicks. Additionally, we can study how ranking features diversify search results in mobile local search. These kinds of studies would be very useful for local search systems to provide better search results and improve mobile users’ local search experience.
References
Baeza-Yates, R. , Hurtado, C. , Mendoza, M. , Dupret, G. , 2005. Modeling user search behavior. In: Proceedings of Third Latin America Web Congress, 2005. LA-WEB 2005. IEEE, p. 10 .
Berberich, K. , König, A.C. , Lymberopoulos, D. , Zhao, P. , 2011. Improving local search ranking through external logs. In: Proceedings of the 34th International ACM SIGIR Conference on Research and Development in Information Retrieval. ACM, pp. 785–794 .
Chapelle, O. , Metlzer, D. , Zhang, Y. , Grinspan, P. , 2009. Expected reciprocal rank for graded relevance. In: Proceedings of the 18th ACM Conference on Information and Knowledge Management. ACM, pp. 621–630 .
Church, K. , Neumann, J. , Cherubini, M. , Oliver, N. , 2010. The map trap?: an evalua- tion of map versus text-based interfaces for location-based mobile search ser- vices. In: Proceedings of the 19th International Conference on World Wide Web. ACM, pp. 261–270 .
Church, K. , Smyth, B. , 2009. Understanding the intent behind mobile information needs. In: Proceedings of the 14th International Conference on Intelligent User Interfaces. ACM, pp. 247–256 .
Church, K. , Smyth, B. , Bradley, K. , Cotter, P. , 2008. A large scale study of euro- pean mobile search behaviour. In: Proceedings of the 10th International Confer- ence on Human Computer Interaction With Mobile Devices and Services. ACM, pp. 13–22 .
Creating Moments That Matter Research Studies, 2016a. URL https://ssl.gstatic. com/think/docs/creating- moments- that- matter _ research- studies.pdf (accessed September 2016).
Deveaud, R. , Albakour, M. , Macdonald, C. , Ounis, I. , et al. ,2014. On the importance of venue-dependent features for learning to rank contextual suggestions. In: Pro- ceedings of the 23rd ACM International Conference on Conference on Informa- tion and Knowledge Management. ACM, pp. 1827–1830 .
Discounted Cumulative Gain, 2016. URL https://en.wikipedia.org/wiki/Discounted _ cumulative _ gain (accessed September 2016).
Foursquare Developer API, 2016. http://developer.foursquare.com/ (accessed September 2016).
Friedman, J.H. , Meulman, J.J. ,2003. Multiple additive regression trees with applica- tion in epidemiology. Stat. Med. 22 (9), 1365–1381 .
Gan, Q. , Attenberg, J. , Markowetz, A. , Suel, T. , 2008. Analysis of geographic queries in a search engine log. In: Proceedings of the First International Workshop on Location and The Web. ACM, pp. 49–56 .
Gasparetti, F., 2016. Personalization and context-awareness in social local search: State-of-the-art and future research challenges. Pervasive Mobile Comput doi: 10.1016/j.pmcj.2016.04.004 .
Gezinio Android Application, 2016. http://gezin.io (accessed September 2016). Heimonen, T. , 2009. Information needs and practices of active mobile internet users.
In: Proceedings of the 6th International Conference on Mobile Technology, Ap- plication & Systems. ACM, p. 50 .
How Mobile Search Connects Consumers to Stores, 2016b. URL https://www. thinkwithgoogle.com/infographics/mobile- search- trends- consumers- to- stores. html (accessed September 2016).
Järvelin, K. , Kekäläinen, J. , 2002. Cumulated gain-based evaluation of ir techniques. ACM Trans. Inf. Syst. 20 (4), 422–446 .
Kamvar, M. , Baluja, S. , 2006. A large scale study of wireless search behavior: Google mobile search. In: Proceedings of the SIGCHI Conference on Human Factors in Computing Systems. ACM, pp. 701–709 .
Kamvar, M. , Kellar, M. , Patel, R. , Xu, Y. , 2009. Computers and iphones and mobile phones, oh my!: a logs-based comparison of search users on different devices. In: Proceedings of the 18th International Conference on World Wide Web. ACM, pp. 801–810 .
Keane, M.T. , O’Brien, M. , Smyth, B. , 2008. Are people biased in their use of search engines? Commun. ACM 51 (2), 49–52 .
Lane, N.D. , Lymberopoulos, D. , Zhao, F. , Campbell, A.T. , 2010. Hapori: context-based local search for mobile phones using community behavioral modeling and sim- ilarity. In: Proceedings of the 12th ACM International Conference on Ubiquitous Computing. ACM, pp. 109–118 .
Lv, Y. , Lymberopoulos, D. , Wu, Q. , 2012. An exploration of ranking heuristics in mo- bile local search. In: Proceedings of the 35th International ACM SIGIR Confer- ence on Research and Development in Information Retrieval. ACM, pp. 295–304 . Lv, Y. , Lymberopoulos, D. , Wu, Q. , Liu, J. , 2013. Cluster-based smoothing of sparse
ranking signals in mobile local search. Microsoft Technical Report May 2013 . Lymberopoulos, D. , Zhao, P. , Konig, C. , Berberich, K. , Liu, J. , 2011. Location-aware
click prediction in mobile local search. In: Proceedings of the 20th ACM Interna- tional Conference on Information and Knowledge Management. ACM, pp. 413– 422 .
Meier, S. , Heidmann, F. , Thom, A. , 2014. A comparison of location search UI patterns on mobile devices. In: Proceedings of the 16th International Conference on Hu- man-Computer Interaction With Mobile Devices & Services. ACM, pp. 465–470 .
Montanez, G.D. , White, R.W. , Huang, X. , 2014. Cross-device search. In: Proceedings of the 23rd ACM International Conference on Conference on Information and Knowledge Management. ACM, pp. 1669–1678 .
Open Weather API, 2016. URL http://openweathermap.org/api (accessed September 2016).
Ravari, Y.N. , Markov, I. , Grotov, A. , Clements, M. , de Rijke, M. , 2015. User behav- ior in location search on mobile devices. In: Advances in Information Retrieval. Springer, pp. 728–733 .
Sohn, T. , Li, K.A. , Griswold, W.G. , Hollan, J.D. , 2008. A diary study of mobile infor- mation needs. In: Proceedings of the SIGCHI Conference on Human Factors in Computing Systems. ACM, pp. 433–442 .
Song, Y. , Ma, H. , Wang, H. , Wang, K. , 2013. Exploring and exploiting user search behavior on mobile and tablet devices to improve search relevance. In: Pro- ceedings of the 22nd International Conference on World Wide Web. ACM, pp. 1201–1212 .
Teevan, J. , Karlson, A. , Amini, S. , Brush, A. , Krumm, J. , 2011. Understanding the im- portance of location, time, and people in mobile local search behavior. In: Pro- ceedings of the 13th International Conference on Human Computer Interaction with Mobile Devices and Services. ACM, pp. 77–80 .
Wu, Q. , Burges, C.J. , Svore, K.M. , Gao, J. , 2010. Adapting boosting for information retrieval measures. Inf. Retr. 13 (3), 254–270 .
Yang, D. , Zhang, D. , Yu, Z. , Yu, Z. , 2013. Fine-grained preference-aware location search leveraging crowdsourced digital footprints from lbsns. In: Proceedings of the 2013 ACM International Joint Conference on Pervasive and Ubiquitous Computing. ACM, pp. 479–488 .
Basri Kahveci is a Ph.D. candidate at the Department of Computer Engineering, Bilkent University (Turkey). He has received his MSc degree in the same department in 2015. His research interests include IR and big data.
˙Ismail Sengör Altingövde is an associate professor in the Computer Engineering Department of Middle East Technical University (Turkey). He has received his BSc, MSc and
Ph.D. degrees, all in Computer Science, from Bilkent University (Turkey) in 1999, 2001 and 2009, respectively. Before joining METU, he worked as a postdoctoral researcher at Bilkent and L3S Research Center in Germany. He has worked in several national and international research projects. His research interests include web IR, with a particular focus on search efficiency, social web and web databases. He has published over 40 papers in prestigious journals (including ACM TODS, ACM TOIS, ACM TWEB, JASIST and IP&M) and conferences (including SIGIR, VLDB, and CIKM). He is one of the recipients of Yahoo! Faculty Research and Engagement Program (FREP) award in 2013.
Özgür Ulusoy is a professor at the Department of Computer Engineering, Bilkent University, Ankara, Turkey. He has a Ph.D. in Computer Science from the University of Illinois at Urbana-Champaign, USA. His current research interests include web databases and web information retrieval, multimedia database systems, social networks, and cloud computing. He has published over 130 articles in archived journals and conference proceedings.