i
IDENTIFICATION AND THE CHARACTERIZATION OF
SMALL MOLECULES WITH POTENTIAL ANTICANCER
ACTIVITY AGAINST SOLID TUMORS
A THESIS SUBMITTED TO
THE DEPARTMENT OF MOLECULAR BIOLOGY AND GENETICS AND THE GRADUATE SCHOOL OF ENGINEERING AND SCIENCE OF
BILKENT UNIVERSITY
IN PARTIAL FULFILLMENT OF THE REQUIREMENTS FOR THE DEGREE OF MASTER OF SCIENCE
BY
İREM DURMAZ AUGUST 2011
ii
I certify that I have read this thesis and that in my opinion it is fully adequate, in scope and in quality, as a thesis for the degree of Master of Science.
Assoc. Prof. Dr. Rengül Atalay
I certify that I have read this thesis and that in my opinion it is fully adequate, in scope and in quality, as a thesis for the degree of Master of Science.
Prof. Dr. Mehmet Öztürk
I certify that I have read this thesis and that in my opinion it is fully adequate, in scope and in quality, as a thesis for the degree of Master of Science.
Prof. Dr. Meral Tunçbilek
Approved for the Graduate School of Engineering and Science
Director of Graduate School of Engineering and Science Prof. Dr. Levent Onural
iii
ABSTRACT
IDENTIFICATION AND THE CHARACTERIZATION OF
SMALL MOLECULES WITH POTENTIAL ANTICANCER
ACTIVITY AGAINST SOLID TUMORS
İrem Durmaz
MSc. in Molecular Biology and Genetics Supervisor: Assoc. Prof. Rengül Atalay
August 2011, 77 Pages
The ultimate goal of our project was to investigate candiate small molecules with a potential anticancer activity and characterize their mode of action.
Cardiac glycosides are important group of molecules for both their treating properties in heart failure and their potential effects in cancer therapy. We investigated the cardiac glycosides that are extracted from Digitalis Ferruginea which can be frequently found in Turkey. These glycosides are Lanatoside A, Lanatoside C and Glucogitorosid. Our results showed that they constitute high cytotoxicity effect against liver cancer cell lines. In addition they cause G2/M cell cycle arrest and thereby induce apoptosis.
For the synthetic molecules, we first tested a set of molecules that are synthesized as derivatives of kinase inhibitors. There are some commercial drugs such as imatinib or erlotinib that are used frequently for cancer treatment. Thus we wanted to investigate if these molecules comprise cytotoxic activities. Our data revealed that especially one of the molecules out of 16 display high cytotoxicity and high kinase inhibitory effect in liver cancer cell lines.
The final group of molecules we tested was compoused of thiazolidine ring. In this group of molecules, only one molecule, the one with alkyne terminal precursor, caused cytotoxicity against cancer cell lines. Besides, we have shown that it induces SubG1/G1 cell cycle arrest in cancer cell lines.
iv
ÖZET
POTANSİYEL ANTİKANSER ÖZELLİKLERE SAHİP
OLABİLECEK KÜÇÜK MOLEKÜL İNHİBİTÖRLERİNİN
TEŞHİS EDİLMESİ VE NİTELENDİRİLMESİ
İrem Durmaz
Moleküler Biyoloji ve Genetik Yüksek Lisansı Tez Yöneticisi: Doç. Dr. Rengül Atalay
Ağustos 2011, 77 Sayfa
Bizim bu projedeki amacımız, anti kanser özelliğe sahip olabilecek molekülleri test edip nitelendirmektir.
İncelediğimiz ilk grup, yüksük otundan elde edilen kalp glikosidleriydi. Bu moleküller, gerek kalp hastalığı tedavisinde, gerekse de kanser tedavisindeki potansiyel etkileri sebebiyle oldukça araştırılmakta olan moleküllerdir. Bizim araştırmalarımız sonucunda da bu maddelerin karaciğer kanseri hücrelerine sitotoksik etkileri olduğunu göstermiş bulunmaktayız. Ayrıca bu moleküller, hücre bölünme sürecinde G2/M fazında durmaya sebep vererek apoptos indüklenmesine neden oldukları deney sonuçları da gösterilmiştir.
İkinci grup moleküllerimiz sentetik kinaz inhibitör türevleridir. Günümüzde kinaz inhibitörü olan imatinib, erlotanib gibi birçok madde kanser tedavisinde kullanılmaktadır. Biz de yaptığımız araştırmalar sonucunda gruptaki 16 molekülden özellikle bir molekülün oldukça yüksek citotoksik etki ve kinas inhibisyon gücünün varlığını göstermiş olduk.
Son grup moleküller ise tiyazolidin yapısındaki moleküllerden oluşmaktadır. Bu grupta da özellikle bir molekülün öne çıktığını gösterdik. Alkin içeren bu molekül oldukça yüksek hücre ölümlerine neden oluyor kanser hücre ortamına verildiğinde. Ayrıca bu molekülün de hücre bölünme döngüsünde SubG1/G1 fazında durmaya sebep olduğunu deney sonuçlarımızda gösterdik.
v
TO MY PARENTS TÜRKAN DURMAZ and HÜSEYİN DURMAZ
and TO MY BELOWED KARAMEL
vi
ACKNOWLEDGEMENTS
It is an honor to have many people around me who have made great sacrifices and aids to make his thesis possible.
First of all, I would like to thank my supervisor Assoc. Prof. Dr. Rengül Atalay for all her supports, efforts and enthusiasm all throughout my research. I also want to thank her for believing in me. It is an honor to have a thesis advisor like her who was motivated and patient. In addition, her incredible knowledge and encouraging comments on the subject are some other qualities that make her a great mentor.
I also would like to express my gratitudes to all past and present MBG family members. I am grateful to all my instructors, Assoc. Prof. Kamil Can Akçalı, Assoc. Prof. Uygar Tazebay, Assoc. Prof. Işık Yuluğ, Assoc. Prof. Özlen Konu, Assoc. Prof. Ihsan Gürsel, Assit. Prof. Ali Osman Güre, Prof. Mehmet Öztürk and Prof. Tayfun Özçelik for providing me enormously valuable information on the field of Molecular Biology and Genetics.
I want to send my special thanks to Serif Sentürk and Çiğdem Özen for sharing their immense knowledge on the experimental procedures. I would also thank to Gökhan Yıldız, Eylül Harputlugil, Şükrü Atakan, Ceyhan Ceran, Gurbet Karahan and Nilüfer Sayar for doing at least one thing that made my life easier. Moreover, I would like to express my gratefulness to Merve Aydın, Verda Bitirim, Dilek Çevik, Ayşegül Ors, Pelin Telkoparan and Gizem Ölmezer for their friendship.
Most importantly, I want to emphasize my delightfulness to my group members Ebru Bilget Güven, Tülin Erşahin and Mine Mumcuoğlu for everything that they have done for me. Without them, this thesis would be impossible. They both provided me experimental support and inspiration but also they created a working atmosphere full with friendship, enjoy, helpful and enjoyable. I also want to mention that Ebru and Tülin were great friends outside the lab as well.
I was lucky to have the opportunity to interact with Füsun Elvan, Sevim Baran, Abdullah Ünnü, Turan Daştandır, Bilge Kılıç, and Yavuz Ceylan who had provided the perfect environment for research and provided all the research material.
vii
Without the help and enthusiasm of Prof. Dr. Ihsan Çalış, the research on Digitalis Ferruginea would be impossible. Therefore, I want to thank him for providing us the ingredients of Digitalis Ferruginea and for his inspirations on the subject. On the other hand, I want to thank Prof. Dr. Birsen Tozkoparan for sending us kinase inhibitor derivatives for investigation. Lastly, I want to thank Dr. Esra Önen for her supports and encourage in the research for ALC67 (Thiazolidine).
Finally, I want to express my deepest thanks my family for all their unconditional love and support both during my research and all throughout my life by dedicating this dissertation to them. I want to especially mention the support and inspiration of my son Karamel all throughout my research and also making my life enjoyable.
This work was supported grants from both TUBITAK and State Planning Office (KANILTEK Project).
viii
TABLE OF CONTENTS
SIGNATURE PAGE ... .II ABSTRACT ... III ÖZET... IV ACKNOWLEDGEMENTS ... VI TABLE OF CONTENTS ... VIII LIST OF TABLES ... XI LIST OF FIGURES ... XII ABBREVIATIONS ... ….XIIIIII
CHAPTER 1. INTRODUCTION ... 1
1.1 Small Molecule Inhibitors ... 1
1.2. Cardiac Glycosides... 1
1.2.1 Cardiac glycosides and Cancer ... 3
1.2.2 Apoptosis and Cardiac glycosides ... 4
1.2.3 Angiogenesis and Cardiac Glycosides ... 6
1.2.4 Digitalis Ferruginea ... 7
1.3 Protein Kinases ... 7
1.3.1 Deregulation of kinase family of proteins in cancer ... 8
1.3.2 Kinase Inhibitors ... 15
ix
CHAPTER 2. OBJECTIVES AND RATIONALE ... 18
CHAPTER 3. MATERIALS AND METHODS ... 20
3.1. MATERIALS ... 20
3.1.1 General reagents ... 20
3.1.2 Tissue Culture Reagents and Materials: ... 20
3.1.3 Antibodies: ... 21
3.1.4 Western Blot, Electrophoresis, Kinase assay, Spectrophotometer and Microplate Reader for SRB Assay ... 21
3.2 SOLUTIONS AND MEDIA ... 22
3.2.1 Cell culture solutions ... 22
3.2.2 Western blot and Protein lysis solutions and buffers ... 22
3.2.3 Cell cycle analysis solutions ... 23
3.2.4 Kinase Assay solutions ... 23
3.2.5 Sulphorhodamine B assay solutions ... 24
3.2.6 Immunofluorescence staining: ... 24
3.3 METHODS: ... 25
3.3.1 Cell lines and growth conditions ... 25
3.3.2 Thawing of the cell lines: ... 25
3.3.3 Storage of the cell lines: ... 26
3.3.4 Crude total protein extraction: ... 26
3.3.5 Western Blotting: ... 27
3.3.6 Kinase Assay: ... 28
3.3.7 NCI-60 Sulphorhodamine B (SRB) assay: ... 28
3.3.8 Real time cell growth surveillance by cell electronic sensing (xCelligence): .. 29
3.3.9 Immunofluorescence staining: ... 29
3.3.10 Fluorescence-activated cell sorting (FACS) analysis: ... 30
CHAPTER 4. RESULTS ... 31
x
4.1.1 Cytotoxic activity analysis of all 6 ingredients of Digitalis Ferruginea ... 31
4.1.2 Morphological effect of the compounds ... 35
4.1.3 Cell cycle arrest caused by Lanatoside A, Lanatoside C and Glucogitorosid .. 39
4.1.4 Apoptosis induction by Lanatoside A, Lanatoside C and Glucogitorosid ... 44
4.2 Kinase Inhibitor Derivatives ... 46
4.2.1 Cytotoxic activity analysis ... 46
4.2.2 Kinase Inhibitory Activity ... 49
4.3 Acivity of Thiazolidine ring containing ALC 67 on cancer cell lines ... 52
4.3.1 Cytotoxicity analysis ... 52
4.3.2 Cell cycle arrest induced by ALC67 ... 58
CHAPTER 5. DISCUSSION AND CONCLUSION ... 61
CHAPTER 6. FUTURE PERSPECTIVES ... 67
xi
LIST OF TABLES
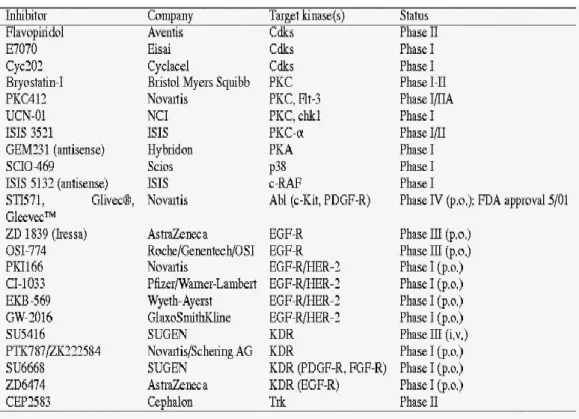
Table 1.1: Kinases and Disease ………...………..10 Table 1.2: Some of the clinically used or candidate protein kinase inhibitors .…….16 Table 3.1: Antibody list ………..…………...21 Table 4.1: Inhibitory concentration 50 (IC50) values of the compounds……….…..46 Table 4.2: Inhibitory concentration 50 (IC50) values of the compounds …………..47 Table 4.3: IC50 values of ALC67 in human cancer cell lines………...….53
xii
LIST OF FIGURES
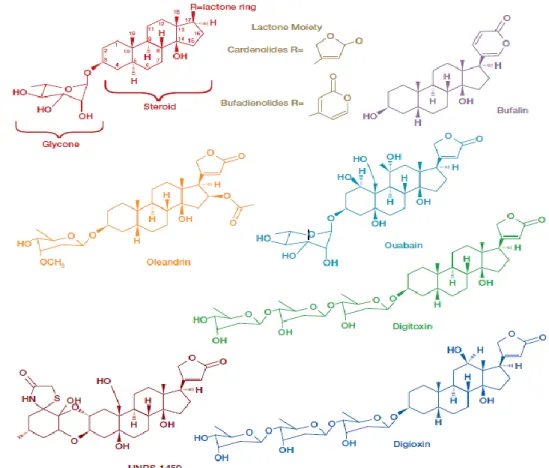
Figure 1.1: Structural representation some cardiac glycosides ………...2
Figure 1.2: Na+,K+-ATPase Signaling cascade………6
Figure 1.3: Circuit of the cell:………..………….9
Figure 4.1: Percent cell death inhibition graphs……….…31
Figure 4.2: Real-time cell growth analysis of the compounds on Mahlavu cell lines……….33
Figure 4.3: Real-time cell growth analysis of the compounds on Huh7 cell lines….34 Figure 4.4: Morphological effect of Cardiac glycosides Lanatoside A, Lanatoside C and Glucogitorosid on Huh7 and Mahlavu human liver cancer cell lines (10x)………..…..36
Figure 4.5: Hoechst staining of Huh7 cell lines……….….38
Figure 4.6: Cell cycle distribution analysis………...…..40
Figure 4.7: Cell cycle distribution analysis…………...………..42
Figure 4.8: PARP cleavage in Huh7 and Mahlavu cells treated with corresponding compounds………..…45
Figure 4.9: Real-time cell growth analysis of IBUTRI compounds on Huh7 cell lines……….47
Figure 4.10: Kinase Inhibitory effect of IBUTRI group molecules……….…..50
Figure 4.11: Percent cell death inhibition graphs………..……….54
Figure 4.12: Real-time cell growth analysis of ALC67:………...………..55
Figure 4.13: Cell cycle distribution analysis………….………..………60
Figure 5.1: Caspase dependent apoptosis signaling cascade……….….63
Figure 5.2: Schematic representation of Imatinib, Erlotinib, IBUTRI, IBUTRI-nTDZ, IBUTRI-FTDZ, IBUTRI-ClTDZ………64
xiii
ABBREVIATIONS
ATP Adenosine Tri-phosphate
AP-1 Activator protein 1
BSA Bovine Serum Albumin
CaCl2 Calcium Chloride
CO2 Carbon dioxide
CPT Camptothecin
DAPK1 death-associated protein kinase-1
DMEM Dulbecco’s Modified Eagle’s Medium
ddH2O Double Distilled Water
DMSO Dimethyl Sulphoxide
DNA Deoxyribonucleic acid
DTT Dithiothreitol
ECL Enhanced Chemiluminescence
EDTA Ethylenediaminetetraacetic Acid
EGFR Epidermal Growth Factor Receptor
EtOH Ethanol
FACS Fluorescence-activated cell sorting
FBS Fetal Bovine Serum
xiv
g Gram
HCC Hepatocellular Carcinoma
HER2 Human Epidermal growth factor Receptor 2
HRP Horse Radish Peroxidase
IC50 Inhibitory Concentration 50
K Potassium
kDa kilo Dalton
MKK Mitogen Activated Protein Kinase Kinase MAPK Mitogen Activated Protein Kinase
mg Milligram
MgCl2 Magnesium Chloride
μg Microgram
μl Microliter
Na Sodium
NaOH Sodium Hydroxide
NaCl Sodium Chloride
NEAA Non-essential Amino Acid
ng Nanogram
nm Nanometer
nM Nanomolar
NRTK non-receptor tyrosine kinase
xv
PI3K Phosphotidylinositol-3-kinase
PBS Phosphate Buffered Saline
PBS-T Phosphate Buffered Saline with Tween-20
PhosStop Phosphotase Inhibitor Cocktail
PIC Protease Inhibitor Cocktail
PMSF Phenylmethylsulphonylfluoride
RNaseA Ribonuclease A
RTK Receptor tyrosine kinase
ROS Reactive Oxygen Species
SRB Sulphorhodamine B
SDS Sodium Dodecyl Sulfate
STS Staurosporine
TBS Tris-buffered Saline
TBS-T Tris-buffered Saline with Tween-20
TCA Trichloroacetic acid
TLC Thin layer chromatography
1
CHAPTER 1. INTRODUCTION
1.1 Small Molecule Inhibitors
In most of the biological processes, protein-protein interactions play a very significant and fundamental role. Therefore, development and characterization of small molecules for therapeutic agents, that have the potential to interfere with enzyme activities or ion channel activities, attracts the attention of most scientists. The ultimate effect of such small molecules is their inhibitory effect on downstream protein-protein interactions in cell signaling cascades (Arkin et al, 2004). The reason that small molecules provide a very big potential for targeted anticancer research is that on the contrary to most of the genetic tools, small molecule inhibitors are reversible most of the time. In addition, they can produce responses inside the cells that are graded and finally they can easily cross the cellular membrane and penetrate inside the cell (Brisson et al, 2004). Novel targets that are aimed to be disrupted by small molecule inhibitors include proteins that are involved in various biological pathways such as regulation of gene expression, signal transduction, DNA repair, cell growth…etc. In most of the cases small molecules compete for ATP-binding with other molecules or directly disrupts protein-protein interaction and thus inhibit their function (London, C. 2007)
1.2. Cardiac Glycosides
Cardiac glycosides are steroid-like compounds and include commonly known therapeutics such as digitoxin, digoxin and ouabain (Figure 1.1). Digitalis is the most widely cardiac glycoside and consists of two components: digitoxin and digoxin (Newman et al, 2008).
Usage of plant extracts containing cardiac glycosides for medical occasions trace back to more than 1500 years ago. In the ancient times, they were used as heart
2
tonics, diuretics or arrow poisons. Latter in time, they were shown to be therapeutic for heart diseases and even now medical doctors use them in treatment of congestive heart failure. In 1975 it was observed that a patient with congestive heart failure recovered after treated with foxglove which is the extract taken from Digitalis purpurea L (Huxtable et al, 2001). This extract produced from foxglove contains cardenolides that was shown to increase contractility of the cardiac muscles and regulate atrial fibrillation by functioning like antiarrythmic compounds (Gheorghiade et al, 2006; Hamad et al, 2007). Mechanism underlying for their function as therapeutic for heart failure is inhibition of Na+,K+-ATPase (energy transducing ion pump) and thus causing an increase in the intracellular concentration of calcium and sodium ions. It also leads to a decrease in the concentration of potassium ions
(Kaplan JH, 2002; Newman et al, 2008).
3
1.2.1 Cardiac glycosides and Cancer
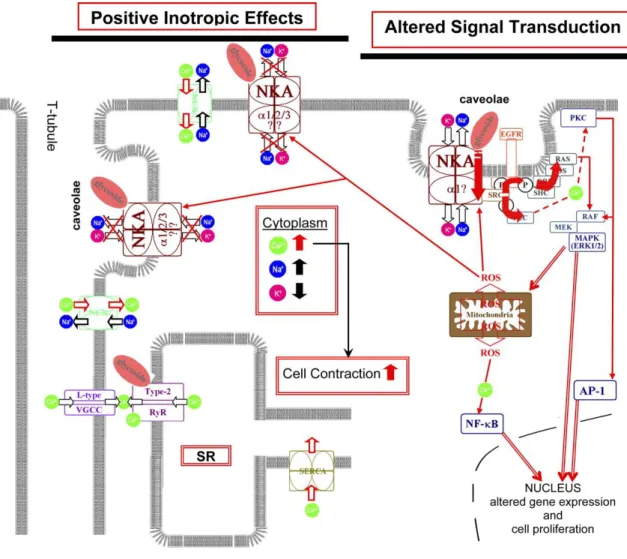
Back in 1960s, it has been reported that in vitro cardiac glycosides can inhibit malignant cell formation thus since then various researches has been establish for possible anticancer activity of cardiac glycosides (Shiratori et al, 1967; Winnicka et al, 2006). In breast cancer it has been shown that, five years after mastectomy, the rate of recurrence was 9.6 times fewer in cardiac glycoside taking patients (Stenkvist et al, 1982). Also in another study it was shown that survival rate was higher in patients taking cardiac glycosides (Stenkvist et al, 1999). Moreover, a more recent study revealed that ouabin can induce activation of Src/EGFR which causes activation of ERK1/2 and thus increase in p21/Cip1 levels and finally cause growth arrest. Digitoxin and digoxin also are shown to have similar properties and consequences (Kometiani et al, 2006). Furthermore, in another study it has been proposed that Na+,K+-ATPase translocation to the nucleus is responsible for the activation/transactivation of Src/EGFR. Then this activation, as previously reported, cause Ras activation and thereby MEK and ERK1/2 activation followed by ROS production that will either be followed by apoptosis or autophagy (Figure 1.2) (Newman et al, 2008; Xie and Cai, 2003; Schoner and Scheiner-Bobis, 2007). There are many other studies suggesting other consequences of cardiac glycoside application such as inhibition of activator protein-1 (AP-1), Akt and phosphoinositide-3 kinase (PI3K) related protein as well as death-receptor regulated apoptotic pathway inhibition (Figure 1.2) (Newman et al, 2008; Schoner and Scheiner-Bobie, 2007; Chen et al, 2006).
Fourty years ago, usage of cardiac glycosides was prohibited due to possibility of high toxicity. Nonetheless, recent studies revealed that cardiac glycosides such as digitoxin and oleandrin are not toxic to tumor cells derived from rodent. On the other hand, they inhibit proliferation of human and monkey derived tumor cells when applied in nanomolar concentrations (Erdmann and Schoner, 1973; Pathak et al, 2000; Gupta et al 1986).
Thus these findings bring in mind the possibility of tissue specificity. Further studies confirmed that cardiac glycosides in fact have tissue specificity such that they
4
are not toxic towards normal cells but malignant cell population (Sreenivasan et al, 2003). Moreover, cardiac glycosides were shown to induce tumor cells become more sensitive towards irradiation (Verheye-Dua and Bohm, 1998).
1.2.2 Apoptosis and Cardiac glycosides
Apoptosis, which is the regulatory factor for cell number determination and damaged cell elimination, is key factor in many biological processes such as embryogenesis, immune system regulation or carcinogenesis. It is also called as “programmed cell death” that occurs in multicellular organisms. Biggest difference between apoptosis and necrosis is that cell debris does not disrupt the surrounding cells. There are some surface proteins that when undergoes apoptotic morphological changes induce the surrounding cells to phagocytosed the apoptotic cell (Wyllie AH).
In some in vitro studies it has been shown that non-toxic concentrations of cardiac glycosides, including digitalis, apoptosis induction is observed. (Haux et al, 1999; Daniel et al, 2003) Morphological changes caused by cytotoxicity of cardiac steroids are very similar to that of apoptosis. For instance phosphatidylserine externalization, DNA fragmentation and disruption of mitochondrial membrane potential are common morphological changes (Daniel et al, 2003). It has been proposed that apoptosis induction property of cardiac glycosides cannot be just through inhibition of Na+,K+-ATPase (Winnicka et al 2006).
Calcium ion chelators, calcium channel blockers and antagonists of calmodulin have the potential to delay or totally inhibit apoptosis. Therefore, it was proposed that deregulation of intracellular calcium ion homeostasis by cardiac glycosides through inhibition of Na+,K+-ATPase may induce apoptosis in healthy cells as well as cancer cell lines. And this might explain the potential anti-cancer activity of cardiac glycosides (McConkey et al, 2000). Moreover, some research groups points out that in prostate cancer cell lines, when given in drugable
5
concentrations, cardiac glycosides causes proliferative arrest and apoptosis induction (Johansson et al, 2001; Haux et al, 2001).
Consequently, the alteration of calcium ion concentration might have the potential consequence of apoptotic induction in human cancer cell lines producing a new area for therapeutic approach (Winnicka et al 2006).
In another study it has been shown that malignant cells show more susceptibility towards cardiac glycosides than of healthy cells. A possible explanation for this might be that activity of Na+,K+-ATPase is altered in tumor cells (Racker et al, 1983; Kasarov et al, 1974). For instance, bufalin, type of a cardiac glycoside was shown to induce apoptosis in HL60 and ML1 leukemia cell lines but no induction was observed in normal cells. The signal transduction for apoptosis induction is suggested to be through Ras-Raf1-MAPK pathway (Kometiani et al, 2006). In another study it has been shown that inhibition of the decrease in potassium levels prevents activation of caspases and therefore apoptosis cannot be induced (Hashimoto et al, 1997). Furthermore, it was also proposed that in androgen-independent prostate cancer, three cardiac glycosides, oleandrin, ouabain and digoxin induces apoptosis through cytochrome c release (McConkey et al, 2000; Ramiez et al, 2007). In some other studies, cardiac glycosides have been proposed to increase Fas and tumor necrosis factor receptor (TNFR1) which thus raises the induction of apoptosis in tumor cells but not in healthy cells (Newman et al, 2008; Sreenivasan et al, 2006). It was reported by another group that in non-small-cell-lung cancer cell lines, cardiac glycosides oleandrin, digoxin and digitoxin induces apoptosis via activating death receptor pathway (death receptors 4&5) and thus via Apo21/TNF-related apoptosis-inducing ligand (TRAIL) pathway (Frese et al, 2006). However, the induction of apoptosis by cardiac glycosides is a controversary issue and suggested to be tissue specific since in another study of vascular smooth muscle cells, apoptosis was shown to be inhibited by cardiac glycosides (Moss, 1998; Winnicka et al 2006).
6
Figure 1.2: Na+,K+-ATPase Signaling cascade (Wasserstromet al, 2005)
1.2.3 Angiogenesis and Cardiac Glycosides
The growth of new capillary blood vessels is called as angiogenesis. It is a vital process for tumor formation and progression and also for metastasis. Cardiac glycosides have been suggested to regulate activation of fibroblast-growth factor-2 (FGF-2) which is an angiogenesis inducing molecule. In addition, in the same study, NF-kB, which prevents apoptosis induction and induce drug resistance, was shown to be inhibited by cardiac glycosides (Cronauer et al, 1997; Oh et al, 1998; Johnson et
7
al, 2002; Wang et al, 1996; Nakshatri et al, 1997). Regulation of FGF-2 was by cardiac glycosides was suggested to be through the inhibition of Na+,K+-ATPase which thus cause the prevention of export of FGF-2 (Smith et al, 2001). On the other hand Na+,K+-ATPase pump was shown to play critical role in membrane transport mechanism of some proteins necessary for the growth of the tumor (Florkiewicz et al, 1998).
1.2.4 Digitalis Ferruginea
Digitalis genus, which is suggested to be the main source of cardiac glycosides, is composed of over 20 species. In the literature, there is not much study done on the cardiac glycosides derived from Digitalis Ferruginea (also known as “rusty foxglove”) but mostly from lanata. Using TLC and PC methodology, the cardenolide ingredients of some of the Digitalis species have been analyzed and Digitalis Ferruginea is one of these species. Previously, Lanatoside A, Lanatoside C, Glucogitorosid, Lugrandoside, Ferruginoside A and Ferruginoside B was isolated from digitalis ferruginea (Çalış et al, 1999; Davie et al, 1978; Çalış et al, 1999
1.3 Protein Kinases
Kinase family of proteins is mostly composed of enzymes with regulatory functions in the activation/inhibition of other proteins inside the cell. They function by adding phosphate groups to amino acid side chains of other proteins. This phosphate addition causes structural change of the protein which will cause the change in the activity of the protein. This is a reversible action and can be removed by protein phosphatases. Kinases are vital component of the cell and have important functions in most intracellular pathways such as growth and cell division, cellular metabolism or DNA damage (Becker et al, 2003; Novak C, 2004).
In structural view, protein kinases have two binding sites. One of them is the catalytic subunit to where ATP binds. The other binding site is for the target protein.
8
Depending on where the phosphate transferred by the kinase, protein kinases are divided into sub groups such as Serine/Threonine kinases, and Tyrosine kinases (Hanks et al, 1988). Even though Tyrosine kinases are less in number when compared to Serine/Threonine kinases, they have more critical roles in key regulatory cascades. Receptor tyrosine kinases (RTKs) and non-receptor Tyrosine kinases (NRTKs) are two subgroups of Tyrosine kinases. RTKs contain extracellular ligand-binding domains and intracellular kinase domains and EGFR is an example for this group. NRTKs involved in intracellular pathways are cytoplasmic protein kinases such as SRC, ABL…etc. Some kinases have dual properties meaning that they can add a phosphate group to both Serine-Threonine and Tyrosine hydroxyl side chains. Mitogen-activated protein kinase kinases (MKKs) are example of dual-functional kinases (Arena S et al, 2005).
1.3.1 Deregulation of kinase family of proteins in cancer
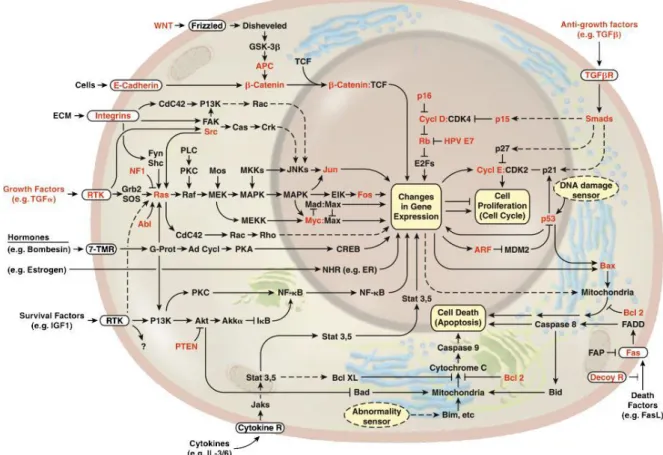
Phosphorylation is the basis of the regulatory circuit of the cell which mediates the proper functioning of the proteins acting in cell proliferation, gene expression, cellular differentiation, cellular metabolism, protein turnover and cell death such as apoptosis (Figure 1.3). In case of abnormalities in phosphorylation of proteins mostly tumorigenesis occurrence is observed (Tsuboi et al, 2004, Venture et al, 2006).
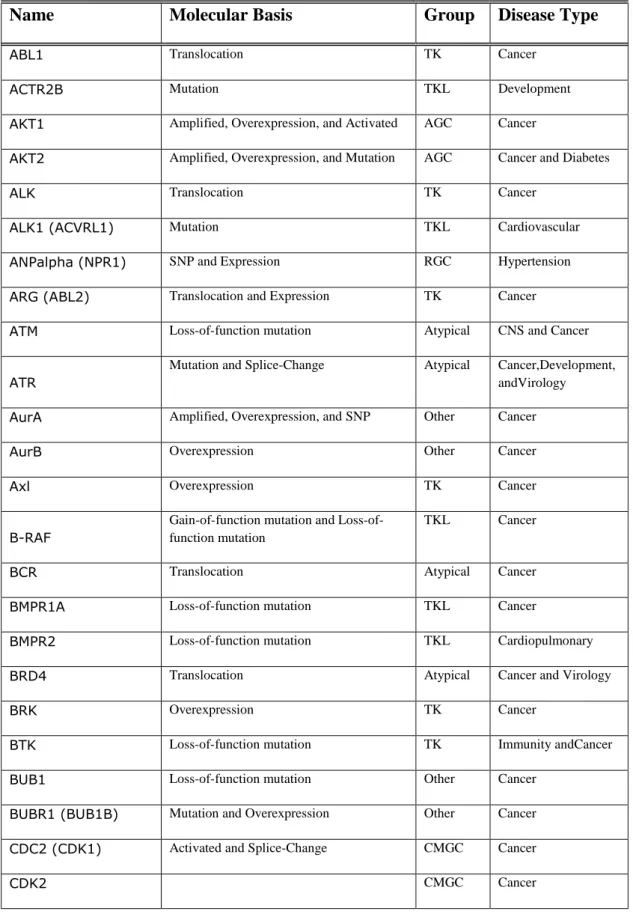
In most of the cancer cells, activation of protein kinases and receptor kinases is found to be altered (Table 1.1). For instance mitogen activated protein kinase (MAPK), phosphotidylinositol-3-kinase (PI3K), AKT, and the epidermal growth factor receptor (EGFR) are found to be hyper-activated in cancer cells. Kinases can have both oncogenic or tumor suppressive effects in cancer. However, most of the time tumor suppressive kinases are found to be serine/threonine or dual-functional kinases whereas most proto-oncogene kinases are found to be tyrosine kinases. For example, SRC and ABL which are NRTKs, function as proto-oncogene.
9
On the other hand, death-associated protein kinase-1 (DAPK1), which is a serine/threonine kinase, is shown to be tumor suppressive which is down regulated in several cancer types including breast and renal carcinoma (Kissil JL et al, 1997, Tend DH et al, 1997). Therefore, in several studies protein kinases are therapeutically targeted with small molecules or antibodies which has potential to inhibit the interaction between the kinase and its substrate or these inhibitors in some cases target and inhibit ATP binding site of kinases (Novak C, 2004).
Figure 1.3: Circuit of the cell: Proteins with abnormal functionalities are highlighted in red (Hanahan D, Weinberg RA, 2000).
10
Table 1.1: Kinases and Disease: Alterations in the activation of some kinases are shown together with diseases that occur. (modified from Fabian et al. 2005 and Cell Signaling http://www.cellsignal.com/reference/kinase_disease.html)
Name Molecular Basis Group Disease Type
ABL1 Translocation TK Cancer
ACTR2B Mutation TKL Development
AKT1 Amplified, Overexpression, and Activated AGC Cancer
AKT2 Amplified, Overexpression, and Mutation AGC Cancer and Diabetes
ALK Translocation TK Cancer
ALK1 (ACVRL1) Mutation TKL Cardiovascular
ANPalpha (NPR1) SNP and Expression RGC Hypertension
ARG (ABL2) Translocation and Expression TK Cancer
ATM Loss-of-function mutation Atypical CNS and Cancer
ATR
Mutation and Splice-Change Atypical Cancer,Development, andVirology AurA Amplified, Overexpression, and SNP Other Cancer
AurB Overexpression Other Cancer
Axl Overexpression TK Cancer
B-RAF
Gain-of-function mutation and Loss-of-function mutation
TKL Cancer
BCR Translocation Atypical Cancer
BMPR1A Loss-of-function mutation TKL Cancer
BMPR2 Loss-of-function mutation TKL Cardiopulmonary
BRD4 Translocation Atypical Cancer and Virology
BRK Overexpression TK Cancer
BTK Loss-of-function mutation TK Immunity andCancer
BUB1 Loss-of-function mutation Other Cancer
BUBR1 (BUB1B) Mutation and Overexpression Other Cancer CDC2 (CDK1) Activated and Splice-Change CMGC Cancer
11
CDK4
Activated, Gain-of-function Mutation, Amplified, and Methylation
CMGC Cancer
CDK6 Over expression and Translocation CMGC Cancer
CDK9
Expression CMGC Viral
infection andCardiova scular
CHK1 Mutation CAMK Cancer
CHK2 Mutation CAMK Cancer
CK1epsilon (CSNK1epsilon)
SNP, Mutation, and Loss-of-heterozygosity CK1 Behavior andCancer
CK2alpha1 and CK2alpha2 (CSNK2alpha1/2)
Over expressionand Activated Other Cancer,Neurodegener ation, and Circadian Rhythm
COT/TPL2
Over expression,Amplified, andMutation STE Cancer andInflammati on
CTK/MATK Overexpression TK Cancer
CYGD (GUCY2D) Mutation RGC Vision
CYGF (GUCY2F) Mutation RGC Cancer
DAPK1 Methylation andExpression CAMK Cancer and Epilepsy
DMPK1 Mutation AGC Neurodegeneration
DNAPK Mutation Atypical Cancer
EGFR
Amplified,Overexpression, and Gain-of-function Mutation
TK Cancer
EphA1 Expression TK Cancer
EphA2 Overexpression TK Cancer
EphA3 (HEK) Mutation TK Cancer
EphB2 Overexpressionand Mutation TK Cancer
EphB4 (HTK) Overexpression TK Cancer
Erk5 (BMK1)
Expression CMGC Cancer andCardiovasc
ular FAK (PTK2) Overexpression,Amplified, andActivated TK Cancer
FER Expression TK Cancer
12
FGFR1
Mutation andTranslocation TK Development andCan cer
FGFR2
Mutation andAmplified TK Development andCan cer FGFR3 Gain-of-function Mutation andTranslocation TK Development andCan cer FGFR4 SNP TK Cancer FGR Amplified TK Cancer
FLT1 (VEGFR1) Methylation andOverexpression TK Cancer
FLT4 (VEGFR3) Activated andLoss-of-function Mutation TK Lymphangiogenesis
FMS (CSF1R) Mutation TK Cancer GSK3alpha and GSK3beta SNP andActivated CMGC Neurodegeneration,Di abetes,Cardiovascular , andCNS
HGK (ZC1) Overexpression STE Cancer
HIPK1 Overexpression CMGC Cancer
HIPK2 Loss-of-heterozygosityand Expression CMGC Cancer Her2 (ErbB2) Amplified andOverexpression TK Cancer
Her3 (ErbB3) Overexpression TK Cancer
Her4 (ErbB4) Expression TK Cancer
IGF1R
Mutation, SNP, andOverexpression TK Cancer, Growth, and Longevity
ILK Overexpression TKL Cancer
IRAK2
Mutation TKL Cancer andInflammati
on
IRAK4 Mutation TKL Infection
JAK1 Mutation andActivated TK Cancer
JAK2 Translocation TK Cancer
JAK3 Loss-of-function Mutation TK Immunity
JNK3 Expression CMGC Cancer and CNS
KDR (FLK1, VEGFR2) Mutation TK Cancer
KIT
Gain-of-function Mutation, Loss-of-function Mutation, andActivated
TK Cancer andDepigment ation
13
LATS1 Methylation,Expression, andMutation AGC Cancer
LATS2 Expression AGC Cancer
LKB1 (STK11) Loss-of-function Mutation CAMK Cancer
LYN Activated TK Cancer
MER Loss-of-function Mutation TK Vision
MET
Gain-of-function Mutation,Overexpression, and Translocation
TK Cancer
MISR2 (AMHR2) Mutation TKL Reproduction
MKK3 (MAP2K3) Mutation andDeleted STE Cancer
MKK4 (MAP2K4) Loss-of-function Mutation andDeleted STE Cancer
MLK4 Mutation TKL Cancer
MST4 Overexpression STE Cancer
MYO3A Mutation STE Sensory
NEK2 Overexpression Other Cancer
NEK8 Overexpression Other Cancer and Renal
PAK3 Loss-of-function Mutation STE Cognition
PAK4 Overexpression STE Cancer
PDGFRalpha
Translocation,Deleted, andMutation TK Cancer andDevelopm ent
PDGFRbeta Translocation andOverexpression TK Cancer PEK (PERK) Loss-of-function Mutation Other Diabetes
PHKgamma2 Loss-of-function Mutation CAMK Metabolism
PIM1
Translocation,Overexpression, and Mutation
CAMK Cancer
PINK1
Mutation andExpression Other Neurodegenerationan d Cancer
PKCalpha
Mutation,Deleted,Overexpression, and Activated
AGC Cardiovascular andCa ncer
PKCbeta SNP AGC Diabetes andCancer
PKCdelta
Expression AGC Cancer,Cardiovascula
r, andCNS
14
r, andCNS
PKCgamma
Mutation AGC Neurodegenerationan
d Pain
PKR (PRKR)
Mutation,Expression, andActivated Other Cancer,Neurodegener ation, and Virology
PLK1 Expression Other Cancer
PRKX Translocation AGC Reproduction
PRKY Translocation AGC Reproduction
RAF1 (c-Raf) Amplified TKL Cancer
RET
Loss-of-function Mutation, Gain-of-function Mutation, andTranslocation
TK Cancer andDevelopm ent
RHOK Loss-of-function Mutation AGC Vision
RNAseL Mutation Other Cancer and Virology
RON Overexpressionand Splice-Change TK Cancer
ROR2 Mutation TK Development
ROS Translocation TK Cancer
RSK2 (RPS6KA3) Loss-of-function Mutation AGC Development andCNS SGK1
Expression AGC Diabetes, Cancer,
and Cognition SRC Mutation,Overexpression, and Activated TK Cancer
SYK Methylation andSplice-Change TK Cancer and Allergy
TGFbetaR1 (ALK5) SNP TKL Cancer
TGFbetaR2
Loss-of-function Mutation TKL Cancer,Development, andFibrosis
TIE2 (TEK)
Mutation andOverexpression TK Angiogenesis andCan cer
TRKA (NTRK1) Mutation andTranslocation TK Cancer and Sensory
TRKB (NTRK2) Mutation TK Cancer
TRKC (NTRK3) Translocation andMutation TK Cancer
TYRO3 (SKY) Overexpression TK Cancer
WNK1 Intronic Mutation Other Hypertension
15
eEF2K (CaMKIII) Overexpressionand Activated Atypical Cancer p38
CMGC Cancer andInflammati
on
p70S6K (RPS6KB1) Overexpressionand Amplified AGC Cancer andDiabetes
1.3.2 Kinase Inhibitors
Therapeutic agents that are molecularly targeted have been used since 1990s in clinical practice. Majority of these therapeutic agents target receptor tyrosine kinases (RTKs) such as but not limited to lapatinib, erlotinib, imatinib that inhibit HER2, EGFR and KIT respectively (Table 1.2) (Slamon et al, 2001; Paez et al, 2004; Lynch et al, 2004; Demetri et al, 2002; Kataoka et al, 2001). Kinase inhibitors have a very important advantage when compared to cytotoxic drugs having DNA synthesis inhibition activity. Kinase inhibitors have low side effects and produce very low levels of toxicity (exception trastuzumab) (Novak C, 2004). Therefore, there are ongoing studies for the characterization and development of new novel kinase inhibitor derivatives against new targets, with higher activity and efficacy.
16
Table 1.2: Some of the clinically used or candidate protein kinase inhibitors (taken from Fabbro et al, 2002)
There is a significant obstacle for the development of effective therapeutic agents for kinase inhibition: selectivity and target site. Producing small-molecule inhibitors that disrupt ligand binding (for RTKs) or protein-substrate interaction was shown to be ineffective (Burke et al, 1997; Sharma et al, 2002; Fabbro et al, 2002). Therefore, best potential strategy for drug discovery is to target the catalytic site by inhibitory molecules that are ATP competitive. Still there are two important problems to solve: membrane penetration and selectivity. In most of the molecules developed, penetration is shown to be prevail however, selectivity still remains to be hard to overcome (Davies et al, 2000; Fabbro et al, 2002).
17
1.4. Thiazolidine Compounds
With the improvements in proteomics in recent years, huge interest has been emerged for the development of anticancer drugs (Li et al, 2011). This huge interest caused the establishment of chemogenomics which is a screening field for libraries of small-molecules in order to investigate functionalities of proteins and find candidates for drugs (Li et al, 2007). In a previous study, a set of anticancer drug candidates was produced. The aim was to create an agent with potential to induce apoptosis in human cancer cell lines.
Some previous studies showed that molecules with thiazolidine have cytotoxic activity in various cancer cells compared to normal cells (Li et al, 2011; Li et al, 2007; Gududuru et al, 2005). Thiazolidines belong to the group of heterocyclic organic compounds. They contain 5-membered ring that is saturated and there is a thioether group inside this ring at position 1 together with an amine group at position 3. There are many commercial drugs that contain thiazolidine being the most famous as penicillin. On the other hand, in another study some thiazolidine-diones were shown to be inhibitors of protein tyrosine kinases such as EGFR or Src (Geissler et al, 1990).
18
CHAPTER 2. OBJECTIVES AND RATIONALE
According to the statistical analysis, in 2007, 13% of the human deaths all around the world was caused by cancer and every day the rate of cancer caused death is rising (Jemal et al, 2011). Therefore, scientists make a lot of effort to the field of cancer research. There are many aspects of cancer research however one of the ultimate goals is the development of anti-cancer therapeutic agents with high efficacy but low side-effects.
Due to the fact that protein-protein interactions are vital members of biological processes, development of molecules that can inhibit abnormal protein interactions is of ultimate importance for anti-cancer studies (Arkin et al, 2004). The main aim of this thesis is to identify anti-cancer small molecules with cytotocxic activities targetting specific cellar pathways.
The first group of molecules which were studied during this thesis was plant-derived small molecules from digitalis ferruginea provided by Prof. Dr. Ihsan Calis. As previously stated cardiac glycosides are steroid-like compounds and include commonly known therapeutics such as digitoxin, digoxin and ouabain (Figure 1.1). In previous experiments, it was shown that digitoxin, digoxin or oubain induce apoptosis in cancer cell lines and they are non-toxic against normal cells (Racker et al, 1983; McConkey et al, 2000; Ramiez et al, 2007). Most of the previous experiments were conducted on fragments derived from Digitalis lanata or davisiana, however there are no studies on molecules derived from digitalis ferruginea. Thus our objective was to examine pure molecules obtained by fractional extraction of of digitalis ferruginea and find the ingredient that has the cytotoxic activity in cancer cell lines and induce apoptosis in these cells.
Most of the therapeutic agents developed and in use right now are targeted against protein tyrosine kinases (Slamon et al, 2001; Paez et al, 2004; Lynch et al, 2004; Demetri et al, 2002; Kataoka et al, 2001). There are two reasons for this, first, protein kinases play inevitably significant role in cancer formation and progression. Second, kinase inhibitors have fairly low toxicity to normal cells and low side effects (exception trastuzumab) (Novak C, 2004). Therefore, one of our aims in this project
19
was to examine the kinase inhibitor derivatives synthesized by Prof. Dr. Birsen Tozkoparan. Our ultimate aim was to find the molecules with highest cytotoxicity with drugable IC50 values and to confirm that they are actiong on protein kinases. Then we showed their mechanism of cell death and the pathway that they interfere with. Finally, we would have small-molecule tyrosine kinase inhibitors with anticancer activity and these molecules would be candidates for anti-cancer therapeutics.
On the other hand, we had small molecules with thiazolidine ring. In previous studies, it was shown that molecules with thiazolidine ring have anti-cancer activities (Li et al, 2011; Li et al, 2007). Thus, in addition to the kinase inhibitor derivatives, we tested the cytotoxic activity of some molecules with thiazolidine ring. Our expectation was to find some molecules with cytotoxic activity in cancer cell lines and that would induce apoptotic cell death.
20
CHAPTER 3. MATERIALS AND METHODS
3.1. MATERIALS
3.1.1 General reagents
Most of the reagents and chemicals used including but not limited to ethanol and methanol, bovine serum albumin (BSA) were purchased from Sigma-Aldrich (St. Louis, USA) and MERC (Darmstadt, Germany). Bradford reagent for protein quantification was obtained from Sigma (St. Louis, MO, USA). Ponceau S and Dimethyl sulfoxide (DMSO) were from AppliChem Biochemica (Darmstadt, Germany). Trichloroacetic acid is purchased from MERC (Schucdarf, Germany). ECL kit, used for western blot chemiluminesence analysis, was obtained from Amersham Pharmacia Biotech Ltd. (Buckinghamshire, UK). Sulforhodamine B (SRB) sodium salt was purchased from Sigma Aldrich. Tris used for the preparation of 10mM TBS was obtained from Amresco (USA). Hoechst stain was purchased from Sigma Aldrich. Phosphatase inhibitor cocktail (PhosStop) and Protease inhibitor cocktail tablet (complete EDTA free) were obtained from Roche Applied Sciences. RNaseA used in FACS was purchased from Fermentas and propidium iodide was from Sigma Aldrich. Software used for FACS analysis, CellQuest was purchased from Becton Dickinson.
3.1.2 Tissue Culture Reagents and Materials:
Dulbecco's Modified Eagle Medium (DMEM), fetal bovine serum (FBS), non-essential amino acid (NEAA), penicillin/streptomycin solution, tyripsin and 1xPBS (CaCl2 , MgCl2 free) were purchased from GIBCO (Invitrogen, Carlsbad, CA,
USA). Flasks, petri-dishes, cell plates, serological pipettes that were used in cell culture were supplied from Corning Life Sciences
21
3.1.3 Antibodies:
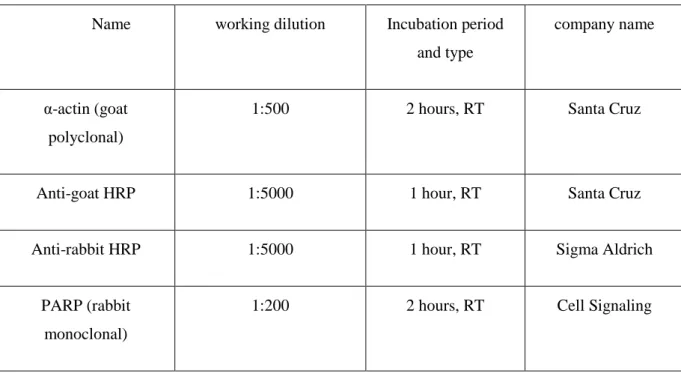
Antibodies were purchased from different companies, which are all listed in Table 3.1. Their working dilutions are also indicated in the Table 3.1.
Table 3.1: Antibody list: All antibodies used are listed together with their working dilutions and incubation periods.
Name working dilution Incubation period
and type
company name
α-actin (goat polyclonal)
1:500 2 hours, RT Santa Cruz
Anti-goat HRP 1:5000 1 hour, RT Santa Cruz
Anti-rabbit HRP 1:5000 1 hour, RT Sigma Aldrich
PARP (rabbit monoclonal)
1:200 2 hours, RT Cell Signaling
3.1.4 Western Blot, Electrophoresis, Kinase assay, Spectrophotometer and Microplate Reader for SRB Assay
Spectrometer used for Bradford Assay was Beckman Du640, purchased from Beckman Instruments Inc. (CA, USA). Kinase Assay reagents (Kinase-Glo Plus Luminescent Kinase Assay) were purchased from Promega (USA). The Reporter Microplate Luminometer Reader used for Kinase Assay was obtained from Turner
22
Bio-Systems (Sunnyvale, USA). Microplate reader used for SRB assay was obtained from Beckman Instruments.
Western Blot reagents such as NuPAGE pre-cast 12% and 10% Bis-Tris mini gels, running buffers (MOPS,MES), transfer buffer, electrophoresis tank, transfer equipment, 4X sample loading buffer, 10X denaturing agent and antioxidant were from Invitrogen. Power supplies Power-PAC200 and Power-PAC300 were from Bio-Rad Laboratories (CA, USA).
3.2 SOLUTIONS AND MEDIA
3.2.1 Cell culture solutions
DMEM growth medium working solution 10% FBS, 1%
penicillin/streptomycin,
1% non-essential amino acid. Stored at 4oC.
3.2.2 Western blot and Protein lysis solutions and buffers
NP-40 lysis buffer 150 mM NaCl, 50 mM
TrisHCl (pH 7.6), 1% NP-40, 0.1% SDS, 1x protease inhibitor cocktail, 1x phosphatase inhibitor cocktail in double-distilled water.
23
10X Tris buffered saline (TBS) 12.2 g Trisma base, 87.8 g NaCl in 1 liter ddH2O, pH 7.4.
TBS-tween (TBS-T) 0.1% Tween-20 was
dissolved in 1x TBS.
Ponceau S 0.1% (w/v) Ponceau, 5 %
(v/v) acetic acid in double-distilled water.
Blocking solution 5% (w/v) non-fat dry
milk/bovine serum albumin in 0.2% TBS-T.
3.2.3 Cell cycle analysis solutions
Propidium Iodide staining solution 50 μg/mL propidium iodide, 0.1 mg/mL RNaseA and 0.05% TritonX-100 in 1X PBS.
3.2.4 Kinase Assay solutions
Kinase-Glo reaction buffer 40mM Tris-HCl pH7.6,
20mM MgCl2, 0.1mg/ml BSA in
24
Kinase-Glo plus reagent buffer Mix 1 vial Kinase-Glo plus Substrate and 10ml Kinase-Glo plus buffer than take 1ml aliquots. For each reaction 50μl of this buffer is mixed with 50 μl sample solution in Kinase-Glo reaction buffer.
3.2.5 Sulphorhodamine B assay solutions
SRB stain solution 0.04gr SRB stain in 10ml 1%
acetic acid solution.
10% TCA solution 100% TCA was diluted into 10% in cold ddH2O.
10mM TBS 0.6gr Tris was dissolved in 1000ml cold ddH2O.
3.2.6 Immunofluorescence staining:
Hoechst stain stock solution 300μg/ml Hoechst dissolved in ddH2O and stored at +4oC.
Hoechst stain working solution 1μg/ml Hoechst diluted from 300μg/ml stock in 1x PBS.
25
3.3 METHODS:
3.3.1 Cell lines and growth conditions
Human liver cancer cell lines (Huh7, Mahlavu, Focus, HepG2, Hep3B), human breast cancer cell line (MCF7) and human colon cancer cell line (HCT116) were cultivated in complete growth medium composed of DMEM, with 10% FBS, 1% NEAA and 1% P/S. All cell lines were incubated in 37 °C, 5% CO2, 95% air
containing incubators. For the sub culturing of the cells, when they reached %75-%80 confluence, they were washed twice with 1xPBS after aspirating the growth medium and then trypsin-EDTA solution was applied. Then the cells were resuspended in fresh growth medium and aliquots of appropriate concentration (sub culturing ratio between 1:6 to 1:10 depending on the cell type) was transferred into new culture dishes with fresh complete growth media.
For the experiments that require a defined number of cells, after trypsinization and resuspension of the cells in fresh growth medium, hemocytometer was used to count the cell number.
Before usage, all solutions and media were warmed to 37oC from 4oC.
3.3.2 Thawing of the cell lines:
All cell lines used are stored in liquid nitrogen. Before usage, one vial of the cell line of interest is taken out of the tank and directly put into 37oC water bath for 1-2 minutes so that the cell solution starts to thaw. When the outer layer of the solution is thawed, the whole cell suspension is resuspended in 5ml warm fresh growth medium, moved into a 15ml falcon tube and centrifugated at 1200rpm, +4oC, for 3 minutes. After the supernatant is aspirated, cell pellet is resuspended in 10ml warmed fresh growth medium and transferred into 100mm culture dish. Then the media of the cells are refreshed after 24hr incubation in 37 °C, 5% CO2, 95% air
26
3.3.3 Storage of the cell lines:
After cells were harvested by trypsinization, trypsin was neutralized with growth medium, which contains FBS. Then the cells were centrifugated at 1500rpm for 5 min, +4°C. The cell pellet was then resuspended in freezing medium of 10%DMSO, 20%FBS and 70% complete DMEM in a concentration of 4x10⁶ cells/ml. Finally, 1 ml of the cell solution was transferred into 1ml screw capped-cryotubes. They are left in -20°C for 1 hr and then transferred into -80°C. 24hr later, they were located into liquid nitrogen tank.
3.3.4 Crude total protein extraction:
Cancer cell lines of defined cell count (from 100.000 to 250.000) were cultured into 100mm culture dishes. After 24hr incubation, growth medium was aspirated and the cells were washed twice with 1xPBS. Then new growth medium containing the corresponding small molecule inhibitor (or DMSO as control) concentration was applied on the cells. Then in a time dependent manner (12hr, 24hr, 36hr, 48hr time periods), the inhibitor containing medium (or DMSO as control) was aspirated and ice-cold PBS was applied. Finally cells were scraped using rubber scrapers. Cell suspensions were transferred into 15ml falcon tubes and centrifuged for 1200rpm 5min +4°C. Then supernatant was aspirated and cells were resuspended in 2ml ice-cold PBS and centrifuged for 1200rpm 5min +4°C once again. Finally, the supernatant was discarded and cell pellets were frozen in liquid nitrogen and stored in -80°C.
For the production of protein lysates, lysis buffer (150mM NaCl, 50mM Tris-HCl pH=7.6, 1% NP-40, 0.1% SDS, 1x Protease inhibitor cocktail and 1x PhosStop) is applied to the cell pellets in twice the amount of the pellet. After mixing the pellets by vortex, they were incubated on ice for 45min (mixing by vortex every 5 min). In case of viscosity, samples are sonicated (if no viscosity, this step is skipped). After centrifugation, the samples at 13,000rpm for 15-20min at +4°C, the supernatant was transferred into new eppendorphs and stored at -20°C.
27
3.3.5 Western Blotting:
The quantification of the protein in lysates, the Bradford protein assay was conducted. BSA in solutions with known concentrations was used as reference for standard curve of OD595. The protein concentrations of cell lysates were calculated
with respect to the standard curve. Then equal amounts of cell lysates (20ng-50ng of protein) were solubilized with 1x loading dye, SRA (or DTT) and then water is used to fill the total solution volume to 15ul or 25ul. Then the lysates were denatured for 10 min in 70°C following the incubation of lysates on ice for 2 min. Then the samples were spinned down and loaded into the gel.
NuPAGE NOVEX pre-cast gel system was used for all western blot analysis procedures according to the manufacturer’s protocol. 12%, 10% Bis-Tris gels were used. Depending on the protein length MOPS or MES running buffer was used. In correspondence with the manufacturer’s protocol, 10%methanol was added to the transfer buffer.
After electrophoresis and the transfer of the proteins from the gel to nitrocellulose membrane (30V, 90min) the membrane was incubated overnight in blocking solution (%5milk powder in 1xTBS-T(0.1%tween)) at +4°C. Then the membrane was treated with primary antibody (1hr-2hr) at room temperature. Washing off the membrane 4 times (for 5min, 10min, 10min,and 5min) with 1xTBS-T(0.1%tween) solution was followed by the treatment of the membrane with secondary antibody (1hr-90min) at room temperature. Finally after washing the membrane once more, chemiluminesence was performed with ECL+ kit according to the manufacturer’s protocol. The emmition of chemiluminesence was captured on X-ray film with different exposure times.
28
3.3.6 Kinase Assay:
Kinase-Glo plus luminescence kinase activity assay (Promega) was performed according to manufacturer’s protocol.
First the Kinase-Glo reaction buffer (40mM Tris-HCl pH7.6, 20mM MgCl2,
0.1mg/ml BSA) was placed into the wells of a 96-well Elisa plate. Then lysates (25μg protein concentration) (protein quantification was done by Bradford assay) were placed into the wells. The total volume of lysate and kinase reaction buffer is 50μl. Then 50μl Kinase-Glo reagent (Kinase-Glo plus substrate+Kinase-Glo plus Buffer) was applied. After 10min dark incubation at room temperature, the luminescence was detected in luminometer. If kinase activity is diminished, ATP concentration increase and so will the luminescence .
3.3.7 NCI-60 Sulphorhodamine B (SRB) assay:
Human cancer cell lines of breast, colon and breast (range of 2000cell/well to 5000cell/well) were plated into 96-well plates in 200μl of media. After 24hr incubation period of cell lines in 37 °C incubators containing 5% CO2, 95% air, one
plate for each cell line was fixed using 50μl 10% ice-cold trichloroacetic acid (TCA) (time-zero plate representing the behavior of the cells at the time of drug treatment) and in the same time compounds of interest (compounds are solubilized in DMSO) were applied to the cells in desired concentrations and diluted by serial dilution. Following drug treatment, the cells were incubated in 37 °C incubators for 24hours, 36hours or 72hours. In order to terminate the incubation period, cells were fixed with 50μl 10% ice-cold TCA and incubated 1hr in dark at +4o
C. After washing TCA with ddH2O repeatedly, the plates were left to dry. Finally, 50μl
0.4%sulphorhodamine B (SRB) solution in 1% acetic acid was used to stain the plates. Following the 10min dark incubation period, 1% acetic acid is used to discard excess dye. For the quantification of the bound stain, SRB is solubilized using 200μl of 10mM Tris-Base. Finally, the OD values were obtained at 515nm wavelength by using Elisa reader.
29
3.3.8 Real time cell growth surveillance by cell electronic sensing (xCelligence):
In order to eliminate background noise, into each well of the 96-well E-plate (Roche Applied Sciences) 50μl growth media was applied and the absorbance was read. Then, human cancer cell lines (range from 1000cell/well to 5000cell/well in 150μl) were plated into E-plate. In real-time cell electronic sensing RT-CES (xCelligence) the proliferation curve of the cells were obtained. In the first 24hour period, in every 30min, the cell index values were detected (9). After 24hr incubation, growth medium is aspirated and 100μl fresh growth medium was applied. Then the cells were treated with the compounds of interest in the indicated concentrations. In the first 24hr of drug treatment, cell index values were detected for every 10 min (fast-drug response) then it changes to every 30 min (long-term drug response). Detected cell index values symbolizes the impedance measurements. By calculating CIdrug/CIdmso, the inhibitory effect of the compounds on the cell lines were
calculated in response to DMSO control (10).
3.3.9 Immunofluorescence staining:
Autoclaved coverslips were placed into 6-well plates and human cancer cell lines were inoculated into these 6-well plates (range 30.000-100.000 cell/well) in 2ml growth medium. 24hr later, growth medium was aspirated and 1.5ml fresh growth medium that contains the compounds of interest at indicated concentrations was applied to cells. After 24hr, 48hr or 72hr incubation period, the cells were washed once with ice-cold 1xPBS and fixed with 100% ice-cold methanol for 10min. Then excess methanol was discarded by washing once with ice-cold 1xPBS. Then 1μg/ml Hoechst stain (dissolved in PBS) was applied to the cells and left for dark incubation 5min. Finally destaining was established in ddH2O for 10 min.
After the staining process, coverslips were mounted onto slides with glycerol and cells were observed under fluorescent microscope and pictures were taken.
30
3.3.10 Fluorescence-activated cell sorting (FACS) analysis:
Human cancer cell lines of interest were inoculated into 100mm culture dish (100.000-200.000 cell/dish) in 6ml growth medium. 24hours later, growth medium was replaced by the starvation medium (1%FBS, 1%P/S, 1%NEAA in DMEM). After cells were incubated in starvation medium for one more day, drug treatment was applied in growth medium. At the same time, time zero plates were fixed.
For fixation of the cells, first of all swimming cells were collected in 15ml falcon tubes. Then remaining cells inside the culture dish were washed once with 1xPBS and trypsinized. These trypsinized cells were then harvested together with previously collected swimming cells. The cell suspension was then centrifuged for 5min, at 1200rpm. Supernatant was discarded and cell pellet was resuspended in 5ml 1xPBS. Once again the cell suspension was centrifuged for 5min, at 1200rpm and supernatant was discarded. Finally pellet was resuspended in 1ml ice-cold 1xPBS and fixed by addition of 2.5ml, 100% EtOH (final concentration was 70%) drop wise while mixing by vortex meanwhile. Then the samples were stored at +4oC.
Before analyzing the samples with FACS machine, cell pellet was resuspended in 500μl Propidium iodide (PI) solution (25μl PI, 5μl RNaseA (10mg/ml stock), 0.25μl Tritron-X-100, 469.75μl ice cold 1xPBS) and incubated at 37o
C (dark) for 40min. Afterwards, 3ml 1xPBS was added onto the samples and centrifuged at 150rpm for 5min, +4oC. Supernatant was discarded and pellet was resuspended in 500μl 1xPBS and loaded to the machine for FACS analysis.
31
CHAPTER 4. RESULTS
4.1 Digitalis Ferruginea
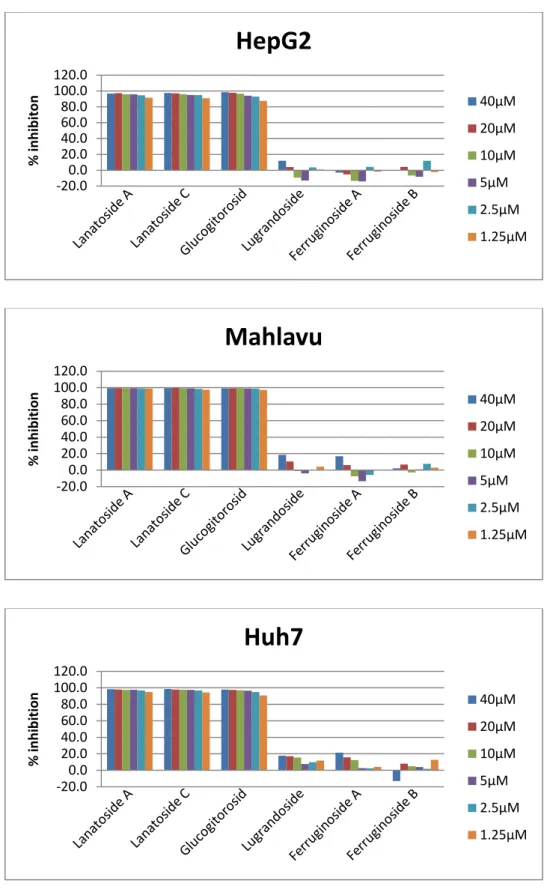
4.1.1 Cytotoxic activity analysis of all 6 ingredients of Digitalis Ferruginea
Initially, the cytotoxic activity of the Digitalis Ferruginea ingredients Lanatoside A, Lanatoside C, Glucogitorosid, Ferruginoside A, Lugrandoside and Ferruginoside B was analyzed using NCI-60 SRB assay as described in the methods part. Molecules were tested on liver (HUH7, MV, HepG2, Focus) cancer cell lines. Lanatoside A, Lanatoside C and Glucogitorosid showed significant cytotoxic effects on liver cancer cell lines whereas the other three agents weren’t effective (Figure 4.1). -20.0 0.0 20.0 40.0 60.0 80.0 100.0 120.0 % in h ib ition
Focus
40μM 20μM 10μM 5μM 2.5μM 1.25μM32
Figure 4.1: Percent cell death inhibition: Liver cancer cell lines Huh7, HepG2, Mahlavu and Focus were treated with Lanatoside A, Lanatoside C, Glucogitorosid, Ferruginoside A, Lugrandoside and Ferruginoside B for 72h. NCI60 SRB analysis was applied as explained in methods.
-20.0 0.0 20.0 40.0 60.0 80.0 100.0 120.0 % in h ib ito n
HepG2
40μM 20μM 10μM 5μM 2.5μM 1.25μM -20.0 0.0 20.0 40.0 60.0 80.0 100.0 120.0 % in h ib itionMahlavu
40μM 20μM 10μM 5μM 2.5μM 1.25μM -20.0 0.0 20.0 40.0 60.0 80.0 100.0 120.0 % in h ib itionHuh7
40μM 20μM 10μM 5μM 2.5μM 1.25μM35
Furthermore, the time-dependent cytotoxic activities of three compounds Lanatoside A, Lanatoside C and Glucogitorosid were investigated using the cell electronic assay xCELLigence in real-time. As seen in Figure 4.2 and 4.3, all three compounds have irreversible growth inhibitory effect on both liver cancer cell lines Huh7 and Mahlavu for 72 hrs. The cytotoxic effects of the compounds are highest in 8hr incubation period and it decreases as the incubation time increases to 72 hours. On the other hand, the inhibitory effect of the compounds in Huh7 is relatively lower than Mahlavu at same concentrations. This also confirms the SRB assay result that IC50 value of Huh7 is higher than mahlavu and percent inhibition of the compounds at constant concentration is higher in mahlavu (Figure 4.1, 4.2 and 4.3).
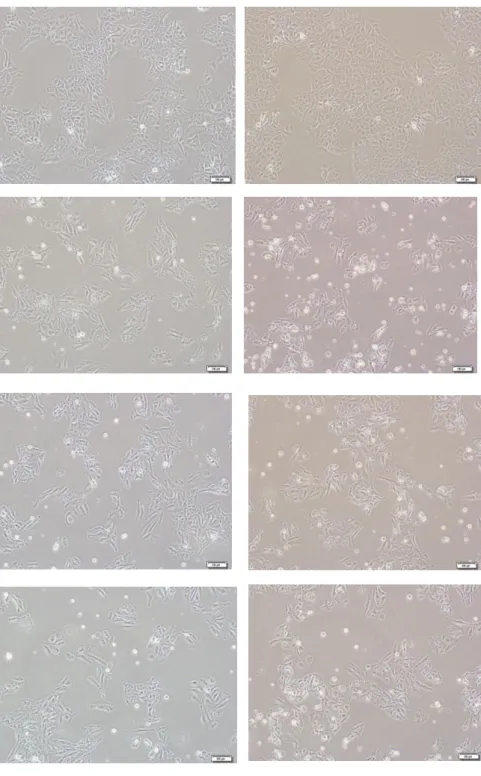
4.1.2 Morphological effect of the compounds
After showing that three compounds of the total 6 have high cytotoxic activity on cancer cell lines, we wanted to investigate the death mechanism that they trigger. Previous data show that cardiac glycosides induce apoptosis in a tissue-specific manner (Moss, 1998; Winnicka et al 2006). On the other hand, in some other study it was mentioned that cardiac glycosides are also activators of autophagy pathway (Hundeshagen et al, 2011). Therefore, in order to investigate the death mechanism the compounds induce, Huh7 and Mahlavu cells were treated with Lanatoside A, Lanatoside C and Glucogitorosid and observed under inverted microscope.
36
24 hours
48 hours
DMSO Lanatoside A Lanatoside C GlucogitorosidMahlavu
37
Huh7
24 hours
48 hours
DMSO Lanatoside A Lanatoside C GlucogitorosidFigure 4.4: Morphological effect of Cardiac glycosides Lanatoside A, Lanatoside C and Glucogitorosid on Huh7 and Mahlavu human liver cancer cell lines (10x). Cancer cell lines were treated with 2µM of the corresponding molecule. Then photographs of the cells were taken with inverted microscope after 24 and 48hours of incubation. DMSO treated cells were used as control.
38
As seen in Figure 4.4, cells treated with all three compounds showed apoptotic morphological changes. Shrinking cells were observed as well as cells in “horse-shoe” structure. Most of the cells observed were in a circulated structure.
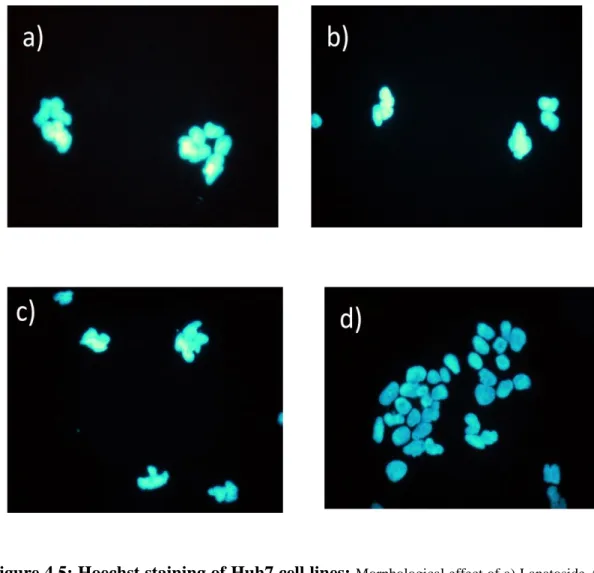
Figure 4.5: Hoechst staining of Huh7 cell lines: Morphological effect of a) Lanatoside A, b) Lanatoside C, c) Glucogitorosid d) DMSO at 2μM concentrations were observed on Huh7 cell lines. Human cancer cell lines were inoculated on coverslips in the confluency of 60-70% and incubated 24hr at 37oC. Then Huh7 cells were treated with corresponding molecules for24hr and Hoechst staining was applied.
39
After observing the cells under inverted microscope, we wanted to confirm the presence of apoptotic induction by Hoechst staining. For this purpose, human liver cancer cell line Huh7 was treated with three compounds and stained with Hoechst. Then cells were observed under fluorescent microscope. As seen in Figure 4.5, Hoechst staining showed condensed nuclei that indicated apoptotic cells in treated samples. Whereas in Huh7 cell group treated with DMSO, no apoptotic cells were present. This also confirmed that Lanatoside A, Lanatoside C and Glucogitorosid induce apoptosis in liver cancer cell lines.
4.1.3 Cell cycle arrest caused by Lanatoside A, Lanatoside C and Glucogitorosid
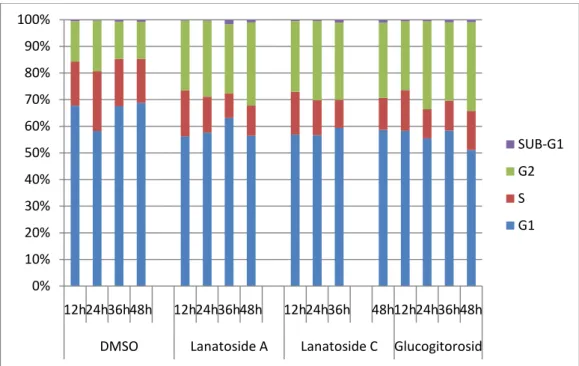
Decrease in the proliferation of the cells and induction of cell death points the presence of cell cycle arrest. Therefore, we used propidium iodide labeling, which is a fluorescence molecule that interacts with DNA (Senturk et al, 2010). The progression of cell cycle was observed in propidium iodide labeled Huh7 and Mahlavu cell lines treated with corresponding compounds using flow cytometry. As seen in Figures 4.6 and 4.7, cells treated with Lanatoside A, Lanatoside C and Glucogitorosid all showed a slight increase in G2/M phase when compared to DMSO control.
Normally, healthy well-differentiated HCC cell lines would be 60-70% in G1 phase, 20% in S phase, and 20% in G2-M phase. However, in treated cells, G2/M phase increased to 30-35% and G1 phase decreased to 40-50% (Figure 4.6). Mahlavu, which is a poorly differentiated HCC cell line, also showed similar results in which G2/M phase cells showed an increase when compared to DMSO control (Figure 4.7).
40
a)
b)
c)
41
e)
0% 10% 20% 30% 40% 50% 60% 70% 80% 90% 100% 12h24h36h48h 12h24h36h48h 12h24h36h 48h12h24h36h48h DMSO Lanatoside A Lanatoside C GlucogitorosidSUB-G1 G2 S G1
Figure 4.6: Cell cycle analysis after treatment with a) DMSO, b) Lanatoside A, c) Lanatoside C, d) Glucogitorosid, in Huh7 cell lines. In part e) the graphical analysis of cell cylce is shown. In parts a,b ,c and d, the peak at 200 FL2-A represents 2N cells (G1) and the peak at 400 represents 4N cells (G2). The peak in between represents S-phase cells. During gating >4N cells were excluded since those didn’t show any variation between control and treated cell groups. FACS analysis was done as explained in the methods part. All drugs are applied at 2µM concentration.
42
a)
c)
b)
43