INVESTIGATING THE INFLUENCE OF SPECTRAL POWER
DISTRIBUTION CHARACTERISTICS ON HUE DIFFERENTIATION
TASK PERFORMANCE
A Master’s Thesis
By
PARDIS TAHERZADEH
Department of
Interior Architecture and Environmental Design İhsan Doğramacı Bilkent Üniversitesi
Ankara
INVESTIGATING THE INFLUENCE OF SPECTRAL POWER
DISTRIBUTION CHARACTERISTICS ON HUE DIFFERENTIATION
TASK PERFORMANCE
The Graduate School of Economics and Social Sciences of
İhsan Doğramacı Bilkent University
by
PARDIS TAHERZADEH
In Partial Fulfillment of the Requirements for the Degree of MASTER OF FINE ARTS
THE DEPARTMENT OF
INTERIOR ARCHITECTURE AND ENVIRONMENTAL DESIGN İHSAN DOĞRAMACI BİLKENT UNIVERSITY
iii
ABSTRACT
INVESTIGATING THE INFLUENCE OF SPECTRAL POWER
DISTRIBUTION CHARACTERISTICS ON HUE DIFFERENTIATION
TASK PERFORMANCE
Taherzadeh, Pardis
MFA, Department of Interior Architecture and Environmental Design Advisor: Assist. Prof. Dr. Semiha Yılmazer
Co-supervisor: Dr. Sibel Ertez Ural May, 2018
This thesis investigates the effects of spectral power distribution (SPD) characteristics of
light sources on hue differentiation performance of observers. Color differentiation
efficiency of light sources was investigated with respect to their SPD characteristics. Hue
attribute of Kürkçü’s (2017) differentiation task was used in this study. Three different groups of students performed the hue differentiation task under 3 different lighting settings;
D65, Light Emitting Diode (LED) and Compact Fluorescent Light (CFL) with 4000K and
6500K Correlated Color Temperatures (CCT). The speed and accuracy of performing the
hue differentiation task were investigated to indicate the task performance. Ninety students
from different departments at Bilkent University and Middle East Technical University
voluntarily participated in this study. The participants performed the hue differentiation
task inside a light booth as a control light condition. Additionally, the alertness level of the
iv
alertness level of participants was assessed using Karolinska Sleepiness Scale (KSS). The
results showed that SPD characteristic of the light sources was effective on hue
differentiation performance of observers. Indeed, the hue differentiation performance was
in proportion to the radiation intensity of the SPDs of light sources. Overall accuracy and
speed of D65 were significantly better in pairwise comparison with LED and CFL due to
wide and continuous band SPD characteristic. Moreover, under LED light source the
accuracy of Green to Blue (G to B) hue differentiation task was lower in comparison to
other hue tasks. However, under CFL the accuracy of Red to Yellow (R to Y) hue
differentiation task was lower in comparison to other hue tasks. It was found that alertness
level and perceived performance of the participants were not significantly different under
different light sources.
Keywords: Spectral Power Distribution (SPD), Hue Differentiation Task, Alertness level,
v
ÖZET
SPEKTRAL GÜÇ DAĞITIMI ÖZELLİKLERİNİN RENK TÜRÜ AYRIMCILIK IŞI UZERINDEKI ETKİNLİKLERİNİN ARAŞTIRILMASI
Taherzadeh, Pardis
MFA, İç Mimarlık ve Çevre Tasarımı Bölümü Tez Danışmanı: Yard. Doç. Dr. Semiha Yılmazer
2. Tez Danışmanı: Dr. Sibel Ertez Ural Mayis, 2018
Bu tezin amacı, ışık kaynaklarının spektral güç dağılımı özelliklerinin gözlemcilerin renk türü ayrımcılık performansı üzerine etkilerini araştırmaktır. Işık kaynaklarının renk
ayrımcılık verimliliği spektral güç dağılımı özelliklerine göre incelenmiştir. Bu çalışmada Kürkçü'nün (2017) renk işi uygulama modelinin, renk türü özniteliği kullanılmıştır. Üç
farklı öğrenci grubu, renk türü ayrımı işini üç farklı aydinlatma ayarı altında gerçekleştirdi; D65, LED ve Kompakt Floresan Işığı ile 4000K ve 6500K Renk Sıcaklığı (CCT). Renk
türü ayırt etme işini gerçekleştirmenin hızı ve doğruluğu, iş performansını belirtmek için
incelenmiştir. Bu çalışmaya, Bilkent Üniversitesi ve Orta Doğu Teknik Üniversitesi farklı bölümlerinden 90 öğrenci gönüllü olarak katıldı. Katılımcılar, bir ışık kabini araciligiyla renk türü ayırt etme işini gerçekleştirdiler. Katılımcıların uyanıklık düzeyi “Karolinska
Sleepiness Scale” kullanılarak değerlendirildi. Sonuçlar, ışık kaynağının spektral güç dağılımı özelliğinin gözlemcilerin renk türü ayırt etme performansı üzerinde etkili olduğunu gosterdi. Renk türü ayrımcılığı performansı, ışık kaynakları spektral güç dağılımlarinin radyasyon yoğunluğuyla orantılıydı. D65 genel doğruluğu ve hızı, geniş ve sürekli spektral güç dağılımi nedeniyle LED ve CFL ile çift karşılaştırmada anlamlı
vi
derecede daha iyi idi. Üstelik, LED ışık kaynağı altında Yeşil-Mavi renk türü görevinin doğruluğu diğer renk türü görevlerine kıyasla daha düşüktü. Bununla birlikte, Kompakt Floresan Işığı altında Kırmızı-Sarı renk türü görevi, diğer renk türü görevlerine kıyasla daha düşüktü. Katılımcıların uyanıklık seviyesi ve algılanan performansının farklı ışık kaynakları altında önemli ölçüde farklı olmadığı bulundu.
Anahtar Kelimeler: Spektral Güç Dağılımı (SPD), Renk türü Ayırt Etme İşi, Uyanıklık düzeyi, İş Performancı
vii
ACKNOWLEDGEMENT
I would first like to thank my thesis advisor Assist. Prof. Dr. Semiha Yılmazer and my Co-supervisor Dr. Sibel Ertez Ural for their invaluable support, advice and patience
throughout the preparation of the thesis. It has been a pleasure to be their student and to
work with them.
I express my gratitude to my jury members, Assist. Prof. Dr. Çağrı İmamoğlu and Prof.
Dr. Banu Manav for their helpful suggestions and valuable comments.
Finally, I express my very profound gratitude to my parents, my husband and my brother
for providing me with unfailing support and continuous encouragement throughout my
years of study and through the process of researching and writing this thesis. This
viii
TABLE OF CONTENT
ABSTRACT ... iii
LIST OF TABLES ... x
LIST OF FIGURES ... xii
CHAPTER I ... 1
INTRODUCTION ... 1
1.1. Aim of the study... 3
1.2. Structure of the thesis... 4
CHAPTER II ... 6
VISUAL SYSTEM, LIGHTING AND COLOR TASK PERFORMANCE ... 6
2.1. Human Visual System... 6
2.2. Light source parameters ... 10
2.2.1. Correlated Color Temperature (CCT) ... 14
2.2.2. Color Rendering Index (CRI) ... 15
2.2.3. Spectral Power Distribution (SPD) ... 18
2.3. Biological effects of light sources ... 26
2.4 .Color as Visual Stimuli ... 27
2.5. Color and Visual task performance ... 31
CHAPTER III ... 38
METHODOLOGY ... 38
3.1.Design of the study ... 38
3.1.1. Research Questions and Hypotheses ... 39
3.2.Method of the study ... 41
3.2.1. Experimental set up... 41
3.2.2. Technical specification of light sources ... 45
3.2.3. Color differentiation model test ... 49
3.2.4. Questionnaire ... 51
3.2.5. Sample group ... 53
ix
3.2.7. Phases of the experiment ... 54
CHAPTER IV... 57
RESULTS AND DISCUSSION ... 57
4.1.Data analyses ... 57
4.2.Results………… ... 59
4.2.1. The effects of SPD characteristics on the hue differentiation performance in terms of accuracy ... 59
4.2.2. The effects of SPD characteristics on the hue differentiation performance in terms of speed ... 66
4.2.3. Hue differentiation sensitivity of each chip ... 71
4.2.4. The effects of SPD characteristics on alertness level ... 75
4.2.5. The effects of SPD characteristics on perceived performance ... 76
4.3.Discussion ………77
4.3.1. The effects of SPD characteristics on accuracy and speed of performing hue differentiation task ... 78
4.3.2. The effects of SPD characteristics on hue differentiation sensitivity of chips………...82
4.3.3. The effects of SPD characteristics on alertness level and perceived performance ... 84
CHAPTER V ... 86
CONCLUSION ... 86
REFERENCES ... 89
APPENDICES ... 94
Appendix A. Questionnaire of the study... 94
Appendix B. Photographs of the Experiment Setup and Color Tasks ... 97
x
LIST OF TABLES
Table 1: Proper CRI values for being used in different spaces ... 17
Table 2: CRI and CCT ranges of different type of light sources ... 17
Table 3: Technical specifications of light sources. ... 46
Table 4: Process table of the experiment ... 54
Table 5: Results of Kruskal-Wallis H rank test for differences in accuracy between light sources... 60
Table 6: Results of Man-Whitney U rank test for differences in accuracy between each two light sources. ... 61
Table 7: Results of Kruskal-Wallis H rank test for differences in accuracy of performing hue differentiation between light sources. ... 62
Table 8 : Pairwise comparison of (R to Y) and (B to G) hue differentiation performance in terms of accuracy ... 63
Table 9 : Results of repeated measures ANOVA for differences in accuracy between hue differentiation tasks. ... 63
Table 10: Pairwise comparison of accuracy between different hue tasks under LED and CFL ... 65
Table 11: Results of Kruskal-Wallis H rank test for differences in speed between light sources... 66
Table 12: Results of Man-Whitney U rank test for differences in speed between each two light sources. ... 67
Table 13: Results of Kruskal-Wallis H rank test for differences in speed of performing hue differentiation between light sources. ... 68
xi
Table 14: Pairwise comparison of (R to Y) and (B to G) hue differentiation performance
in terms of accuracy ... 68
Table 15: Results of repeated measures ANOVA for differences in speed between hue
differentiation tasks. ... 69
Table 16: Pairwise comparison of speed between different hue tasks under CFL ... 70
Table 17: Standard deviation of each hue color chips ... 74
Table 18: Statistical analysis of alertness level after the experiment between light sources
... 75
Table 19: Statistical analysis of alertness level before and after the experiment under each
light source. ... 76
xii
LIST OF FIGURES
Figure 1: Cone photoreceptors: Blue, Short wavelength. Green, Middle wavelength. Red,
Long wavelength ... 7
Figure 2: Photopic and Scotopic curves: Solid line, Cone system and Dashed line, Rods system ... 8
Figure 3: SPD of three different light sources with 2800K, 5000K and 6500K ... 10
Figure 4: The original version of Kruithof curve... 12
Figure 5: The modern version of Kruithof curve. ... 13
Figure 6: Correlated Color Temperature (CCT) values of different light sources ... 14
Figure 7: Spectral Power Distribution of different light sources ... 19
Figure 8: Spectral power distribution of D65 with fluorescent lamp ... 20
Figure 9: Spectral Power Distribution (SPD) of a 13 watt Compact Fluorescent Light (CFL)... 21
Figure 10: SPD graph of neutral and cool white LED ... 22
Figure 11 : SPD of INC, CFL and LED light source used in Bodrogi et al.,’s (2013) study. ... 23
Figure 12: Left top; SPD of HID, Right top; SPD of Fluorescent, Left down; SPD of Halogen, Right down; SPD of RGB LED ... 24
Figure 13: SPD of HPS, RGB LED (LED2) and phosphor converted white LED (LED1) ... 25
Figure 14 : Traditional Color Wheel devised by James Maxwell ... 28
Figure 15: Munsell color wheel with five principle colors and different hues. ... 29
xiii
Figure 17: The luminance difference between an object and its darker surrounding. ... 33
Figure 18: Viewing angle of an observer on flat working surface. ... 33
Figure 19: Farnworth-Munsel 100 hue test ... 35
Figure 20: Color differentiation test designed by Mahler et al., 2009 ... 36
Figure 21: Computer based Freiburg Visual Acuity and Contrast Test: a) four directions of keyboard to be used during task. b) Visual acuity test. c) The contrast test... 37
Figure 22: Paper based Freiburg Visual Acuity and Contrast Test ... 37
Figure 23: Plan of the experimental set up and placement of the light booth (not to scale) ... 42
Figure 24: Placement of the light booth in the experimental room ... 42
Figure 25: Section of the light booth set up (not to scale) ... 44
Figure 26: Hue differentiation task inside the light booth while the general lighting was turned off. ... 44
Figure 27: Measurement with illuminance meter on the working surface. ... 47
Figure 28: Spectrum analyzer Thorlab Compact CCD ... 48
Figure 29: Spectral power distribution graph of the light sources. ... 48
Figure 30: Hue differentiation task ... 50
Figure 31: chips of hue differentiation task ... 50
Figure 32: An example of random arrangement of hue differentiation task inside the light booth (blue to purple hue task) ... 50
Figure 33: An example of accurate arrangement of blue to purple hue differentiation task inside the light booth ... 51
xiv
Figure 34: An example hue differentiation chips performed by a participant (process of
checking the arrangement) ... 51
Figure 35: Karolinska Sleepiness Scale (KSS) ... 52
Figure 36: Perceived performance test ... 53
Figure 37: Phases of the experiment ... 55
1
CHAPTER I
This chapter contains a brief introduction, the aim of the study and the structure of the
thesis. In the introduction part, general information about importance of lighting design
and the Spectral Power Distribution (SPD) characteristics of light sources are covered. In
the second part, the aim of the study is explained. Finally, in the structure of the thesis
part, information about the contents of each chapter is covered.
INTRODUCTION
Nowadays in developed countries, people spend most of their time in workspaces.
Therefore, physical factors and ergonomics of workspaces should be designed properly in
order to enhance work productivity (Boyce, 2014). Artificial lighting and daylight must be
installed with utmost precision to provide proper conditions for seeing and performing the
work-related tasks accurately in workspace environments. Proper lighting not only affects
occupants’ health, general well-being, and mood positively but also leads to better work performance, better safety, fewer errors, and lower absenteeism (Bellia et al., 2011; van
Bommel & van den Beld, 2004). Considering these points, recently lighting design studies
became the center of attention of most researchers and interior architects to enhance work
productivity and visual performances.
There is an important relationship between lighting and work productivity. Lighting affects
2
circadian timing system, and emotion (Boyce, 2014; Rea, 2000). Light source parameters
such as illuminance, Correlated Color Temperature (CCT) and Spectral Power Distribution
(SPD) are the main factors that can affect the visual task performances. Consequently,
quantity and quality of the light source must be considered regarding the particular visual
task to be done in work environment. For instance, color oriented tasks are in the category
of difficult visual tasks and most affected by the quality characteristics of light sources
(Van Bommel & Van den Beld, 2004; Holtzschue, 2012). This is because color quality
characteristics of light sources can alter the way that human visual system observes the
color of the illuminated objects. Besides, there is a need for the observation of small color
differences in some of the color oriented visual tasks which are effective from quality
characteristic of illuminated light source. In these tasks, the color differentiation property
of the light source, surface reflectance of the visual stimuli and the human visual system
play an important role all together (Hashimoto & Nayatani, 1994, Bodrogi et al., 2013).
Moreover, light source characteristics also have non-visual biological effects on human
visual system. Non-visual biological effects of light sources are through circadian timing
system and emotion. According to Campell et al., (1995) light source characteristics affect
the suppression of the hormone melatonin which leads to increase or decrease in alertness
level.
According to US Department of Energy, SPD is the building block of all color
considerations (US Department of Energy, 2016). Considering the trichromatic nature of
the human visual system, one can see all the white lights as the same. Distinctly, white
light of different light sources with the same appearance can consist of different spectral
3
appearance of the colored objects. There are studies that have investigated the effects of
light sources’ SPD characteristics on preference, brightness, fidelity, and visibility of objects. However, there is still a need for understanding the effects of different type of light
sources with different SPD characteristics on hue differentiation performance of the
observers. Additionally precisely investigating the wavelength-band of different type of
light sources and their properties to evaluate hue color differentiation in workspaces and
its effectiveness on alertness level is important. Considering these issues, this study focuses
on investigating the effects SPD characteristics of different type of light sources; Light
Emitting Diode (LED), Compact Fluorescent Light (CFL), and Daylight simulator (D65)
on hue differentiation performance and alertness level of observers.
1.1.
Aim of the study
The main contribution of this study is to investigate the effects of Spectral Power
Distribution (SPD) characteristics of light sources on the observer’s hue differentiation
performance. The sub-aims of this study are identifying the desired bandwidth and feature
of SPD in order to obtain higher hue differentiation performance and alertness levels in
workspaces with more precise analyses. In the literature, there are numerous, experimental
studies on the effects of light source characteristics on different visual performances.
However, the effects of different SPDs on hue differentiation performance and alertness
level of participants in a controlled lighting condition have not been investigated in the
literature. Consequently, this study can be beneficial for filling the gap in the literature.
4
help us to provide proficient working spaces that enhance worker’s well-being,
productivity, and satisfaction both physically and psychologically.
1.2. Structure of the thesis
The structure of the thesis consists of five different chapters. The first chapter consists of
introduction, the aim of the study and the structure of the thesis. The introduction part
consists of information about the importance of lighting design and light source
characteristics for improving performances in workspaces especially in performing
color-oriented tasks. In addition, the importance of SPD characteristic of light sources in visual
performances is explained.
The second chapter explains the triple factors of seeing and discriminating an object’s hue
which are the human visual system, lighting, and color. The first part of this chapter starts
with explanations about the human visual system’s structure and its characteristics. The second part of this chapter consists of information about light parameters and explanations
of previous studies about SPD characteristic of light sources. The third part of this chapter
describes non-visual biological effects of light sources. Finally, fourth and fifth parts of the
chapter two consist of describing color as visual stimuli and color task performances.
The third chapter is on the experimental study of the thesis that is the main part of the study.
The first part of this chapter describes the aim of the study, research questions, and
hypotheses. Then the second part of the chapter contains information of describing the
5
demographic information of the participants. The third part of this chapter clarifies the
results of statistical data analyses of the experimental study that were conducted with IBM
SPSS program. The last part is the discussion part of the thesis that explains the results of
this study in comparison or in association with the information in the literature.
The last chapter of the thesis concludes results of the study. Besides, in this chapter strength
6
CHAPTER II
Chapter II presents the literature review in accordance with the topic of the thesis. The
literature review presents information about the visual system, lighting, color as visual
stimuli, and color task performance. In the visual system part, the structure of the human
visual system and its operation with light are explained. In the lighting part, light
parameters and its effects on the visual performances are clarified. In addition, previous
studies on the effects of Spectral Power Distribution (SPD) characteristics on visual
performances are covered. In the color as visual stimuli and color task performance part,
fundamentals of color and previous studies on color and visual task performances are
presented.
VISUAL SYSTEM, LIGHTING AND COLOR TASK
PERFORMANCE
2.1. Human Visual System
The human visual system operates with light. Light enters the retina through cornea and
lens in the visual system. Retina transmits and converts light into electrical signals. The
retina has a multilayered complex structure. It consists of three layers: layer of collector
cells, layer of ganglion cells and layer of visual photoreceptors. Layer of collector cells
produces the network between photoreceptors while layer of ganglion cells produces
7
visual photoreceptors. Layer of visual photoreceptors consists of four types. The four types
of visual photoreceptors inside the retina are grouped into cones and rods, the sensitivity
of which can change with the wavelength and color of the light (Egan, 1983; Boyce, 2014).
Rods (scotopic spectral) provide night vision and are sensitive in the low-level light
situation. Rod photoreceptors are the same and contain the same photo pigment. Due to
this reason, rods do not support color vision. Cones (photopic spectral) contain three
different photoreceptors and photo pigments. Cone photoreceptors have different but
overlapping spectral sensitivities and support color vision (Fisher, 1976; Egan & Olgyay,
2002; Van Bommel & Van den Beld, 2003; Boyce, 2014). The sensitivity of cones are
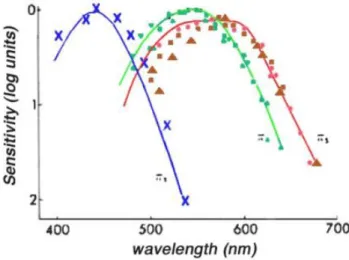
“short wavelength sensitive (S-cones) with the peak at almost 440nm, Middle wavelength sensitive (M-cones) with the peak at 545nm, and Long wavelength sensitive (L-cones) with
the peak at 565nm” (see figure 1) (Boyce, 2014, p.48).
Figure 1: Cone photoreceptors: Blue, Short wavelength. Green, Middle wavelength. Red, Long wavelength
(Source: Fisher, G. H. (1976). The perception of color. Journal of the Neurological Sciences, 27(4), 529–530.)
8
Comparing two curves of photopic and scotopic spectral curves, we can understand that
maximum visual sensitivity of cones in the human visual system lies in the yellow-green
(almost 555nm) and rods in the blue-green wavelengths (almost 507nm). The human visual
system has minimum sensitivity to blue and red wavelengths (see figure 2) (Egan, 1983;
Van Bommel & Van den Beld, 2003; Boyce, 2014).
Figure 2: Photopic and Scotopic curves: Solid line, Cone system and Dashed line, Rods system (Source: van Bommel, W., & van den Beld, G. (2004). Lighting for work: a review of visual and
biological effects. Lighting Research & Technology, 36(4), 255–266)
Consequently, color vision of the human eye is a trichromatic system that is based on three
different cone photoreceptors. The human visual system interprets the light with a single
or limited number of wavelengths as a certain color and interprets white light while the
light consists of all visible wavelengths. The light source with a single wavelength is
specified as monochromatic light (Boyce, 2014). While daylight or any other light source
illuminates an object, certain wavelengths of the light are absorbed while others are
reflected. The reflected wavelengths lead to the appearance of the object. There is a
9
absolute relationship because the human color vision system compares the wavelengths
coming from different surfaces around the colored object not just the object. Special
conditions are required for the color perception of the visual stimuli exactly with the
wavelength of the light source (Fisher, 1976; Boyce, 2014).
There is a process in the human visual system that can decrease or increase the sensitivity
while it is exposed to light sources with different intensity distributions. This is a
wavelength related light adaptation characteristic of the visual system. The sensitivity of
the human visual system decreases more while exposed to red light sources, which have
more emission in long wavelengths than blue light sources, which have more emission in
short wavelengths (Van Bommel & Van den Beld, 2004). The results of a study showed
that intensity distribution of light sources affect the relative level of excitation of each type
of cones. They used light sources with different intensity distributions and CCTs. Color
distinguishing capacity was found better under light source with higher CCT. It was stated
that the light sources with spectral peak in blue zone of the intensity distribution lead to
10
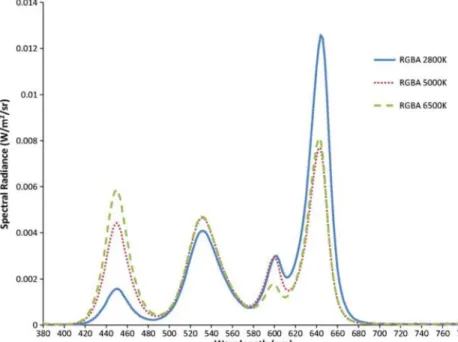
Figure 3: SPD of three different light sources with 2800K, 5000K and 6500K (Source: Pardo, P. J., Cordero, E. M., Suero, M. I., & Pérez, Á. L. (2012). Influence of the correlated color temperature of a light source on the color discrimination capacity of the observer.
Journal of the Optical Society of America A, 29(2), A209)
2.2. Light source parameters
The illumination may be daylight, electric light, or a combination of them in workspaces.
Artificial and electrical lighting in the workspace must be installed with precision decisions
with respect to lighting parameters. Proper electrical lighting must fulfill both the quantity
and quality requirements according to the specific task in workspaces. Sufficient luminous
and the color of the light should be provided according to the visual performance as these
factors affect the appearance of the work instruments (Rea, 2000; Ural & Yilmazer, 2010).
Consequently, consideration of spectral composition, light direction and other parameters
11
ergonomics, and atmosphere, energy and these lead to increase in productivity, health and
well-being of workers (Schupbach et al., 2015).
Illuminance, Correlated Color Temperature (CCT), Color Rendering Index (CRI) and
Spectral Power Distribution (SPD) are vital lighting parameters that most affect the visual
performances. Illuminance of the light source is the quantitative aspect of light source
characteristics. It is the amount of light on a horizontal plane. Good color visibility requires
the proper amount of illuminance in workspaces (Holtzschue, 2012). This is because,
insufficient illuminance would lead improper perceiving the exact color of the illuminated
objects and high amount of it would lead to glare. For instance, eight percent improvement
is observed in work productivity with increasing the illuminance level from 300 to 500 lux
in an industrial environment. Thus, it can be derived that sufficient illuminance level for
industrial work environments is almost 500 lux (Rea, 2000; van Bommel & van den Beld,
2004).
There are many different beliefs about the effects of light and color on preference and
perception (Davis & Ginthner, 1990). It is commonly known that people prefer low color
temperature light sources at low illuminance levels for relaxing atmosphere and high color
temperature light sources at high illuminance levels for working environments (Boer &
Fischer, 1981). In addition to experimental studies for comfortability Kruithof curve is used
as a graph that shows preferred combination of illuminance and correlate color temperature
(CCT) for interior spaces. Kruithof curve shows the preferred illuminance level range for
specific CCTs of light sources. For instance, “warm fluorescent lamps at 3000K would be
12
at 70 lux and above” (see figure 4) (Kruithof, 1941, p.69). Besides, Kruithof explains that
appearance of light sources at range of low illuminance level with high CCT is blue and
called dim or cold while at range of high illuminance level with low CCT is red and called
unnatural or undesirable (see figure 5) (Kruithof, 1941; Fotios, 2017).
Figure 4: The original version of Kruithof curve
(Source: Kruithof A., A. 1941. Tubular luminescence lamps for general illumination. Philips Tech Rev. 6(3):65–73.)
13
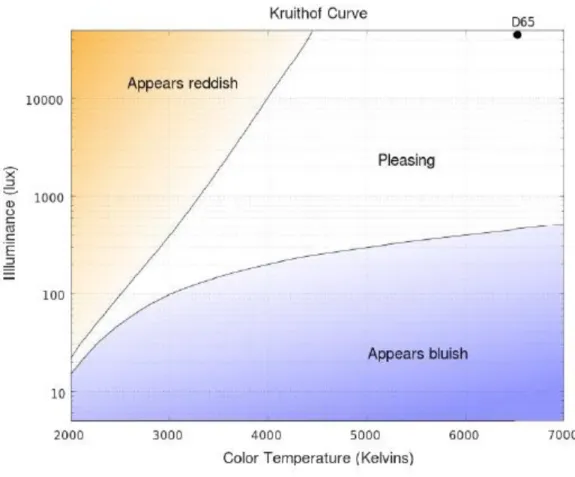
Figure 5: The modern version of Kruithof curve.
(Source: http://en.wikipedia.org/wiki/File:Kruithof_curve_2.svg )
Additionally the energy efficiency factor of the lights sources must consider for
workspaces (Yilmazer et al., 2009). In a study conducted by Manav et al., (2014) stated
that tubular LED lamp gives higher energy performance and higher visual comfort
satisfaction while compared to tubular fluorescent light sources in workspaces. They
investigated the energy efficiency, visual comfort and light quality of tubular fluorescent
14
2.2.1. Correlated Color Temperature (CCT)
Correlated Color Temperature (CCT) is a metric that relates to the color appearance of the
emitted light. It does not demonstrate the color of the illuminated object. CCT is given in
Kelvin (K) and the light source color changes according to the value of kelvin. Lower
Kelvins appear warm and higher values of Kelvins appear cool. Hence, increasing the
temperature leads to change in appearance from red followed by yellow and white
respectively. For instance, a light source with zero on Kelvin scale appears black, between
1000K and 2000K it appears red, around 2500K warm white followed by 4500K and
6500K that appear cool white and bluish white respectively. For instance, appearance of
incandescent light sources is in yellow color the CCT of which is between 2700K and
3300K commonly. CCT of a regular incandescent lamp is 2850K. A cool white fluorescent
lamp has a CCT of 4100K (see figure 6) (Nassau, 1998; Elvidge et al., 2010).
Figure 6: Correlated Color Temperature (CCT) values of different light sources (Source: https://www.elementalled.com/correlated-color-temperature )
It is confirmed that different CCTs affect human beings psychologically and
physiologically with visual and non-visual processes (Sivaji et al., 2013). Numerous
15
performance, preference, and perception (Harrington, 1954; Steffy, 2002; Huang et al.,
2015; Sivaji et al., 2013; Manav, 2007; Kürkçü et al., 2017; Shamsul et al., 2013).
Results of studies conducted by Steffy (2002) and Harrington (1954) showed that higher
CCTs gave higher brightness perception and enhanced work performance while comparing
3000K, 3500K and 4000K CCTs. In another study, focused and sustained attentions were
observed to be significantly better under 4300K than 6500K (Huang et al., 2015).
According to a study, CCT of 4000K (Cool White) was the most comfortable and higher
typing speeds was found under 4000K while 6500K (Daylight) was found to be the most
preferred CCT of light (Sivaji et al., 2013). The results of a study applied by Manav (2007)
showed that 4000K was the preferred CCT by participants regarding impression of
spaciousness and comfort. Manav (2007) used 2700K, 4000K and a combination of 2700K
and 4000K in her study. In another study, it was found that the accuracy of differentiating
the hue and chroma attribute of color in color differentiation tasks was better under 4000K
than 2700K. While, the speed of performing the color differentiation tasks was not different
under 4000K and 2700K (Kürkçü, 2017). Results of the study conducted by Shamsul et al.,
(2013) showed that overall participants preferred 4000K (Cool white) than other CCTs.
Additionally, in that study the accuracy of the computer-based visual task was observed to
be higher under 6500K. Besides, the speed of typing was observed to be better in 4000K
and there was no significant difference between the CCTs for paper-based task
performance.
16
Another measurement criterion of light source color characteristics is color rendering. It
evaluates the appearance of objects under artificial light sources. Light source
characteristics can affect color attributes (Hue, Chroma, and Value) of an object.
Consequently, color-rendering metric is used to determine these complicated changes in a
meaningful way. International commission on illumination (CIE) assessed an
internationally used Color-Rendering Index (CRI) for evaluating the color appearance of
objects under light source illumination (Davis, 2010).
The Color Rendering Index (CRI) values range from zero to 100, while zero stands for low
CRI & 100 indicating the perfect CRI. The CRI of the light sources must be chosen
according to the corresponding visual task that will be done under that light source (IESNA,
1993). There is a demand for high CRI value for observation of paintings in museums so
light sources with high CRI values must be chosen to illuminate paintings in museums and
17
Table 1: Proper CRI values for being used in different spaces
(Source: International Commission on Illumination, CIE (1986). Guide on interior lighting. Paris: The Commission.)
Light sources have different CRI values. For instance, Incandescent lights have high CRI
values, near 100 but low-pressure sodium lamps as monochromatic light sources have very
low values of CRI. Nowadays, LED light source has received much attention considering
their long life cycle, low power consumption etc. However, the CRI of LED light sources
is lower than that of regular incandescent lamps and this may affect human visual
performances regarding visual tasks. Table 2 shows the different lamp types and their
generally used CRI and CCT ranges (see table 2) (Hong et al., 2017; Boyce, 2014).
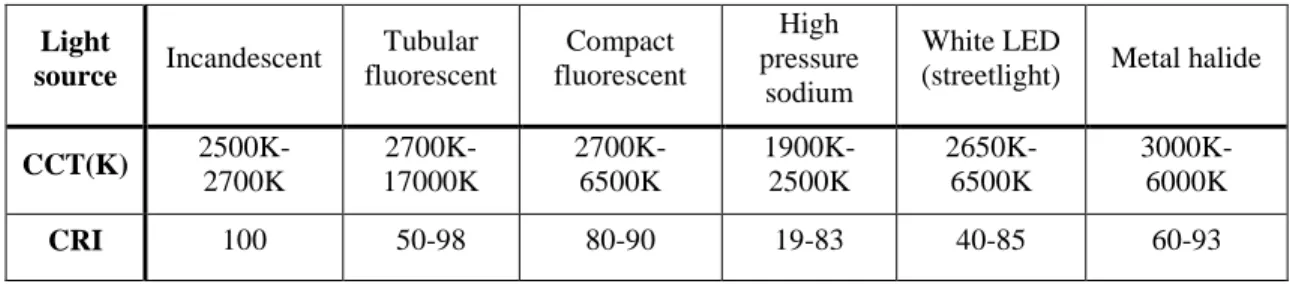
Table 2: CRI and CCT ranges of different type of light sources
(Source: Boyce P. R (2014). Human Factors in Lighting.n. p. Boca Raton: CRC Press, Taylor & Francis Group, 2014. p.37 ) Light source Incandescent Tubular fluorescent Compact fluorescent High pressure sodium White LED
(streetlight) Metal halide
CCT(K) 2500K-2700K 2700K-17000K 2700K-6500K 1900K-2500K 2650K-6500K 3000K-6000K CRI 100 50-98 80-90 19-83 40-85 60-93
18
2.2.3. Spectral Power Distribution (SPD)
Spectral Power Distribution (SPD) is another color characteristic of light sources. It
describes the amount of radiant power emits by light source at each wavelength or band of
wavelengths in the visible region (380 nm to 760 nm) (Rea, 2000). Correlated Color
Temperature (CCT) stands for the SPD that is refined with a simple number. According to
SPD graph, the sources that emit radiation more strongly at the middle or longer (red)
wavelengths appear as warm white and are generally preferred for aesthetic purposes.
However, the light sources with shorter wavelengths that appear cool white give an
impression of sharper and colder light (Elvidge et al., 2010).
Different types of light sources have different spectral intensities. Light sources with single
spectral intensity are monochromatic light sources. Incandescent bulbs and daylight are
continuous spectra light sources that cover a relatively large range of wavelengths in their
SPD. Furthermore, the line spectra light sources are the ones that have dispersion radiation
intensities in their SPD. Gas and electric charge light sources are the examples of line
19
Figure 7: Spectral Power Distribution of different light sources
(Source: Boyce P. R (2014). Human Factors in Lighting.n. p. Boca Raton: CRC Press, Taylor & Francis Group, 2014)
Daylight as an example of the continuous spectra light source varies especially in
ultraviolet spectral region, due to the function of seasons, time of day, and geographic
location (CIE, 1986). Besides, the color temperature of daylight also varies during the day.
Color temperature of daylight is lower at sunrise and higher at sunset. Considering this
issue, Commission on Illumination (CIE) has defined simulators of the standard daylight
illuminants the SPDs of which are defined for color measurement purposes (Nassau, 1998;
20
daylight’s SPD. The color temperatures of CIE simulators vary from 4000K to 25000K.
The most common illuminant of these simulators is D65, where label D stands for daylight
and 65 is the number of the color temperature in hundreds and here stands for 6500K. D65
simulator with filtered fluorescent lamp is now in use regularly for color measurement
purposes (see figure 8) (Cie, 2004; Hirschler et al., 2011; Dietz, 2011; Broadbent, 2017;
Gilchrist & Nobbs, 2017).
Figure 8: Spectral power distribution of D65 with fluorescent lamp
(Source: Dietz, C. (2011). Light Sources and Illuminants, Color vision and colorimetry: Thero and Applications, Second Edition, 23-39.)
Elvidge et al., (2010) investigated spectral characteristics of light sources for the
identification of lighting types. According to their explanations, Compact Fluorescent
Lamp (CFL) is a low-pressure gas discharge lamp, which is designed to replace the
incandescent light bulbs. Their investigations showed that its SPD is different from that of
incandescent light bulbs. Incandescent emits light in a broad continuous spectrum and has
21
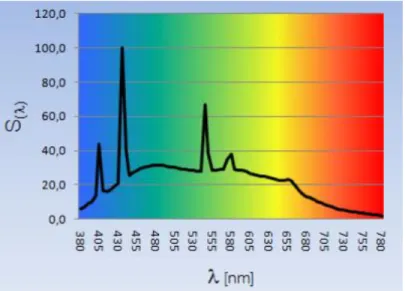
SPD characteristic of CFL light source consists of sharp narrow emission lines and is
mostly heavy in the short wavelengths (blue) which has no emission in 2500nm (infrared).
The highest peak on SPD of CFL means that the color under that peak area is emitted more
than other colors of wavelength. The figure below shows that a 13 watt Compact Flourecent
lamp (CFL) has two peak lines at 544nm and 611 nm (see figure 9).
Figure 9: Spectral Power Distribution (SPD) of a 13 watt Compact Fluorescent Light (CFL) (Source: Elvidge, C. D., Keith, D. M., Tuttle, B. T., & Baugh, K. E. (2010). Spectral
identification of lighting type and character. Sensors, 10(4), 3961–3988.)
Light Emitting Diode (LED) is a solid-state light source that generates light by
electroluminescence. Incandescent light sources are replaced LED light sources as they are
efficient, long lasting, resistant to vibration and provide full spectrum of colors (Schupbach
et al., 2015). Elvidge et al (2010) measured the SPD of LEDs with blue, green, orange and
red colors. Additionally they measured the SPD of neutral and cool white LED streetlights.
The results indicated that the SPD of the neutral white emitted more in the red zone in
22
emission band and have its curve resembling Gaussian curves with two peaks in ‘blue’ and
in the ‘green to red’ mostly. It does not have emission in the infrared (Boyce, 2014).
Figure 10: SPD graph of neutral and cool white LED
(Source: Elvidge, C. D., Keith, D. M., Tuttle, B. T., & Baugh, K. E. (2010). Spectral identification of lighting type and character. Sensors, 10(4), 3961–3988.)
Color perception of the stimuli retains the same under different light sources. However, if
the light sources consist of different SPDs, the perceived color of the stimuli will not be
the same. It is due to the fact that the interaction between SPD of light source, spectral
reflectance of the visual stimulus and human eye sensitivity are vital factors which can
affect the color appearance of the illuminated objects (Pinto et al., 2010; Pardo et al., 2012).
In the literature there are studies that evaluate the effects of these issues on the user
perception, appearance of the materials, appraisal of the visual environment, visual
performance and preferences ( Viénot et al., 2005; Mahler et al., 2009; Bodrogi et al., 2013;
23
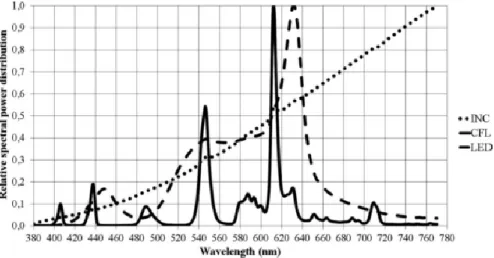
Bodrogi et al., (2013) conducted an experimental study with three different light sources;
tungsten incandescent lamp (INC, reference), a compact fluorescent lamp (CFL) and a
LED lamp with white phosphor. The light sources have different SPDs but almost the same
CCT of 2600K. The results showed that INC was better in comparison to CFL and LED
regarding color fidelity observations due to its wide and continuous SPD characteristics
(see figure 11) (Bodrogi et al., 2013).
Figure 11 : SPD of INC, CFL and LED light source used in Bodrogi et al.,’s (2013) study. (Source: Bodrogi, P., Brückner, S., Khanh, T. Q., & Winkler, H. (2013). Visual assessment of
light source color quality. Color Research and Application, 38(1), 4–13. )
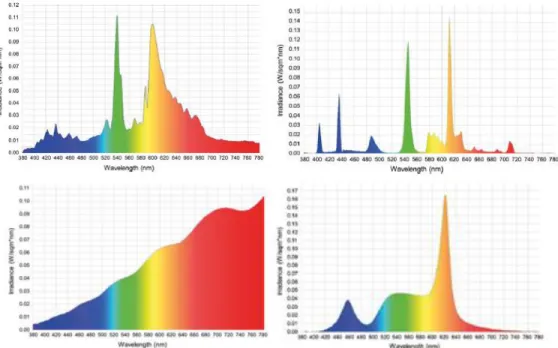
Another experimental study was conducted to investigate the perception of different
materials under different light sources. First part of the study results showed that for some
of the materials participants indicated clear preferences. For instance, they preferred red
carpet and synthetic materials under warm light whereas blue MDF under cold light.
Second experimental part of this study was conducted to understand the effects of different
light sources with the same CCT (3000K) on the perception of materials in a semantic
24
discharge (HID) lamp, fluorescent lamp, and halogen lamp. The results showed that under
LED light source, materials appeared softer to the participants than the other light sources.
They explained that it was due to the fact that LED light source emits more diffuse light
pattern which leads to softening effect (see figure 12) (Schupbach et al., 2015).
Figure 12: Left top; SPD of HID, Right top; SPD of Fluorescent, Left down; SPD of Halogen, Right down; SPD of RGB LED
(Source: Schupbach, R. L., Reisinger, M., & Schrader, B. (2015). Influence of lighting conditions on the appearance of typical interior materials. Color Research and Application, 40(1), 50–61.)
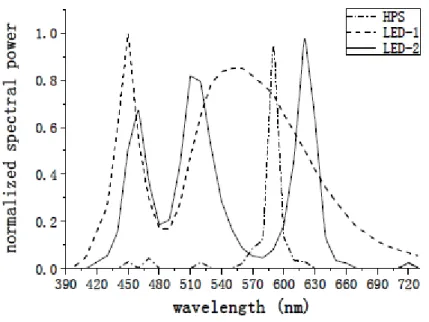
Additionally the study was applied by Jiang et al., (2014) for investigating the effects of spectrum characteristics of light sources on visual performance at mesopic condition regarding color oriented task. The study was applied using three light sources; High-pressure sodium (HPS), RGB LED and phosphor converted white LED light. The results showed that RGB LED light source gave better-saturated effect to the color and color matching under RGB LED was with less error and less mean time in mesopic condition (low illuminance 20lux, 10lux, 5lux). They explained that the results were due to the three
25
narrow peaks in SPD of RGB LED and one peak, which overlapped the scotopic luminous efficiency at 510 nm. The results of the subjective evaluation showed that under white LED light source colors appeared to be more natural. Besides, error rates were highest under HPS light source regarding color matching due to its narrow band spectrum, which leads to low CRI (see figure 13).
Figure 13: SPD of HPS, RGB LED (LED2) and phosphor converted white LED (LED1) (Source: Jiang, L., Lei, P., & Jin, P. (2014). Research of Spectrum Effects on Color Visual
Performance at Mesopic Condition, 1–4.)
In another study, the results of which is in contrast with the results of the study done by
Jiang et al., (2014) error rates in color differentiation task were higher under RGB LED.
They explained that SPD of RGB LED is narrowband spectrum and has three peaks and
three downs that lead to low emission in certain zones of the spectrum. The error rates in
ordering the caps were higher specifically around greenish-blue and purple shades. This
study again confirmed the effectiveness of the SPD characteristics of light sources on the
26
2.3. Biological effects of light sources
Nowadays, the light source quality goes beyond simply affecting the visual
performances, it also has biological and behavioral effects. As mentioned earlier the
retinal ganglion cell is one of the photoreceptor types in the human visual system. It
regulates circadian timing, heart rate, body temperature, melatonin suppression and
alertness level as non-visual biological effects of lighting (Zeitzer et al., 2000; Cajochen
et al., 2005). The sensitivity of ganglion cell varies with different wavelengths and the
color of the light sources and is most sensitive to short wavelength radiations (blue light
sources) (Zeitzer et al., 2000; Van Bommel & Van den Beld, 2003; Cajochen et al., 2005;
Van Bommel, 2006; ; Bellia et al., 2011).
The proportion of blue and green spectrum of light within its SPD can define the direction
of influence which can promote or decrease sleep or alertness level (van Bommel & van
den Beld, 2004; Bellia et al.,2011). Exposure to blue light sources that have peak (1-480
nm) in short wavelengths lead to an improvement in mood, alertness level, and visual
performance in the human visual system. The SPD of light sources must be managed and
balanced in order to adapt to the user’s needs. This aspect has become more important
nowadays as the increase in the development of light devices has led to more exposure to
non-homogeneous spectral composition of lights (Linhart & Scartezzini, 2011; Bellia et
al., 2011; Papamichael et al., 2012; Chang et al., 2013; Bourgin & Hubbard, 2016).
Alertness level as non-visual biological effect of light sources can increase or decrease with
27
know the time of sleep and wake up. The level of melatonin usually starts to increase from
evening until sunset, as the sun goes down and daylight exposure decreases. According to a
study which was conducted with healthy male participants, melatonin level of participants
decreased significantly while they were exposed to short wavelength monochromatic blue light
sources (max 479 nm) in comparison to red light source (max 627 nm) (Papamichael et al.,
2012).
According to another study, wavelength of the light source affected subjective alertness
levels. Three CCTs 6500K, 2500K and 3000K of compact fluorescent lamp were used in
that study. Results showed that under 6500K with low illuminance level (40lux) subjective
alertness level and cognitive performance specifically sustained attention were increased
significantly in comparison to other CCTs after approximately ninety minutes of exposure
to the light. This alerting level was observed to be due to the high amount of blue
component in the wavelength composition of 6500K despite the fact that the illuminance
level is so low to detect an alerting effect. Their results are in agreement with the studies
that support higher sensitivity of human circadian system to short wavelengths (Chellappa
et al., 2011; Thapan et al., 2001).
2.4. Color as Visual Stimuli
Physicists explain that color is a function of light. Newton gave names to the seven basic
colors of the sunlight wavelengths; red, orange, yellow, green, blue, indigo and violet.
Difference between these colors caused by a tint difference in the wavelengths (Aires,
28
produced through the reflection of wavelength from the objects and their surrounding
surfaces.
The surface color of the objects is defined with different color theories. Traditional color
theory consists of three pigment colors; red, blue and yellow. These are primary colors and
mixtures of the pigments of these colors lead to secondary colors; orange, green and purple.
By mixtures of these secondary colors with their adjacent primary colors, tertiary colors
are created; red-purple, red-orange, yellow-orange, yellow-green, green and
blue-purple. All these 12 colors can be seen in a color wheel (Holtzschue, 2012). The primary
colors arranged with equal spaces around the circle wheel. Colors inside the circle represent
the mixtures of primary colors. Albert Munsell proposed another color wheel in 1905
which consists of five pigment primary colors; green, blue, purple, red and yellow which
he called principle colors (see figure 14 and 15) (Zelanski & Fisher, 2010; Holtzschue,
2012).
Figure 14 : Traditional Color Wheel devised by James Maxwell
(Source: Holtzschue, L. (2012). Understanding color: an introduction for designers. Hoboken, New Jersey: John Wiley & Sons.)
29
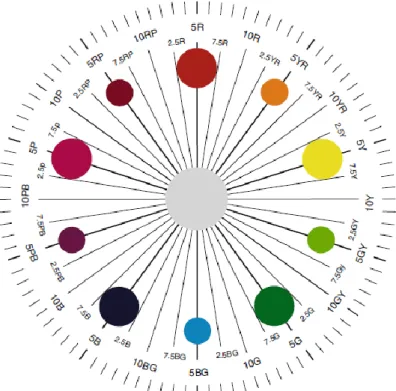
Figure 15: Munsell color wheel with five principle colors and different hues.
(Source: Fisher, G. H. (1976). The perception of color. Journal of the Neurological Sciences, 27(4), 529–530.)
Hue, value and chroma are the three attributes of color that give characteristics to color to
distinguish one color from another. Hue is the chromatic pure color attribute, which is
named as red, blue, yellow, green, etc. Hue represents the qualitative aspect of color which
means the electromagnetic wavelengths of color stimuli same as the one seen in the
reflection of sunlight through a prism (Pridmore, 2011). Saturation or chroma is the other
attribute that shows the level of saturated color. Two colors can have the same hue but due
to different saturation ranges, they are seen differently. Value or lightness is the attribute
30
and value attributes are quantitative aspects of a color which means the number of identical
waves or photons that are presented by color stimuli (Pridmore, 2011).
There are different color order systems for distinguishing the attributes of color; HSB
System, The COLORCURVE, CIE Lab System, The DIN (Deutsche Industrie Normung-
German Standardization Institute), Hungarian color order system, NCS and Munsell color
order systems. Between the different color order systems for color task performances,
Munsell color system is the most preferred and acceptable because it is the first which
divided the color into hue, value and chroma dimensions and illustrates the color in a three
dimensional space (Boyce, 2014; Aires, 2016).
Munsell’s color order system was arranged according to the human color vision’s trichromatic system. In this three dimensional system, hue is measured along the horizontal
circles, chrome going outward in radial manner and value is measured vertically from black
to white (Egan, 1983; Aires, 2016). Munsell divided the hues into five equal steps
consisting of red (5R), yellow (5Y), green (5G), blue (5B) and purple (5P) and called them
principle hues. Intermediate hues are the divisions between each of the principle hues with
yellow-red (5YR), green-yellow (5GY), blue-green (5BG), purple-blue (5PB) and
red-purple (5RP) names. From this subdivision, Munsell gets 10 division of hue but it may
frequently happen that a color does not fall exactly on one of the 10 divisions. Therefore,
he made a 100-step scale by dividing the 10 divisions into groups of 10. Value specified
on a vertical access and in a numerical scale from1 (black) to 10(white). It is the attribute
31
attribute of color and its numerical value is from 0 to various maximum values (see
figure16) (Fisher, 1976; Nassau,1997; Boyce, 2014).
Figure 16: Organization of Munsell color order system (Boyce, 2014)
(Source: Boyce P. R (2014). Human Factors in Lighting.n. p. Boca Raton: CRC Press, Taylor & Francis Group, 2014)
2.5. Color and Visual task performance
Different visual tasks are performed in the workspace by the workers and color oriented
tasks are in the category of difficult tasks. The interaction between a light source, an object
and the human visual system lead to color perception of the objects (Egan, 1983). In the
literature, different color and visual tasks such as color differentiation task, proof reading
and typing tasks are used to investigate the human visual system and its interaction with
32
Kim, 2014). Color and visual task performances are measured according to speed and
accuracy of performed tasks (Öztürk et al., 2012).
In the literature, there is information about the factors, which affect the color differentiation
performance. For instance, the smaller the size of an object, the shorter time spent to
discriminate and low illuminance level can decrease the differentiation ability for the visual
system. For accurate color differentiations, the placement of the color samples should be
done in a manner that the objects are adjacent not separated. Besides, luminance and
contrast of the object with its immediate surrounding plays an important role in color task
performances. Luminance or brightness is the amount of reflected light from an object.
Luminance contrast values should be in the standard limits in order to reach high
performance in color-oriented tasks. For instance, according to standards, there should be
3:1 luminance contrast between task and its darker surroundings (see figure 17) (Egan,
33
Figure 17: The luminance difference between an object and its darker surrounding. (Source: Egan, M. D. (1983). Concepts in architectural lighting. New York: McGraw- Hill,
c1983.)
Additionally, there are physical regulations and standards to be considered while
performing color tasks. For instance while performing color task on a flat working surface,
viewing angle of the observer should be 25 to 40 degrees (see figure 18).
Figure 18: Viewing angle of an observer on flat working surface.
(Source: Egan, M. D. (1983). Concepts in architectural lighting. New York: McGraw- Hill, c1983.)
It is important to consider the viewing angle with the task surface to prevent veiling
reflections. It is known that in flat work surfaces, the offending zone, which is the reflected
glare cause by light source, covers a big area. However, inclined work surfaces lead to have
34
reflections. According to standards, it is better to use inclined working surfaces in
workspaces.
The experiments showed that observers are not able to discriminate color attributes in color
differentiation task with 100% correct score. As mentioned earlier, the hue attribute of
color varies according to spectrum. According to a study, there should be a large change in
wavelength in order to detect a difference in hue of red colors but for most of the other
colors, almost 2nm is enough for detecting the change in hue (Fisher, 1976).
An experimental study was conducted by Melgosa et al., (2000) in order to understand the
perception of three color attributes according to Munsell color task (see figure 19). The
results showed that chroma was the most difficult attribute to differentiate but value and
hue were the most accurately distinguishable attributes. The error rates were higher on
identification of yellow hue zones. They examined that large hue differences were needed
for better color identification. Besides, only constant hues are easy to discriminate while
35
Figure 19: Farnworth-Munsel 100 hue test
(Source: http://www.visio-rx.com/vision-topics/eye-exams/testing-for-color-blindness)
In another study which investigated the color differentiation efficiency of different LED
light sources, desaturated Lanthony-Panel D15 (DD15) color task performance test was
used (Viénot et al., 2005). The Desaturated Panel D-15 consists of 16 caps, which its hues
are the same as Munsell hues but the chroma and value are 2 and 8 from Munsell color
order system respectively. It was used to examine the observers who have serious
chromatic discrimination deficiency from observers with no color vision deficiencies
(Lanthony, 1978).
Another experiment was conducted to observe the color discrimination efficiency of
different LED light sources with a desaturated panel-like discrimination test. A
discrimination test different from DD15 discrimination test was designed to use because
DD15 has small intervals along yellow axis and not constant intervals along the CIELAB
36
distributed along a color circle in CIELAB color space. CIELAB is an opponent color
system adopted by CIE in 1976 (see figure 20) (Cie, 2004; Mahler et al., 2009).
Figure 20: Color discrimination test designed by Mahler et al., 2009
(Source: Mahler, E., Ezrati, J. J., & Viénot, F. (2009). Testing LED lighting for colour discrimination and colour rendering. Color Research and Application, 34(1), 8–17.)
Lee et al., (2014) conducted a research to investigate the effects of color temperatures and
illuminance levels of light sources on participants’ visual perception and mood. They used
computer and paper based visual tasks. For both of the visual tasks participants were asked
to find the letters ‘eul’ and ‘reul’ in the given articles. The results of computer and paper based test performances showed that 3000K CCT and 750-lux illuminance level are not
the proper CCT for office spaces.
The study conducted by Shamsul et al., (2013) states that accuracy of computer based
acuity task is better under daylight compared to cool white light source. They investigated
the effects of light sources with different CCTs on performance of participants in visual
acuity and contrast test with ‘Freiburg Visual Acuity and Contrast Test’ (FrACT) in computer and paper based. The procedure of the experiment was same as the study
conducted by Linhart & Scartezzini, (2011). At computer-based task, participants were
37
on the keyboard. Besides, for testing contrast threshold, there is contrast in the color of the
Landolt rings and their background (see figure 21).
Figure 21: Computer based Freiburg Visual Acuity and Contrast Test: a) four directions of keyboard to be used during task. b) Visual acuity test. c) The contrast test
(Source: Shamsul, B. M. ., Sia, C. C., Ng, Y. ., & Karmegan, K. (2013). Effects of Light’s Colour Temperatures on Visual Comfort Level, Task Performances, and Alertness among Students.
American Journal of Public Health Research )
At paper-based task, 96 Landolt rings are printed in grey paper and participants are asked
to find the number of Landolt ring for each direction from 96 rings (see figure 22).
Figure 22: Paper based Freiburg Visual Acuity and Contrast Test
(Source: Linhart, F., & Scartezzini, J. L. (2011). Evening office lighting - visual comfort vs. energy efficiency vs. performance? Building and Environment, 46(5), 981–989.)
38
CHAPTER III
This chapter presents the methodology of the thesis. The part on the design of the study
covers the information about aims of the study, independent and dependent variables.
Then research questions and hypotheses are explained. The method of the study section
presents the experimental set up, technical specifications of light sources, color
differentiation model test, questionnaire, sample group, process and phases of the
experiment.
METHODOLOGY
3.1. Design of the study
This study aims to investigate the effects of spectral power distribution (SPD)
characteristics of light sources on hue differentiation performance of participants in terms
of accuracy and speed. The study also aims to investigate the effects of SPD characteristics
on alertness level and perceived performance of participants. The cause and effect
relationships are evaluated with the help of experimental design approach. In this
experimental study, there are three systematically changing independent variables and two
dependent variables. Independent variables are the light sources; Light Emitting Diode
(LED), Compact Fluorescent light (CFL) and daylight simulator (D65). Dependent
variables are the accuracy and speed of performing hue differentiation task, the analyses of
39
CCTs were used in this study. LED and CFL are light sources with line SPD characteristics
while D65 has continuous SPD characteristic.
Hue differentiation task designed by Kürkçü, (2017) is used in this study to investigate the
effect of SPD characteristics on hue differentiation performance of participants.
Participants performed the hue differentiation task voluntarily at a scheduled time. Besides,
for evaluating the biological effects of SPD characteristics on participants a questionnaire
is designed. The questionnaire of the study consists of perceived performance test and
Karolinska Sleepiness Scale (KSS) test. Investigating the effects of SPD characteristics on
hue differentiation performance of users can be helpful to improve lighting design
technologies for workspaces, which would enhance better work performance and the
well-being office workers.
3.1.1. Research Questions and
Hypotheses
The main research questions of the study are as follow:
Q1: Is there any significant difference in terms of accuracy and speed in performing
hue differentiation task under light sources with different spectral power
distribution (SPD) characteristics?
Q1a: Are the hue differentiation chips sensitive to SPD characteristics of
40
Q1b: Is there any significant difference in the alertness level of the
participants after being exposed to the experiment under light sources with
different SPD characteristics?
Q1c: Is there any significance difference in perceived performance of the
participants after being exposed to the experiment under light sources with
different SPD characteristics?
The hypotheses of the study are as follow:
H1: The accuracy and speed of performing hue differentiation task are significantly
higher under D65 light source than LED and CFL it can be due to wide and
continuous spectral power distribution (SPD) characteristic.
H1a: The hue differentiation chips are sensitive to SPD characteristics of
the light sources.
H1b: There is significant difference in the alertness level of the participants
after being exposed to the experiment under light sources with different
SPD characteristics.
H1c: There is significance difference in perceived performance of the
participants after being exposed to the experiment under light sources with
41
3.2. Method of the study
Method of the study presents information about experimental set up, technical
specifications of light sources, color differentiation model test, questionnaire, sample
group, process and phases of the experiment. In the experimental set up section, the light
booth and its placement in the lighting laboratory are described. In the next section,
technical specifications of light sources such as their CCTs and SPD graphs are described.
In the color differentiation section, the determined hue differentiation task is explained.
The questionnaire part consists of the perceived performance questions and KSS question.
Then the demographic information of sample group that participated in the study is
explained. In the process of the experiment part, the process of participation in the
experimental study is explained. The last part covers the phases of the experiment that
consist of five main parts; Ishihara color blindness test, KSS test before the hue
differentiation task, hue differentiation task, KSS after the hue differentiation task and
perceived performance test.
3.2.1. Experimental set up
The study was performed inside a light booth that is in the lighting laboratory room of the
Department of Interior Architecture and Environmental Design at Bilkent University. The
dimension of the room is 4.10m to 4.18m with the height of 3.85m to the ceiling. The
ceiling and walls of the room are painted in matte white (NCS-S 0300N). The floor of the
42
windows to exclude daylight and control the environmental effects. The placement of the
light booth is in the right down corner of the room. There are also cabinets in the room,
which are used as storage for light measurement equipment (see figure 23 and 24 and
Appendix figure B2)
Figure 23: Plan of the experimental set up and placement of the light booth (not to scale)