Site-Speci
fic Fluorescence Polarization for Studying the
Disaggregation of
α‑Synuclein Fibrils by Small Molecules
Conor M. Haney,
†Christina L. Cleveland,
†Rebecca F. Wissner,
†,∥Lily Owei,
†Jaclyn Robustelli,
†Malcolm J. Daniels,
‡Merve Canyurt,
†,⊥Priscilla Rodriguez,
†Harry Ischiropoulos,
§Tobias Baumgart,
†and E. James Petersson
*
,††Department of Chemistry, University of Pennsylvania, 231 South 34th Street, Philadelphia, Pennsylvania 19104, United States ‡Pharmacology Graduate Group, University of Pennsylvania, 3400 Civic Center Boulevard, Philadelphia, Pennsylvania 19104, United
States
§Department of Pediatrics, Children’s Hospital of Philadelphia, Philadelphia, Pennsylvania 19104, United States
*
S Supporting InformationABSTRACT: Fibrillar aggregates of the protein α-synuclein (αS) are one of the hallmarks of Parkinson’s disease. Here, we show that measuring the fluorescence polarization (FP) of labels at several sites onαS allows one to monitor changes in the local dynamics of the protein after binding to micelles or vesicles, and during fibril formation. Most significantly, these site-specific FP measurements provide insight into structural remodeling of αS fibrils by small molecules and have the potential for use in moderate-throughput screens to identify small molecules that could be used to treat Parkinson’s disease.
M
isfolding of the intrinsically disordered neuronal protein α-synuclein (αS) has been implicated in the patho-genesis of several debilitating neurodegenerative disorders, including Parkinson’s disease (PD).1 Although it is generally accepted thatαS exists as a disordered monomer in vivo, some controversial studies have suggested that the physiologically relevant form of αS is actually a metastable tetramer.2−6 Regardless of its initial state, the protein exhibits remarkable structural plasticity.7 Upon binding to membrane lipids, αS monomers adopt α-helical conformations.8,9 Misfolding of monomericαS leads to aberrant oligomerization and ultimately fibrillization. The insoluble cross-β strand fibrils that are the hallmarks of PD can be formed from oligomers or direct addition of monomer units.10−16Two exciting recent studies of fibril structure, electron diffraction of αS fragments and solid state nuclear magnetic resonance (NMR) of the full length protein, have provided insight into the fold offibrillar αS, but the molecular mechanisms of αS misfolding have yet to be described.17,18 Common amyloid binding dyes, such as thioflavin T (ThT) and Congo Red (CR), can be used to detect the presence ofαS fibrils.19Although extrinsic dyes are routinely employed to monitor the kinetics of amyloid formation, the structural information obtained from these experiments is limited.It has recently been shown that preformedfibrils can recruit endogenous intracellular αS and convert it into a pathogenic form in vivo.20Accordingly, small molecules that can remodel and/or disaggregateαS fibrils into less toxic species are being
investigated as potential therapeutics to combat the progression of PD.21−27Although amyloid binding dyes such as ThT and CR are used in high-throughput screening to identify modifiers of aggregation, these dyes cannot be used to reliably detect morphological changes ofαS induced by small molecules, as it is likely that the dyes and candidate compounds compete for similar binding sites.28,29 Moreover, the optical properties of amyloid binding dyes may be affected by the presence of other compounds in solution. Indeed, our own analysis of small molecule remodeling experiments using ThT shows that the change in ThT fluorescence does not accurately reflect the change in the amount of insoluble αS aggregates following small molecule treatment (seeFigures S17, S25, and S26 and discussion below). Improved methods for monitoring the aggregation and disaggregation of αS that yield meaningful structural information and are not susceptible to these drawbacks would greatly facilitate our understanding of these crucial processes.
Fluorescence polarization (FP) spectroscopy is a powerful technique for monitoring changes in the conformational mobility offluorescently labeled molecules.30By incorporating afluorescent label into a protein, one can use FP to obtain a range of dynamic information. In 2007, the Lee laboratory demonstrated that FP can be used to monitor the aggregation of αS.31 In this study, the authors prepared nonspecifically Received: October 14, 2016
Published: November 11, 2016
labeledαS by treating the recombinant protein with an amine-reactive dye. Over the course of aggregation, FP values of the labeled protein increased in a manner that was consistent with a nucleation-dependent process characteristic of αS assembly.32 Notably, the observed increase in polarization preceded fibril detection by amyloid binding dyes, suggesting that FP can be used to detect the formation of early oligomeric intermediates. Although this initial report demonstrated the utility of FP for monitoringαS aggregation, the proteins used in these studies consisted of heterogeneous mixtures of labeled constructs. Therefore, we sought to determine whether site-specifically labeledαS could be used in conjunction with FP to distinguish local changes in conformational freedom that occur during misfolding and aggregation of αS. Although several small molecules have been reported to remodel and/or disaggregate preformed αS fibrils, robust, moderate- to high-throughput methods for examining this process in real time are currently lacking. Here, we show that we can use FP to monitor the conformational changes within αS fibrils induced by small polyphenolic compounds and demonstrate that site-specific labels yield insight into their interaction with αS fibrils and subsequent local conformational changes (Table 1).
■
EXPERIMENTAL PROCEDURESFluorescence Polarization (FP) Measurements. The concentrations of high-performance liquid chromatography (HPLC)-purified fluorescein maleimide (Fam)-labeled proteins were determined by UV−vis absorbance using a molar extinction coefficient of 68000 M−1 cm−1 at 494 nm. The concentration of wild-type (WT)αS was also determined using UV−vis absorbance using a molar extinction coefficient of 5120 M−1 cm−1 at 280 nm. Prior to FP measurements, the Fam-labeled mutants were diluted into a solution of WTαS in a 1:99 molar ratio to achieve afinal total protein concentration of 100 μM; 100 μL portions of 10 μM samples were prepared in triplicate by diluting the 100μM stock into αS buffer [20 mM Tris and 100 mM NaCl (pH 7.5)]. Each sample was then gently vortexed and pipetted into an untreated Corning Costar black, clear flat bottom nonsterile 96-well plate (part no. 07-200-567). All FP measurements here and below were taken using a Tecan (Mannedorf, Switzerland) Infinite F200 Pro microplate reader equipped with excitation (485± 20 nm) and emission (535± 25 nm) filters for Fam fluorescence.
Fluorescence Polarization Measurements in Sodium Dodecyl Sulfate (SDS). To measure the FP values of each mutant in the presence of SDS, three 20 μL replicates were prepared by dilution of αS−CFamX protein stock solutions
(concentration determined as described above) with a 25 mM SDS stock in αS buffer and αS buffer to yield samples comprised of 1μM αS−CFam
Xin 10 mM SDS, 20 mM Tris, and
100 mM NaCl (pH 7.5). The samples were gently vortexed and pipetted into an untreated Grenier black, clear flat bottom nonsterile 384-well plate (part no. 781209) and assessed on the Tecan F200 Pro microplate reader after incubation at room temperature for 5 min.
FP Measurements in Large Unilamellar Vesicles (LUVs). LUVs were prepared using 100% 1,2-dioleoyl-sn-glycero-3-phospho-L-serine (DOPS). Lipids were vacuum-dried
to form a lipidfilm and rehydrated with 150 mM NaCl, 20 mM HEPES, and 1 mM TCEP (pH 7.4). Liposome solutions were sonicated for 20 min and extruded through 200 nm Whatman nuclepore membranes (GE Life Sciences, Pittsburtgh, PA) 15 times. Liposome solutions were stored at 4°C. To measure the
FP values of each mutant in the presence of DOPS LUVs, three 20μL replicates were prepared in bulk at 300 nM αS−CFamX
and 1.5 mM 200 nm DOPS LUVs (concentration of total DOPS) in 20 mM HEPES, 150 mM NaCl, pH 7.0 buffer (vesicle buffer). The samples were gently vortexed and pipetted into an untreated Grenier black, clear flat bottom nonsterile 384-well plate and assessed on the Tecan F200 Pro microplate reader after incubation at room temperature for 5 min.
Fluorescence Microscopy Imaging ofαS−CFam XBound
to Giant Unilamellar Vesicles (GUVs). GUVs composed of 99.7% DOPS and 0.3% Texas red-1,2-dihexadecanoyl-sn-glycero-3-phosphoethanolamine triethylammonium salt (Texas Red-DHPE) were prepared by electroformation in a 300 mM sucrose solution as previously described.33An imaging chamber was formed between two coverslips (25 mm × 25 mm). The chamber had a total volume of 36μL and was filled by dilution of a 6μM GUV dispersion into buffer, yielding a solution withfinal concentrations of 200 mM sucrose, 33 mM NaCl, 7 mM HEPES, 0.3 mM TCEP, and∼0.3−0.5 μM total αS−CFam
X(pH 7). The protein- and GUV-containing solution
was incubated for at least 10 min before being imaged with a confocalfluorescence microscope using a 60×, 1.1 NA objective lens (Olympus, Center Valley, PA). The incubation and imaging processes were performed at room temperature (20 °C).
Aggregation Assays. Aggregation reactions were per-formed by diluting each labeled construct into a mixture of WT αS in a 1:99 molar ratio to a final concentration of 100 μM. Aggregation samples were prepared in triplicate. Aggregation was initiated by shaking the solution at 37°C and 1500 rpm on an IKA MS3 digital orbital shaker in parafilm-sealed 1.7 mL Eppendorf tubes to ensure minimal solvent evaporation. At each time point, aliquots were removed from the aggregation reaction mixture and assessed by FP and CR absorbance in separate assays. Fluorescence polarization measurements were obtained by dilution of 10μL of the aggregation solution into 90μL of αS buffer (100 μL total volume). The samples were gently vortexed and transferred to an untreated Corning Costar black, clearflat bottom nonsterile 96-well plate and analyzed on a Tecan F200 plate reader. CR absorbance measurements were taken by dilution of 10μL of the aggregation solution into 140 μL of 20 μM CR dissolved in αS buffer. The samples were allowed to sit at room temperature for 15 min prior to being transferred to an untreated Corning Costar black, clear flat bottom nonsterile 96-well plate and absorbance measurements acquired on a Tecan M1000 plate reader using a wavelength range of 230−700 nm. Following completion of the aggregation assay, the samples were split into two separate aliquots;fibrils in each aliquot were then pelleted by centrifugation (13200 rpm for 90 min at 4 °C), and the supernatant was removed. One aliquot was immediately resuspended in an equal volume (relative to supernatant) ofαS buffer, and the measurements described above were repeated on the resuspended fibril sample. The second aliquot was frozen at−20 °C until it was analyzed by transmission electron microscopy (TEM) as described below.
Small Molecule Remodeling Assays. The 1% Fam-labeled αS fibrils of each labeled mutant were prepared for small molecule remodeling assays as described above. Stock solutions of dopamine, epigallocatechin gallate (EGCG), and nordihydroguiaretic acid (NDGA) were prepared by mass-to-volume ratio at 1 mM inαS buffer; NDGA was solubilized in 20% EtOH. Small molecule stock solutions at 500 μM
dopamine, 500μM EGCG, and 500 μM NDGA were prepared by 2-fold dilution of the 1 mM stocks inαS buffer; all stocks were prepared immediately prior to the performance of each remodeling assay. The final concentration of ethanol in the NDGA-treatedfibrils was 2% by volume. The remodeling assay wasfirst tested in triplicate by treating 10 μM αS fibrils with 100μM freshly prepared dopamine, EGCG, and NDGA; as a control, buffer was added to the fibrils in lieu of small molecules. Controls were prepared by diluting 30 μL of the resuspended 1%αS−CFamXfibrils in 270 μL of αS buffer, gently
vortexing, and splitting the sample into three wells, 100μL per well, of an untreated Corning Costar black, clearflat bottom nonsterile 96-well plate. Thefibril solutions to be treated with the small molecules were prepared by diluting 90 μL of the resuspendedfibrils in 630 μL of αS buffer, gently vortexing, and splitting the sample into nine wells, 80μL per well of the same plate as described above. Prior to the addition of the small molecule solution to theαS fibrils, the FP for all the wells was measured and the gain optimized. Small molecules were added from freshly prepared 500μM small molecule stock solutions in αS buffer (20 μL/well, in triplicate) to start the assay. Over the course of 3 h, the instrument performed the following actions every 1.5 min: orbital shaking for 2 s with an amplitude of 1 mm followed by an FP measurement of all wells using the gain optimized prior to the small molecule addition. All measure-ments were taken at room temperature.
FP of Soluble and Insoluble Fractions after the Small Molecule Remodeling Assay. At the end of the remodeling assay (i.e., 3 h post-small molecule addition), the three replicates from each condition (control, dopamine, EGCG, and NDGA) were removed from the 96-well plate, combined, and gently vortexed. After being vortexed, the combined samples were split into four Eppendorf tubes at 60μL per tube. All of the samples were then pelleted by centrifugation (13200 rpm for 90 min at 4°C) to separate the soluble and insoluble fractions. Because it is difficult to completely remove all of the supernatant without disturbing the pellet for small samples, the following procedure was used. After centrifugation, the following volumes of supernatant (soluble fraction) were removed from each of the four tubes: 0, 10, 20, and 30 μL. The 10, 20, and 30μL portions of the supernatant that were removed were combined, gently vortexed, and transferred to an untreated Grenier black, clear flat bottom nonsterile 384-well plate to be measured as the soluble fraction for the respective positions and conditions. The removed supernatant was replaced with the same volume of buffer containing the respective small molecules. The small molecule solutions used to replace the supernatant were prepared from the small molecule stocks made at the start of the remodeling assay, diluted to the same concentration as that used in the assay, and centrifuged (13200 rpm for 10 min at 4°C). All four pellets per condition (the −0, −10, −20, and −30 μL soluble fraction pellets) were then resuspended by vortexing at high speed. The resuspended pellets were then transferred to an untreated Grenier black, clearflat bottom nonsterile 384-well plate (split into three wells per Eppendorf tube, 20 μL per well) to be measured as the insoluble fractions. The FP measurememts of these samples were used to extrapolate a FP measurement for the corresponding insoluble material as described in the Supporting Information.
Transmission Electron Microscopy (TEM). TEM was performed on an FEI Tecnai T12 instrument with an accelerating voltage of 120 kV. Fibril samples obtained from
aggregation and centrifugation and stored at −20 °C as dry pellets were resuspended in 20 mM Tris and 100 mM NaCl (pH 7.5). Glow-discharged carbon Formvar-coated 300-mesh Cu grids were inverted over a 10 μL drop of sample and allowed to rest for 2 min at room temperature. After this time, the excess solution was wicked off and the grid was washed for 2× 10 s with water, and the grids were stained for 3 × 15 s with 2% (w/v) ammonium molybdate (pH 7.8) in water. The grids dried at room temperature for 2 min and then were imaged. Images were collected at magnifications ranging from 11000× to 42000×. TEM image analysis was performed manually using Gatan Digital Micrograph software (Gatan, Inc., Pleasanton, CA). Fibril length and width analysis is described in the Supporting Information.
Small Molecule Remodeling TEM. Fibril samples comprised of αS WT, 1% αS−CFam
9 in 99%αS WT, or 1%
αS−CFam
114 in 99% αS WT (10 μM fibril based on the
monomeric total αS concentration) were treated with dopamine, EGCG, or NDGA (100 μM) in triplicate as described above. Three hours after small molecule treatment under plate reader-based kinetic assay conditions described above, a representative single sample was removed from the plate and used to prepare carbon Formvar-coated 300-mesh Cu grids for negative-stain TEM as described above. Additional images of these samples are shown in the Supporting Information.
■
RESULTS AND DISCUSSIONRecently, we reported the use of inteins as purification tags for the efficient production of labeled αS to study conformational changes using Förster resonant energy transfer (FRET) and cellular trafficking of fibrils.34 To produce a library of site-specifically labeled αS for FP studies, we expressed constructs as His6-tagged Mxe GyrA intein fusions containing single Cys mutations (Figure 1). Following isolation of the intein-tagged proteins from the cell lysate by Ni-NTA chromatography, each construct was labeled using an excess offluorescein maleimide (Fam) for 3−5 h at 37 °C. After labeling, each construct was further purified by ion-exchange chromatography and HPLC. HPLC-purified proteins were characterized by matrix-assisted laser desorption ionization mass spectrometry (MALDI-MS) and polyacrylamide gel electrophoresis (PAGE) analysis. MALDI-MS of trypsin digestion fragments confirmed that the labeling ofαS proceeded in a specific and quantitative manner (seeFigures S4−S7).
We began our studies by measuring the polarization values associated with each labeled protein in detergent-free buffer. To avoid intermolecularfluorophore interactions (such as homo-FRET, which may lead to a decrease in polarization35), labeled αS was diluted into a solution of WT αS in a 1:99 molar ratio for most FP measurements [micelle and vesicle binding experiments used 100% labeled αS (see the Supporting Informationfor details)]. BecauseαS is intrinsically disordered, we expected that FP values corresponding to monomericαS would be similar for each labeled mutant. Intriguingly, we found that the polarization of the Fam label was dependent on its location within theαS sequence. These results are consistent with both in vitro and in cell NMR studies, suggesting that the residues in the C-terminal tail (96−140) exhibit a degree of conformational freedom greater than that of the residues residing in the N-terminus (1−60) and the so-called non-amyloid-containing (NAC, 61−95) domain.6,36
To further demonstrate that site-specific labels yield information about local αS dynamics, we took FP measure-ments of each αS mutant bound to sodium dodecyl sulfate (SDS) micelles or large unilamellar vesicles (LUVs). Previous NMR and single-moleculefluorescence studies have shown that upon binding to SDS, thefirst 98 residues of αS fold into a pair of curved antiparallel helices that are connected by a short turn region spanning residues 38−44.37,38 The helix−turn−helix motif is followed by a predominantly disordered C-terminal tail consisting of residues 98−140.37However, in the presence of LUVs, residues 1−98 of αS have been shown to adopt an extended helical conformation by smFRET.39In the presence of SDS and 1,2-dioleoyl-sn-glycero-3-phospho-L-serine (DOPS)
LUVs, constructs with Fam labels at position 9, 24, 42, 62, or 87 show increased FP, while constructs with Fam labels at position 114, 123, or 136 show decreased FP (Figure 2 and Figures S9 and S10). The increase in FP observed in the presence of SDS versus DOPS LUVs for labels at position 42, 62, or 87 is consistent with a rearrangement from the micelle-bound to vesicle-micelle-bound helical structures. Circular dichroism (CD) spectroscopy measurements confirm that each labeled construct adopts anα-helical conformation in the presence of SDS (Figure S8a,b). We also wished to image the boundαS constructs, because some evidence exists for remodeling of liposomes by αS to form cylindrical micelles.40 While SDS micelles and LUVs are too small for imaging, microscopy images of DOPS giant unilamellar vesicles (GUVs) confirm that our labeledαS constructs bind to the surfaces of vesicles. Our FP data are consistent with the existing NMR and electron paramagnetic resonance (EPR) structures ofαS bound to SDS micelles and previous studies of theαS conformation bound to LUVs.9,37,39,41 They are also consistent with the previous observation that monomeric, disorderedαS has long-range contacts between the N- and C-termini that are released upon binding to micelles or vesicles42,43(decreasing FP values
for C-terminal positions compared to monomer in buffer). Importantly, these experiments show that despite αS being bound to large, slowly rotating micelles or LUVs, the FP measurements reflect the local dynamics of the protein around the site of attachment of the dye toαS.
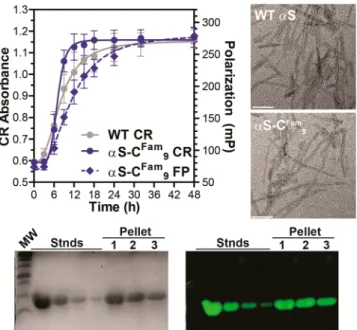
Next, we used FP to monitor the assembly of αS into amyloid fibrils. Aggregation reactions were performed by diluting each labeled construct into a mixture of WTαS in a 1:99 molar ratio and agitating the solution at 1500 rpm and 37 °C. Periodically, separate aliquots of the aggregation reaction mixture were removed for FP and CR analysis. CR binding assays demonstrated that the kinetic profiles of aggregation assays containing 1% labeled αS are very similar to those obtained using WT alone. Example data for αS−CFam
9 are
shown inFigure 3; data for all other constructs are included in the Supporting Information (Figure S12; Tables S3 and S4 detail forward aggregation kinetics for each construct).
Both FP and CR measurements generated sigmoidal curves consistent with a nucleation-dependent mechanism of amyloid aggregation. However, the kinetic profiles obtained using FP varied on the basis of the position of the incorporated label. The t1/2for the changes in FP varied from 6.7 to 27 h. This observation is consistent with some labeling positions leading to retarded co-incorporation of the labeled protein with the wild type (WT); several other explanations are plausible. For example, it is also possible that these positions indicate differences in local conformational restriction around the labeled site in a time-dependent manner during aggregation, or that addition of labeled protein perturbs the aggregation pathway. While we interpret the change in t1/2by FP relative to CR as being indicative of slower co-incorporation of labeled protein, further investigation of the mechanism of aggregation as reported by FP is underway. Regardless, aggregation end point assays showed that even constructs exhibiting a slower increase in FP, such as αS−CFam42, were ultimately
incorpo-rated well into the fibrils. We determined the percent of incorporation of labeledαS by gel imaging and the morphology of thefibrils by TEM imaging (Figures S14, S15, S29, and S30; these include larger versions of the TEM images shown in Figure 3). These kinetic and end point assays show that our chosen labeling positions were not highly disruptive to Figure 1.Labelingα-synuclein (αS) for studies of aggregation. Protein
sequence ofαS (top). Green circles indicate positions for fluorophore attachment. Cys mutants ofαS are purified using a C-terminal intein tag (bottom left), treated withβ-mercaptoethanol (β-ME) to cleave the intein, and labeled withfluorescein maleimide (Fam). Monomers ofαS can form helices when bound to membranes (bottom right). Disordered monomers can misfold and aggregate to form oligomers or fibrils. Aggregation experiments were performed with 1% labeled protein to preventfluorophore−fluorophore interactions.
Figure 2.In the left panel,fluorescence polarization (FP) reveals local dynamics in proteins bound to micelles or vesicles. FP measurements ofαS constructs labeled with Fam at the noted positions, bound to sodium dodecyl sulfate (SDS) micelles or large unilamellar vesicles (LUVs) composed of 1,2-dioleoyl-sn-glycero-3-phospho-L-serine
(DOPS). In the middle panel, the SDS-bound structure ofαS (PDB entry 1XQ8) and a model of the LUV-boundαS structure, colored to match the sequence diagram inFigure 1, are shown for comparison to the FP data.37,39 The right panels are images of Fam-labeled αS constructs bound to giant unilamellar vesicles (GUVs) composed of DOPS and Texas Red-1,2-dihexadecanoyl-sn-glycero-3-phosphoetha-nolamine. Numbers indicate the position of the Fam label on αS constructs. The scale bar is 10μm.
incorporation ofαS into fibrils or the resulting supramolecular structure (seeTable 1.
For those label positions ruled to be sufficiently non-perturbing, we examined the FP measurements of isolated fibrils. After 48 h, fibrils were pelleted by centrifugation and resuspended in buffer, and FP was measured, showing only slight differences between positions, reflecting the expected high degree of conformational restriction within fibrils. However, even in these fibrils that are >100 nm in length, the FP values are still significantly less than 470 mP, the limiting value for the polarization (anisotropy) offluorescein.44 This means that even infibrils, some dynamic range remains that allows us to interpret local differences in FP that reflect conformational dynamics in a site-dependent manner. For example, we can see that the C-terminal tail is more restricted forαS molecules within fibrils than for SDS-bound αS. This is interesting in light of previous studies ofαS fibrils, particularly recent solid state NMR studies by Rienstra and co-workers.18 Although they do not observe crosspeaks allowing them to assign structures to the terminal regions ofαS, our data suggest that these regions are conformationally restricted infibrils. It should be noted that our aggregation conditions differ from theirs, and our measurements are taken on suspensions rather than packedfibrils for NMR; therefore, this may contribute to differences in our observations.
We also examined aggregation reactions near t1/2 to see whether we could observe oligomers or other intermediates using FP. We pelleted the insoluble material after aggregation for 6, 9, or 12 h and measured the FP of the supernatant and of
the pellet after resuspension (seeFigure S13). We found that the FP readings of the supernatant remained similar to those of monomeric αS, suggesting that the remaining soluble species do not differ considerably from monomeric αS with respect to fluorophore conformational freedom. In contrast, the FP readings of the pellet were intermediate between monomer andfibril levels and grew steadily during aggregation. This may reflect the presence of smaller, protofibril aggregates at 6, 9, and 12 h, or it may be due to difficulties in completely washing away the monomer from these very small pellets. Further analysis of aggregations at early time points using techniques such as atomic force microscopy (AFM) will be required to determine the nature of these intermediate FP signals.
We next chose to examine whether we could use this technique to monitor the disaggregation ofαS fibrils. We began by using harsh conditions known to reliably dissolve fibrils, boiling in the presence of SDS.45 αS fibrils containing each labeled construct were agitated for 48 h and separated from the aggregation reaction mixture by centrifugation. The freshly resuspendedfibrils were then treated with excess SDS, boiled for 15 min, and allowed to cool to room temperature. Following the disaggregation procedure, the FP values uniformly decreased to those corresponding to the SDS-bound conformation observed previously by direct addition of SDS to monomeric αS (Figure S16). Sedimentation gel analyses confirmed that αS fibrils were efficiently dissolved following treatment with SDS. These studies demonstrate that we can use FP to reliably monitor the dissolution ofαS fibrils without the addition of any exogenous small molecule probe such as ThT.
Several small molecules are known to remodel and/or disaggregate preformedαS fibrils.21,22,26,27,46−51In some cases, it has been shown that remodeledαS is less toxic to cultured neurons. However, the molecular details underlying these structural changes and how they mitigate fibril toxicity are poorly understood. Dopaminergic nerve cell death is one of the pathological hallmarks of PD.1 Thus, several groups have examined the effect of dopamine and its oxidized derivatives on the assembly ofαS.46,48,50−52In 2004, Li et al.21reported that dopamine treatment led to the disaggregation of preformedαS fibrils. Surprisingly, the dopamine-mediated disaggregation of αS fibrils has not been described since this initial report.
In the following years, several aromatic compounds containing vicinal hydroxyl groups have been identified as Figure 3. Monitoring forward aggregation and validating labeled
constructs. The top left panel shows the aggregation kinetics offibrils made with WTαS or 1% αS−CFam
9monitored by the Congo Red
(CR) absorbance ratio (540 nm/480 nm) as well as changes in FP. The top right panels are transmission electron microscopy (TEM) images showing thatfibrils made with 1% αS−CFam
9are
morpholog-ically similar to WTαS fibrils. The scale bar is 100 nm. In the bottom panels, gel analysis demonstrates thatαS−CFam
9 is incorporated into
fibrils stoichiometrically. Standards (Stnds) of 1% αS−CFam
9loaded at
100, 50, 25, and 12.5μM. Molecular weight (MW) markers at 11, 17, 22, 25, 32, 46, and 58 kDa. The same battery of experiments was conducted onαS constructs labeled at Cys24, -42, -62, -87, -114, -123, or -136. These data are shown in theSupporting Information.
Table 1. Forward Aggregation Studies
αS t1/2CR(h)a t1/2FP(h)a fibril FP (mP)b width (nm)c WT 7.5± 0.4 NA NA 9.9± 0.9 9 7.0± 0.1 11.1± 0.5 312± 4 9.9± 0.7 24 6.9± 0.1 12.6± 0.4 307± 7 9.9± 0.7 42 7.6± 0.3 27± 8 330± 7 10.0± 0.7 62 10± 1 17± 1 333± 6 9.9± 0.7 87 10.9± 0.7 15.3± 0.9 310± 5 10.1± 0.7 114 10± 2 9.4± 0.4 335± 3 10.0± 0.5 123 8± 1 6.7± 0.2 345± 5 10.0± 0.8 136 7.5± 0.4 6.9± 0.4 330± 4 9.8± 0.7
aFibril kinetic parameters determined by fits to aggregation curves
shown inFigure S11a−c.bFP values for pelleted, resuspendedfibrils determined as described in theSupporting Information.cFibril width determined from analysis of TEM images. Example images are shown inFigure S30a−c.
efficient amyloid remodeling agents. Among the most well-studied examples is epigallocatechin gallate (EGCG), a flavonoid that is found in high concentrations in green tea. In 2010, Bieschke et al.23demonstrated that EGCG transformsαS fibrils into smaller oligomeric species that are nontoxic to mammalian cells. Time-resolved TEM and AFM imaging revealed that EGCG converts αS fibrils into poorly defined amorphous aggregates. CD spectroscopy experiments showed a progressive loss ofβ-sheet content in the presence of EGCG, demonstrating that binding of the compound led to a significant alteration of αS secondary structure. ThT binding measurements were consistent with a decreasing amyloid content. However, because EGCG and ThT likely compete for similar binding sites, the reported remodeling kinetics may be unreliable and reveal no information about local conformational changes.
Having shown that we can use FP to monitor αS folding, aggregation, and disaggregation, we reasoned that we could use this technique to gain insight into the mechanism by which small molecules remodelαS fibrils. Here, we chose to examine the remodeling capacity of dopamine, EGCG, and an additional flavonoid, nordihydroguiaretic acid (NDGA). Previously, NDGA has been shown to inhibit αS aggregation and to disassembleαS oligomers that form in the presence of FeCl3.27
However, prior to this work, the effect of NDGA treatment on the structure ofαS fibrils has not been described.
Fibrils containing each labeled mutant were treated with dopamine, EGCG, or NDGA and continuously monitored using FP (Figure 4A−D). Prolonged incubation with stoichiometric or excess amounts of dopamine had little effect on the observed FP values for any of the labeled mutants when
compared to those from control experiments with buffer alone. These data are consistent with TEM images of WTαS samples, which do not show significant changes in the morphology of fibrils from dopamine-treated samples as compared to those treated with buffer only (Figure 4H−K and Supporting Information). In contrast, rapid changes in FP for several labeled constructs were seen upon addition of EGCG or NDGA. For EGCG, larger changes in FP occurred for labels at C-terminal residues (114, 123, and 136), consistent with earlier reports suggesting that EGCG preferentially interacts with the C-terminus ofαS in oligomers.47,49Remarkably, treatment with excess NDGA produced a substantial change in FP for labels at every position except 62. These proteinwide changes may be indicative of the binding of multiple molecules of NGDA per αS molecule, resulting in dramatic remodeling of αS fibrils. Indeed, the fact that we observe quenching of Fam at many locations upon addition of EGCG or NDGA supports this idea. Control experiments demonstrating that the observed effects on FP are not simply the result offluorescence quenching but must result from changes in local protein dynamics are detailed in the Supporting Information. In all cases, the fibrils were treated with a 10-fold excess of the small molecule relative to the number of αS monomers in the fibrils. Early experiments with a more limited number of labeled constructs showed that no significant changes in FP occurred with substoichiometric levels of small molecules (seeFigure S20).
We have further analyzed the dopamine, EGCG, and NDGA reactions at the 3 h time point by pelleting the insoluble material and measuring the FP of the resuspended pellet and the supernatant (Figure 4F). We performed the resuspensions with buffer containing the small molecule used in the Figure 4.Monitoringfibril disaggregation by FP. (A−D) Fibrils made with 1% Fam-labeled αS constructs (at position 9, 24, 42, 62, 87, 114, 123, or 136) were incubated with solutions of buffer, dopamine (Dop), epigallocatechin gallate (EGCG), or nordihydroguiaretic acid (NDGA). FP measurements are normalized to aid comparison of kinetics. Raw FP values are reported in theSupporting Information. (E) After incubation for 3 h, the reaction mixtures were pelleted by centrifugation. A portion of the insoluble fraction was boiled in SDS and loaded onto a gel for quantification relative to buffer-treated fibrils, as described in theSupporting Information. (F and G) FP measurements of the resuspended insoluble and soluble fractions are shown. FP data for untreatedfibrils and for monomer are shown for comparison. (H−K) TEM images of WT αS fibrils, treated with the same disaggregation protocol, deposited on copper grids, and negatively stained with ammonium molybdate. The scale bar is 200 nm. Larger TEM images are shown inFigure S31a−d.
disaggregation reaction to ensure that switching the solvent did not perturb the reversible binding of small molecules to alter the conformations of the pelletedαS aggregates. We found that the insoluble fractions of the dopamine-treated samples and buffer-treated samples had FP readings that were similar at all positions except 62. The FP values for the insoluble fractions of the EGCG- and NDGA-treated samples were slightly higher at N-terminal and NAC positions, but lower at the far C-terminus. TEM images of WTαS fibrils treated with the small molecules show fibrils that are not significantly different in morphology than those treated with buffer alone (Figure 4H−K, additional images in Supporting Information). The most obvious difference is a reduction in the surface coverage of the TEM grids following treatment with EGCG or NDGA. The TEM images are consistent with gel-based measurements of the amount of protein remaining in the insoluble fraction (Figure 4E andFigure S25A,B).
Examination of the FP values for the soluble fractions shows a clear difference among dopamine, EGCG, and NDGA treatment (Figure 4G). Dopamine samples have FP values that are relatively similar to monomer values at each position, although gel analysis shows that very little protein is solubilized by dopamine treatment as compared to EGCG or NDGA treatment. It is notable that the dopamine FP values for positions 123 and 136 are higher, consistent with reports that dopamine binds to this region ofαS.50EGCG FP readings are consistent with the formation of large, amorphous aggregates, as previously postulated.23,47NDGA FP values at each position are also higher than for monomers or micelle-boundαS, except for a very mobile C-terminus. These data demonstrate that both EGCG and NDGA are able to solubilizeαS from fibrils and lead to increased degrees of conformational freedom in many regions of the protein, indicating a significant structural change.
We have considered two potential mechanisms for the interpretation of these data. For mechanism 1, it is known that αS monomers can be shed from fibrils at low levels.15,53
Indeed, our own size exclusion chromatography (SEC) analysis demonstrates the shedding of 5−10% monomer under buffer-only disaggregation control conditions (see Figures S18 and S19). Therefore, it is possible that EGCG or NDGA binds to these shed monomers, leading to the formation of the soluble oligomers observed by FP. This monomer-to-oligomer transition would drive further fibril-to-monomer transitions by mass action and would effectively convert fibrils to oligomers. For mechanism 2, a simpler model for disaggrega-tion would involve direct binding of EGCG or NDGA tofibrils, inducing a conformational change that leads directly to the shedding of oligomers. Of course, hybrid mechanisms are also possible, but for the preliminary studies presented here, we considered only these two mechanistic extremes.
Several lines of evidence support mechanism 2, direct binding of the small molecules to fibrils. First, treating WT fibrils with EGCG or NDGA in the presence of ThT shows a rapid decrease in ThT fluorescence, with nearly complete disappearance after 15 min (Figure S17). However, SDS− PAGE experiments demonstrate that the amounts of insoluble αS are still large (60−70%) after a 15 min EGCG or NDGA treatment (Figure S26). This implies that the decrease in ThT fluorescence is the result of interactions of EGCG and NDGA withfibril-bound ThT or competition for binding sites on the fibrils, rather than actual disaggregation. Second, treatment of the labeled αS monomer with dopamine, EGCG, or NDGA
does not lead to an observed change in FP over the time frame of the experiment, showing that the small molecules do not trigger conformational change or oligomerization that can be observed by FP when added to monomer (Figure S11). Third, we have observedfluorophore quenching shortly after addition of the small molecules tofibrils containing αS−CFamXvariants,
which implies contact between the EGCG or NDGA and each of the Fam labels (Figure S22). Taken together, these results suggest that EGCG and NDGA directly interact withfibrils at multiple sites, causing changes in conformational freedom reported by thefluorescent label.
The observed FP values for the solubilized species imply that EGCG-solubilized αS aggregates are less conformationally mobile with respect to the fluorophore sites than NDGA-solubilized aggregates (possibly involving aggregation of the small molecules, as well), but additional study will be necessary to confirm this. Preliminary CD studies of the dopamine-, EGCG-, and NDGA-treatedfibrils show that substantial β-sheet character is still present in all three cases (seeFigure S27). SEC analysis reveals the presence of oligomers following treatment with EGCG (see Figures S18 and S19). The observed peak intensity of the oligomeric species decreases following sedimentation, indicating limited solubility and/or equilibrium with sufficiently large species that they cannot be observed by SEC. Treatment of fibrils with NDGA does not lead to the observation of an oligomericαS peak in the SEC chromato-gram, suggesting that the species formed are sufficiently large that they are alsofiltered out upon loading of the SEC column. It is likely that the solubilized species involve covalent or noncovalent adducts with oxidized forms of EGCG or NDGA. Oxidation reactions of dopamine,54 EGCG,55,56 and NDGA57,58 can lead to complex mixtures of molecules. Oxidized dopamine metabolites have been reported to form covalent adducts with αS.59−61 EGCG has been proposed to form covalent or noncovalent adducts with proteins,62 including amyloid fibrils.63 Our preliminary studies with tetramethylated NDGA (mNDGA) indicate that oxidation may indeed be important to disaggregation, as mNDGA, which cannot form o-quinone oxidation products, does not have a substantial effect on αS fibrils (see Figure S26). Further investigations of the solubilized products using biophysical techniques and treatments with specific oxidation products are underway and will be reported subsequently.
■
CONCLUSIONSHere, we have shown that site-specifically labeled αS can be used in FP experiments to monitor various processes, including SDS- and LUV-induced folding,fibril formation, disaggregation, andfibril remodeling induced by exogenous small molecules. In all cases, we have shown that site-specific Fam labels yield information about local protein dynamics in a manner that is compatible with screening in multiwell plate formats. Although other groups have shown that certain small molecules can remodel αS fibrils into amorphous, nontoxic species, the molecular basis for this effect is not well understood and is likely obscured by competition between the small molecule and reporter dyes, such as ThT or CR, for protein binding sites. Our results suggest that EGCG preferentially binds to and remodels the C-terminus of αS in fibrils, yielding soluble aggregates, whereas excess dopamine has little effect on the structure ofαS fibrils. NDGA, which has not previously been explored as a disaggregant, had the most dramatic effect, mobilizing all regions ofαS. Given the evidence of a role for
oxidation and multiple binding sites in the effects of EGCG and NDGA on fibrils, further study will be needed to fully understand the mechanistic details of their actions and the structures of the resulting solubilized aggregates. Nonetheless, our studies show that our FP assay can yield information about the disaggregation process more accurately than information from typical ThT or CR high-throughput experiments. In the future, FP assays with labeled constructs validated here can be used to screen small molecules in efforts to discover novel compounds with enhanced therapeutic potential for PD.
■
ASSOCIATED CONTENT*
S Supporting InformationThe Supporting Information is available free of charge on the
ACS Publications website at DOI:
10.1021/acs.bio-chem.6b01060.
Protocols for protein expression, labeling, and character-ization as well as additional descriptions of aggregation, micelle and vesicle binding, and small molecule remodeling assays (PDF)
■
AUTHOR INFORMATION Corresponding Author*E-mail:[email protected]. Present Addresses
∥R.F.W.: Department of Chemistry, Yale University, 225 Prospect St., New Haven, CT 06520.
⊥M.C.: Department of Chemistry, Faculty of Science, Bilkent University, Ankara 06800, Turkey.
Author Contributions
C.M.H., C.L.C., and R.F.W. contributed equally to this work. Funding
This work was supported by funding from the University of Pennsylvania, as well as grants from the National Institutes of Health (NS081033 to E.J.P. and GM 097552 to T.B.). R.F.W. thanks the National Institutes of Health (NIH) for previous funding through the Chemistry-Biology Interface Training Program (T32 GM07133). C.M.H. is supported by an NIH Age Related Neurodegenerative Disease Training Grant fellowship (T32AG000255).
Notes
The authors declare no competingfinancial interest.
■
ACKNOWLEDGMENTSThe National Science Foundation provided support for the MALDI-MS (NSF MRI-0820996) and CD (NSF DMR05-20020) instruments. Electron microscopy was performed at the University of Pennsylvania Electron Microscopy Resource Laboratory (EMRL). C.M.H. thanks Dr. Dewight Williams for assistance with TEM.
■
REFERENCES(1) Auluck, P. K., Caraveo, G., and Lindquist, S. (2010) Annu. Rev. Cell Dev. Biol. 26, 211−233.
(2) Bartels, T., Choi, J. G., and Selkoe, D. J. (2011) Nature 477, 107− 110.
(3) Dettmer, U., Newman, A. J., Soldner, F., Luth, E. S., Kim, N. C., Von Saucken, V. E., Sanderson, J. B., Jaenisch, R., Bartels, T., and Selkoe, D. (2015) Nat. Commun. 6, 7314.
(4) Dettmer, U., Newman, A. J., Von Saucken, V. E., Bartels, T., and Selkoe, D. (2015) Proc. Natl. Acad. Sci. U. S. A. 112, 9596−9601.
(5) Dettmer, U., Selkoe, D., and Bartels, T. (2016) Curr. Opin. Neurobiol. 36, 15−22.
(6) Theillet, F. X., Binolfi, A., Bekei, B., Martorana, A., Rose, H. M., Stuiver, M., Verzini, S., Lorenz, D., Van Rossum, M., Goldfarb, D., and Selenko, P. (2016) Nature 530, 45−50.
(7) Uversky, V. N. (2003) J. Biomol. Struct. Dyn. 21, 211−234. (8) Chandra, S., Chen, X., Rizo, J., Jahn, R., and Südhof, T. C. (2003) J. Biol. Chem. 278, 15313−15318.
(9) Eliezer, D., Kutluay, E., Bussell, R., Jr., and Browne, G. (2001) J. Mol. Biol. 307, 1061−1073.
(10) Celej, M. S., Sarroukh, R., Goormaghtigh, E., Fidelio, G. D., Ruysschaert, J.-M., and Raussens, V. (2012) Biochem. J. 443, 719−726. (11) Cremades, N., Cohen, S. A., Deas, E., Abramov, A. Y., Chen, A. Y., Orte, A., Sandal, M., Clarke, R. W., Dunne, P., Aprile, F. A., Bertoncini, C. W., Wood, N. W., Knowles, T. P. J., Dobson, C. M., and Klenerman, D. (2012) Cell 149, 1048−1059.
(12) Dusa, A., Kaylor, J., Edridge, S., Bodner, N., Hong, D.-P., and Fink, A. L. (2006) Biochemistry 45, 2752−2760.
(13) Fink, A. L. (2006) Acc. Chem. Res. 39, 628−634.
(14) Kaylor, J., Bodner, N., Edridge, S., Yamin, G., Hong, D.-P., and Fink, A. L. (2005) J. Mol. Biol. 353, 357−372.
(15) Shvadchak, V. V., Claessens, M. M. a. E., and Subramaniam, V. (2015) J. Phys. Chem. B 119, 1912−1918.
(16) Uversky, V. N., Li, J., and Fink, A. L. (2001) J. Biol. Chem. 276, 10737−10744.
(17) Rodriguez, J. A., Ivanova, M. I., Sawaya, M. R., Cascio, D., Reyes, F. E., Shi, D., Sangwan, S., Guenther, E. L., Johnson, L. M., Zhang, M., Jiang, L., Arbing, M. A., Nannenga, B. L., Hattne, J., Whitelegge, J., Brewster, A. S., Messerschmidt, M., Boutet, B., Sauter, N. K., Gonen, T., and Eisenberg, D. S. (2015) Nature 525, 486−490.
(18) Tuttle, M. D., Comellas, G., Nieuwkoop, A. J., Covell, D. J., Berthold, D. A., Kloepper, K. D., Courtney, J. M., Kim, J. K., Barclay, A. M., Kendall, A., Wan, W., Stubbs, G., Schwieters, C. D., Lee, V. M. Y., George, J. M., and Rienstra, C. M. (2016) Nat. Struct. Mol. Biol. 23, 409−415.
(19) Conway, K. A., Harper, J. D., and Lansbury, P. T. (2000) Biochemistry 39, 2552−2563.
(20) Luk, K. C., Kehm, V., Carroll, J., Zhang, B., O’brien, P., Trojanowski, J. Q., and Lee, V. M. (2012) Science 338, 949−953.
(21) Li, J., Zhu, M., Manning-Bog, A. B., Di Monte, D. A., and Fink, A. L. (2004) FASEB J. 18, 962−964.
(22) Singh, P. K., Kotia, V., Ghosh, D., Mohite, G. M., Kumar, A., and Maji, S. K. (2013) ACS Chem. Neurosci. 4, 393−407.
(23) Bieschke, J., Russ, J., Friedrich, R. P., Ehrnhoefer, D. E., Wobst, H., Neugebauer, K., and Wanker, E. E. (2010) Proc. Natl. Acad. Sci. U. S. A. 107, 7710−7715.
(24) Prabhudesai, S., Sinha, S., Attar, A., Kotagiri, A., Fitzmaurice, A., Lakshmanan, R., Ivanova, M., Loo, J., Klärner, F.-G., Schrader, T., Stahl, M., Bitan, G., and Bronstein, J. (2012) Neurotherapeutics 9, 464− 476.
(25) Li, J., Zhu, M., Rajamani, S., Uversky, V. N., and Fink, A. L. (2004) Chem. Biol. 11, 1513−1521.
(26) Gautam, S., Karmakar, S., Bose, A., and Chowdhury, P. K. (2014) Biochemistry 53, 4081−4083.
(27) Caruana, M., Högen, T., Levin, J., Hillmer, A., Giese, A., and Vassallo, N. (2011) FEBS Lett. 585, 1113−1120.
(28) Grelle, G., Otto, A., Lorenz, M., Frank, R. F., Wanker, E. E., and Bieschke, J. (2011) Biochemistry 50, 10624−10636.
(29) Lendel, C., Bertoncini, C. W., Cremades, N., Waudby, C. A., Vendruscolo, M., Dobson, C. M., Schenk, D., Christodoulou, J., and Toth, G. (2009) Biochemistry 48, 8322−8334.
(30) Lakowicz, J. R. (2006) Principles of Fluorescence Spectroscopy, 3rd ed., Springer, New York.
(31) Luk, K. C., Hyde, E. G., Trojanowski, J. Q., and Lee, V. M. Y. (2007) Biochemistry 46, 12522−12529.
(32) Wood, S. J., Wypych, J., Steavenson, S., Louis, J. C., Citron, M., and Biere, A. L. (1999) J. Biol. Chem. 274, 19509−19512.
(33) Tian, A., and Baumgart, T. (2009) Biophys. J. 96, 2676−2688. Biochemistry
(34) Haney, C. M., Wissner, R. F., Warner, J. B., Wang, Y. X. J., Ferrie, J. J., Covell, D. J., Karpowicz, R. J., Lee, V. M. Y., and Petersson, E. J. (2016) Org. Biomol. Chem. 14, 1584−1592.
(35) Tramier, M., and Coppey-Moisan, M. (2008) in Methods in Cell Biology (Kevin, F. S., Ed.) Vol. 85, pp 395−414, Academic Press, New York.
(36) Eliezer, D., Kutluay, E., Bussell, R., Jr., and Browne, G. (2001) J. Mol. Biol. 307, 1061−1073.
(37) Ulmer, T. S., Bax, A., Cole, N. B., and Nussbaum, R. L. (2005) J. Biol. Chem. 280, 9595−9603.
(38) Moosa, M. M., Ferreon, A. C., and Deniz, A. A. (2015) ChemPhysChem 16, 90−94.
(39) Trexler, A. J., and Rhoades, E. (2009) Biochemistry 48, 2304− 2306.
(40) Mizuno, N., Varkey, J., Kegulian, N. C., Hegde, B. G., Cheng, N. Q., Langen, R., and Steven, A. C. (2012) J. Biol. Chem. 287, 29301− 29311.
(41) Jao, C. C., Hegde, B. G., Chen, J., Haworth, I. S., and Langen, R. (2008) Proc. Natl. Acad. Sci. U. S. A. 105, 19666−19671.
(42) Bertoncini, C. W., Jung, Y.-S., Fernandez, C. O., Hoyer, W., Griesinger, C., Jovin, T. M., and Zweckstetter, M. (2005) Proc. Natl. Acad. Sci. U. S. A. 102, 1430−1435.
(43) Dedmon, M. M., Lindorff-Larsen, K., Christodoulou, J., Vendruscolo, M., and Dobson, C. M. (2005) J. Am. Chem. Soc. 127, 476−477.
(44) Johansson, L. B. A. (1990) J. Chem. Soc., Faraday Trans. 86, 2103−2107.
(45) Guo, J. L., Covell, D. J., Daniels, J. P., Iba, M., Stieber, A., Zhang, B., Riddle, D. M., Kwong, L. K., Xu, Y., Trojanowski, J. Q., and Lee, V. M. Y. (2013) Cell 154, 103−117.
(46) Conway, K. A., Rochet, J.-C., Bieganski, R. M., and Lansbury, P. T. (2001) Science 294, 1346−1349.
(47) Ehrnhoefer, D. E., Bieschke, J., Boeddrich, A., Herbst, M., Masino, L., Lurz, R., Engemann, S., Pastore, A., and Wanker, E. E. (2008) Nat. Struct. Mol. Biol. 15, 558−566.
(48) Rochet, J.-C., Fleming Outeiro, T., Conway, K., Ding, T., Volles, M., Lashuel, H., Bieganski, R., Lindquist, S., and Lansbury, P. (2004) J. Mol. Neurosci. 23, 023−034.
(49) Lorenzen, N., Nielsen, S. B., Yoshimura, Y., Vad, B. S., Andersen, C. B., Betzer, C., Kaspersen, J. D., Christiansen, G., Pedersen, J. S., Jensen, P. H., Mulder, F. a. A., and Otzen, D. E. (2014) J. Biol. Chem. 289, 21299−21310.
(50) Norris, E. H., Giasson, B. I., Hodara, R., Xu, S., Trojanowski, J. Q., Ischiropoulos, H., and Lee, V. M.-Y. (2005) J. Biol. Chem. 280, 21212−21219.
(51) Rekas, A., Knott, R., Sokolova, A., Barnham, K., Perez, K., Masters, C., Drew, S., Cappai, R., Curtain, C., and Pham, C. L. (2010) Eur. Biophys. J. 39, 1407−1419.
(52) Planchard, M. S., Exley, S. E., Morgan, S. E., and Rangachari, V. (2014) Protein Sci. 23, 1369−1379.
(53) Knowles, T. P. J., Waudby, C. A., Devlin, G. L., Cohen, S. I. A., Aguzzi, A., Vendruscolo, M., Terentjev, E. M., Welland, M. E., and Dobson, C. M. (2009) Science 326, 1533−1537.
(54) Herlinger, E., Jameson, R. F., and Linert, W. (1995) J. Chem. Soc., Perkin Trans. 2, 259−263.
(55) Valcic, S., Burr, J. A., Timmermann, B. N., and Liebler, D. C. (2000) Chem. Res. Toxicol. 13, 801−810.
(56) Mochizuki, M., Yamazaki, S.-I., Kano, K., and Ikeda, T. (2002) Biochim. Biophys. Acta, Gen. Subj. 1569, 35−44.
(57) Billinsky, J. L., and Krol, E. S. (2008) J. Nat. Prod. 71, 1612− 1615.
(58) Asiamah, I., Hodgson, H. L., Maloney, K., Allen, K. J. H., and Krol, E. S. (2015) Bioorg. Med. Chem. 23, 7007−7014.
(59) Follmer, C., Coelho-Cerqueira, E., Yatabe-Franco, D. Y., Araujo, G. D. T., Pinheiro, A. S., Domont, G. B., and Eliezer, D. (2015) J. Biol. Chem. 290, 27660−27679.
(60) Werner-Allen, J. W., Dumond, J. F., Levine, R. L., and Bax, A. (2016) Angew. Chem. 128, 7500−7504.
(61) Bisaglia, M., Mammi, S., and Bubacco, L. (2007) J. Biol. Chem. 282, 15597−15605.
(62) Ishii, T., Mori, T., Tanaka, T., Mizuno, D., Yamaji, R., Kumazawa, S., Nakayama, T., and Akagawa, M. (2008) Free Radical Biol. Med. 45, 1384−1394.
(63) Palhano, F. L., Lee, J., Grimster, N. P., and Kelly, J. W. (2013) J. Am. Chem. Soc. 135, 7503−7510.