Figure 1. Microfabrication steps for producing cMUTs
Experimental Characterization of Capacitive
Micromachined Ultrasonic Transducers
Selim Olcum, Abdullah Atalar, Hayrettin Köymen, Kagan Oguz and Muhammed N. Senlik
Dept. of Electrical and Electronics Engineering, Bilkent University.Ankara, Turkey [email protected]
Abstract
In this paper, capacitive micromachined ultrasonic trans-ducers are fabricated using a sacrificial surface micro-machining process. A testing procedure has been estab-lished in order to measure the absolute transmit and re-ceive sensitivity spectra of the fabricated devices. The ex-periments are performed in oil. Pulse-echo exex-periments are performed and the results are compared to the pitch-catch measurements using calibrated transducers.
Keywords
cMUT, Capacitive Micromachined Ultrasonic Transducers.
I. INTRODUCTION
Capacitive micromachined ultrasonic transducers are under investigation for more than 12 years now. Many fabrication technologies are proposed in terms of a sacrificial layer processes and wafer bonding process in order to fabricate efficient ultrasonic transducers [1, 2]. The preliminary tests for the transducers are usually done in terms of the fre-quency spectrum of the pulse-echo signal achieved from the transducers.
In this study we demonstrate a testing procedure for cMUTs including the measurement of absolute sensitivity values of transmit and receive modes independently. A surface micromachining technology is used for fabricating the cMUTs under test. Second order effects such as mem-brane stress and thermal coefficient mismatch of different materials used in the process has been minimized.
The problems about the fabrication process are stressed and basic solutions are proposed for successful device fabrica-tion.
II. FABRICATION PROCESS
A low temperature surface micromachining process is util-ized for the fabrication of cMUT samples [2]. The maxi-mum process temperature for the entire process is 250C, which occurs during the PECVD nitride deposition step. A sketch for the fabrication flow is given in Figure 1.
(a) Gold metal is used for the bottom electrode of the cMUT. Approximately 150nm of gold is evaporated on top of a thin (10-15nm) titanium layer. Titanium is used for adhesion of gold to the silicon substrate. Another option for the bottom electrode is using the silicon substrate surface as the electrode. However, this choice increases the parasitic capacitance due to the overlapping passive top electrode
areas. Furthermore, contact resistance of the silicon sub-strate is quite large. Ohmic contacts are needed for better contacts, which require a high temperature annealing proc-ess.
(b) We employ a thin (150nm) silicon oxide isolation layer on the bottom electrode. This layer is not an absolute ne-cessity since the gold bottom electrode layer is resistant to the chromium etchant used during the wet release step. However we observed that a thin layer of silicon oxide or silicon nitride increases the adhesion of the gold layer. In the case of aluminum bottom electrodes, a pin-hole free isolation layer is required to protect the bottom electrode from sacrificial layer etchant.
(c) A chromium layer is sputtered as the sacrificial layer of the cMUTs [3]. Chromium is a common selection for the sacrificial layer because of its low surface roughness and high selectivity of its etchant to the silicon nitride mem-brane material. The thickness of this layer determines the gap height of the cMUT membrane.
(d) The membrane layer is formed in two steps. First, a one micron thick silicon nitride layer is deposited using plasma
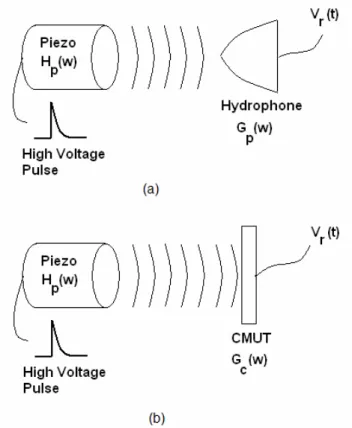
Figure 2. (a) Calibration of transmit sensitivity of piezo transducers using the hydrophone (b) Measurement of the receive sensitivity of cMUT.
Figure 3. Receiver sensitivity of a cMUT for increasing bias voltages (50V, 100V & 150V).
1 1.5 2 2.5 3 3.5 4 4.5 5 5.5 6 −280 −275 −270 −265 −260 −255 −250
Receive Sensitivity of CMUT (dB re 1 V/
µ Pa) Frequency (MHz) a=30 µm, tm=2.2 µm, ae=90% 50V DC Bias 100V DC Bias 150V DC Bias
enhanced chemical vapor deposition (PECVD) tool and released. The intrinsic stress of this layer is very important since this layer constitutes the suspended membrane. A high stress nitride layer would result in bowed or even cracked membranes after the release step. The process gas-ses are mixed with helium during the deposition cycle. The amount of helium in the chamber determines the stress level of the nitride film. In this work, the nitride stress is measured to be approximately 15-20MPa tensile.
(e) The etch holes are drilled using a reactive ion etching system. Using dedicated etch holes for each membrane is critical. This way, if there is a sealing problem in any one of the etch holes; it affects only the corresponding cell. (f) The release process takes a long time (> 6 hours.) de-pending on the membrane size and number of etch holes (we used at least four etch holes per membrane with 5 mi-crons diameter, in this work).
After the release process is finished the membrane is soaked in deionized water for 2-3 hours. Then the released membranes are immersed in methanol bath for 1 hour and dried immediately. The sticktion problem of the mem-branes is thus minimized.
(g) A second silicon nitride layer is deposited for sealing the etch holes and bringing the membrane to its final thick-ness. The stoichiometry of this deposition is identical to the previous step.
(h) We used 150nm gold layer evaporated on top of a thin titanium adhesion layer, as the top electrode. Note that this process can easily be modified and the top electrode can be
sandwiched between two silicon nitride membrane layers. However this choice leads to an internal stress on the mem-brane due to the thermal mismatch of the electrode metal and membrane material. For the characterization purpose we placed the top electrode at the top of the membrane. As a final step, pad openings for the bottom electrodes are drilled using the reactive ion etching system.
III. RECEIVER SENSITIVITY
The fabricated cMUTs are tested in an immersion system consisting of an oil tank, micromanipulator system and piezoelectric transducers. Oil is preferred as immersion fluid instead of water to avoid electrostatic breakdown or electrolysis. Receiver experiments are performed using three different piezoelectric transducers as transmitters and a 120 cells cMUT element as the receiver. The receiver cMUT is connected to a DC power supply for biasing the cMUT before the receive operation. An Agilent N5700 is used for the DC power supply. The transmitter piezos are driven using a JSR Ultrasonics DPR300 Pulser/Receiver. We employed a hydrophone (Onda HGL200) and general purpose Valpey-Fisher piezoelectric transducers to cali-brate cMUTs. Since the hydrophone cannot be immersed in oil, piezoelectric transducers are calibrated in water using the hydrophone first (Figure 2a)’ to obtain the transmitting transfer function of each piezo, Hp(ω).
The pressure field that each piezo transducer generates is measured using the calibrated hydrophone at a fixed dis-tance at the far field range, which is 3cm in this case. If the calibrated receiver sensitivity of the hydrophone is Gh(ω) (provided by the manufacturer), the Fourier Transform of Vr(t), the recorded waveform from the hydrophone using a sampling oscilloscope, Agilent DSO6052, is given as;
(
V t
r( )
)
(
E V t
1 in( )
)
H
p( )
ω
G
h( )
ω
ℑ
= ℑ
×
×
,where,
ℑ
(
E V t
1 in( )
)
is the Fourier Transform of the inputwaveform of transmitter. In the experiments where cMUT is a receiver, the input waveform is a wideband pulse with
2007 IEEE Ultrasonics Symposium 2132
Figure 2. Transmit mode sensitivity of a cMUT with 100V pulse and different bias voltages (0, 25V, 50V & 75V).
1 1.5 2 2.5 3 3.5 4 4.5 5 5.5 6 170 175 180 185 190 195 200
Transmit Sensitivity of CMUT (dB re 1
µ Pa/V) Frequency (MHz) a=30 µm, tm=2.2 µm, ae=90% 0V DC Bias 100V Pulse 75V DC Bias 100V Pulse
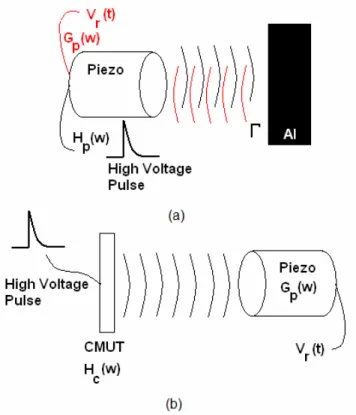
Figure 3. (a) Self calibration of the piezo transducers for receive calibration, (b) Measurement of transmit sensi-tivity of cMUTs.
amplitude ranging between 100V and 900V. Therefore the calibration for the transmit sensitivity of the piezo trans-ducers can be calculated as;
(
)
1( )
( )
( )
r p hV t
H
E
G
ω
ω
ℑ
=
×
.We can repeat the above procedure in oil, with hydrophone replaced by cMUT (Figure 2b), to find the receive sensitiv-ity of the cMUT, GC(ω). Using the transmitter sensitivity of piezo transducers, GC(ω) can be calculated using;
(
)
2( )
( )
( )
r C pV t
G
E
H
ω
ω
ℑ
=
×
,where, Vr(t ) is the recorded received waveform and E2 is the pulse energy used in the experiment.
In this experiment the maximum applied DC bias to the cMUT elements is 150V. During the preliminary experi-ments we had problems applying DC bias voltages to the membranes larger than 200V. The top electrode gold is burnt in the case of such high voltages. This is possibly due to the electrical breakdown of silicon nitride layer. This is a serious limitation and the fabrication process must be
im-proved to increase the breakdown voltage of the membrane material.
The open circuit receive sensitivity can be obtained only if an accurate knowledge of cMUT input impedance in im-mersion is available. The measured sensitivity can then be corrected for open circuit sensitivity, which can be signifi-cantly larger. The output impedance of the transmitter cir-cuitry is 50Ω whereas the input impedance of the receiver amplifier is 500Ω. The results reported in this work are uncorrected measured sensitivity with respect to these ter-minations.
The receive sensitivity of cMUT in dB re 1V/µPa is given with respect to frequency in Figure 3 for a cMUT element for different bias voltages.
IV. TRANSMITTER SENSITIVITY
A similar measurement setup is used in order to determine the transmitter sensitivity of cMUTs. We calibrated piezo-electric transducers for reception, we ca not use the hydro-phone directly in oil. Since we already know the transmit sensitivity of the piezoelectric transducers from the previ-ous experiments, we employed pulse-echo measurements to calibrate each transducer. The transmitted acoustic pulse is reflected from an aluminum block and received by the same transducer (Figure 4a). The total flight time is main-tained at 3 cm, again. Transmit/Receive mode of DPR300 is used and the received waveform is recorded using a sam-pling oscilloscope. Using the transfer functions of the transducers, the received signal can be expressed as;
(
V t
r( )
)
(
E V t
1 in( )
)
H
p( )
ω
G
p( )
ω
ℑ
= ℑ
×
×
× Γ
,where, Gp(ω) is the receive sensitivity of the piezo and Γ is the reflection coefficient of the aluminum plate (0.85). Therefore the receive sensitivity of the piezo transducers can be written as;
2007 IEEE Ultrasonics Symposium 2133
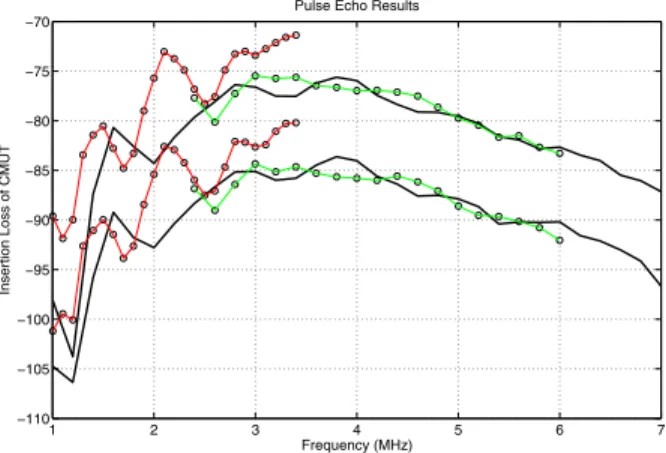
Figure 4. Measured (black line) and calculated (green & red lines) Insertion Loss of a cMUT with 100V transmit-ting pulse and 25-50V receiver biases.
1 2 3 4 5 6 7 −110 −105 −100 −95 −90 −85 −80 −75 −70 Frequency (MHz)
Insertion Loss of CMUT
Pulse Echo Results
(
)
1( )
( )
( )
r p pV t
G
E
H
ω
ω
ℑ
=
×
× Γ
.If the aluminum block is replaced by the cMUT under test and the distance between the receiver and the transmitter is adjusted to 3cm (Figure 4b), the transmitter sensitivity of the cMUT, HC(ω), can be found using the recorded wave-form as;
(
)
2( )
( )
( )
r C pV t
H
E
G
ω
ω
ℑ
=
×
where, E2 is the pulse energy of the input electrical pulse to the cMUT. Note that in this case only 100V and 150V pulses are applied to the cMUTs in order to prevent the electrical breakdown. In Figure 5 transmit mode sensitivity of a cMUT is depicted with a 100V pulse applied to cMUTs for different biases.
It can be seen in the figures that we have observed some notches at the frequency spectrum of receive and transmit sensitivities of the cMUT. Those notches occur possibly because of the substrate ringing of the cMUTs. During the experiments the cMUT die is glued to a PCB and attached to a thin aluminum holder.
The transmit sensitivity can be obtained only if an accurate knowledge of cMUT input impedance in immersion is available. The measured sensitivity can then be corrected for matched transmit sensitivity. Our calculations show a closer match to a short circuit transmission sensitivity since input impedance of the cMUT is much larger than 50Ω.
V. PULSE-ECHO MEASUREMENTS
Different from the previous measurement setups, we per-formed pulse-echo experiments using only the cMUT as both the receiver and the transmitter. The transmitted pres-sure pulse is reflected from an aluminum block with a re-flection coefficient of Γ. Note that the block is placed at 1.5cm away from the cMUT transducer in order to achieve the same conditions as the previous experiments. The transmit/receive sensitivity which is the insertion loss of the cMUT is calculated using the measured waveform;
(
)
(
1)
( )
( )
( )
( )
r C C inV t
H
G
E V t
ω
×
ω
=
ℑ
ℑ
× Γ
.The applied pulse amplitudes to the cMUTs in the transmit cycle was 100V on top of a 25 & 50V of DC bias. During the receive cycle only 50V DC bias is applied to the cMUT transducers. It is depicted in Figure 6 that, pulse echo
ex-periments show an agreement with the calculated curves using the pitch-catch experiment results.
VI. CONCLUSIONS
The fabrication and characterization of cMUTs are reported in this paper. The problems that are encountered in the fab-rication process are discussed. cMUTs are immersed in oil for characterization. A measurement setup and procedure is developed and receive and transmit sensitivity of cMUTs are determined in terms of absolute values. Calculated sen-sitivity values are used to compute the pulse-echo response of the cMUTs. Computed spectrum shows a good agree-ment with the measured pulse-echo response of the cMUT
VII. ACKNOWLEDGMENTS
This work has been supported by Turkish Scientific and Technological Council (TUBITAK) under the grant 105E023 of Research Group of Electrical and Electronics Engineering. Furthermore one of the authors, Selim Olcum, acknowledges TUBITAK for the research and graduate study scholarships.
VIII. REFERENCES
[1] Y. L. Huang, A. S. Ergun, E. Haeggstrom, M. H. Badi, and B. T. Khuri-Yakub, "Fabricating capacitive micro-machined ultrasonic transducers with wafer-bonding tech-nology," Journal of Microelectromechanical Systems, vol. 12, pp. 128-137, Apr 2003.
[2] J. Knight, J. McLean, and F. L. Degertekin, "Low tem-perature fabrication of immersion capacitive micro-machined ultrasonic transducers on silicon and dielectric substrates," Ieee Transactions on Ultrasonics Ferroelec-trics and Frequency Control, vol. 51, pp. 1324-1333, Oct 2004.
[3] G. Caliano, R. Carotenuto, A. Caronti, and M. Pap-palardo, "cMUT echographic probes: design and fabrica-tion process," in Ultrasonics Symposium, 2002. Proceed-ings. 2002 IEEE, 2002, pp. 1067-1070 vol.2.
2007 IEEE Ultrasonics Symposium 2134