Fano resonances in THz metamaterials
composed of continuous metallic wires and split
ring resonators
Zhaofeng Li,1,3,* Semih Cakmakyapan,1 Bayram Butun,1 Christina Daskalaki,2 Stelios Tzortzakis,2,4 Xiaodong Yang,3,5 and Ekmel Ozbay1,6
1Nanotechnology Research Center, and Department of Physics, and Department of Electrical and Electronics
Engineering, Bilkent University, Bilkent, 06800 Ankara, Turkey
2Institute of Electronic Structure and Laser, Foundation for Research and Technology Hellas, P.O. Box 1527, 71110
Heraklion, Greece
3Department of Mechanical and Aerospace Engineering, Missouri University of Science and Technology, Rolla,
Missouri 65409, USA
4[email protected] 5[email protected] 6[email protected] *[email protected]
Abstract: We demonstrate theoretically and experimentally that Fano resonances can be obtained in terahertz metamaterials that are composed of periodic continuous metallic wires dressed with periodic split ring resonators. An asymmetric Fano lineshape has been found in a narrow frequency range of the transmission curve. By using a transmission line combined with lumped element model, we are able to not only fit the transmission spectra of Fano resonance which is attributed to the coupling and interference between the transmission continuum of continuous metallic wires and the bright resonant mode of split ring resonators, but also reveal the capacitance change of the split ring resonators induced frequency shift of the Fano resonance. Therefore, the proposed theoretical model shows more capabilities than conventional coupled oscillator model in the design of Fano structures. The effective parameters of group refractive index of the Fano structure are retrieved, and a large group index more than 800 is obtained at the Fano resonance, which could be used for slow light devices.
©2014 Optical Society of America
OCIS codes: (160.3918) Metamaterials; (240.6680) Surface plasmons; (260.5740) Resonance.
References and links
1. U. Fano, “Effects of configuration interaction on intensities and phase shifts,” Phys. Rev. 124(6), 1866–1878 (1961).
2. A. E. Miroshnichenko, S. Flach, and Y. S. Kivshar, “Fano resonances in nanoscale structures,” Rev. Mod. Phys.
82(3), 2257–2298 (2010).
3. B. Luk’yanchuk, N. I. Zheludev, S. A. Maier, N. J. Halas, P. Nordlander, H. Giessen, and C. T. Chong, “The Fano resonance in plasmonic nanostructures and metamaterials,” Nat. Mater. 9(9), 707–715 (2010). 4. T. W. Ebbesen, H. J. Lezec, H. F. Ghaemi, T. Thio, and P. A. Wolff, “Extraordinary optical transmission
through sub-wavelength hole arrays,” Nature 391(6668), 667–669 (1998).
5. F. J. Garcia-Vidal, L. Martin-Moreno, T. W. Ebbesen, and L. Kuipers, “Light passing through subwavelength apertures,” Rev. Mod. Phys. 82(1), 729–787 (2010).
6. S. F. Mingaleev, A. E. Miroshnichenko, and Y. S. Kivshar, “Coupled-resonator-induced reflection in photonic-crystal waveguide structures,” Opt. Express 16(15), 11647–11659 (2008).
7. X. Yang, M. Yu, D. L. Kwong, and C. W. Wong, “All-optical analog to electromagnetically induced transparency in multiple coupled photonic crystal cavities,” Phys. Rev. Lett. 102(17), 173902 (2009). 8. S. Zhang, D. A. Genov, Y. Wang, M. Liu, and X. Zhang, “Plasmon-induced transparency in metamaterials,”
Phys. Rev. Lett. 101(4), 047401 (2008).
9. N. Verellen, Y. Sonnefraud, H. Sobhani, F. Hao, V. V. Moshchalkov, P. Van Dorpe, P. Nordlander, and S. A. Maier, “Fano resonances in individual coherent plasmonic nanocavities,” Nano Lett. 9(4), 1663–1667 (2009).
10. F. Hao, Y. Sonnefraud, P. Van Dorpe, S. A. Maier, N. J. Halas, and P. Nordlander, “Symmetry breaking in plasmonic nanocavities: subradiant LSPR sensing and a tunable Fano resonance,” Nano Lett. 8(11), 3983–3988 (2008).
11. Y. Hu, S. J. Noelck, and R. A. Drezek, “Symmetry breaking in gold-silica-gold multilayer nanoshells,” ACS Nano 4(3), 1521–1528 (2010).
12. A. Artar, A. A. Yanik, and H. Altug, “Directional double Fano resonances in plasmonic hetero-oligomers,” Nano Lett. 11(9), 3694–3700 (2011).
13. Z. Y. Fang, J. Cai, Z. Yan, P. Nordlander, N. J. Halas, and X. Zhu, “Removing a wedge from a metallic nanodisk reveals a Fano resonance,” Nano Lett. 11(10), 4475–4479 (2011).
14. S. Zhang, K. Bao, N. J. Halas, H. Xu, and P. Nordlander, “Substrate-induced Fano resonances of a plasmonic nanocube: A route to increased-sensitivity localized surface plasmon resonance sensors revealed,” Nano Lett.
11(4), 1657–1663 (2011).
15. K. Aydin, I. M. Pryce, and H. A. Atwater, “Symmetry breaking and strong coupling in planar optical metamaterials,” Opt. Express 18(13), 13407–13417 (2010).
16. R. Singh, I. A. I. Al-Naib, M. Koch, and W. Zhang, “Sharp Fano resonances in THz metamaterials,” Opt. Express 19(7), 6312–6319 (2011).
17. J. Wang, C. Fan, J. He, P. Ding, E. Liang, and Q. Xue, “Double Fano resonances due to interplay of electric and magnetic plasmon modes in planar plasmonic structure with high sensing sensitivity,” Opt. Express 21(2), 2236– 2244 (2013).
18. N. Liu, L. Langguth, T. Weiss, J. Kästel, M. Fleischhauer, T. Pfau, and H. Giessen, “Plasmonic analogue of electromagnetically induced transparency at the Drude damping limit,” Nat. Mater. 8(9), 758–762 (2009). 19. X. G. Yin, C. P. Huang, Q. J. Wang, W. X. Huang, L. Zhou, C. Zhang, and Y. Y. Zhu, “Fanolike resonance due
to plasmon excitation in linear chains of metal bumps,” Opt. Express 19(11), 10485–10493 (2011).
20. N. Liu, T. Weiss, M. Mesch, L. Langguth, U. Eigenthaler, M. Hirscher, C. Sönnichsen, and H. Giessen, “Planar metamaterial analogue of electromagnetically induced transparency for plasmonic sensing,” Nano Lett. 10(4), 1103–1107 (2010).
21. J. A. Fan, C. Wu, K. Bao, J. Bao, R. Bardhan, N. J. Halas, V. N. Manoharan, P. Nordlander, G. Shvets, and F. Capasso, “Self-assembled plasmonic nanoparticle clusters,” Science 328(5982), 1135–1138 (2010).
22. M. Hentschel, M. Saliba, R. Vogelgesang, H. Giessen, A. P. Alivisatos, and N. Liu, “Transition from isolated to collective modes in plasmonic oligomers,” Nano Lett. 10(7), 2721–2726 (2010).
23. M. Hentschel, D. Dregely, R. Vogelgesang, H. Giessen, and N. Liu, “Plasmonic oligomers: the role of individual particles in collective behavior,” ACS Nano 5(3), 2042–2050 (2011).
24. D. W. Brandl, N. A. Mirin, and P. Nordlander, “Plasmon modes of nanosphere trimers and quadrumers,” J. Phys. Chem. B 110(25), 12302–12310 (2006).
25. J. A. Fan, K. Bao, C. Wu, J. Bao, R. Bardhan, N. J. Halas, V. N. Manoharan, G. Shvets, P. Nordlander, and F. Capasso, “Fano-like interference in self-assembled plasmonic quadrumer clusters,” Nano Lett. 10(11), 4680– 4685 (2010).
26. M. Rahmani, D. Y. Lei, V. Giannini, B. Lukiyanchuk, M. Ranjbar, T. Y. F. Liew, M. Hong, and S. A. Maier, “Subgroup decomposition of plasmonic resonances in hybrid oligomers: modeling the resonance lineshape,” Nano Lett. 12(4), 2101–2106 (2012).
27. D. Dregely, M. Hentschel, and H. Giessen, “Excitation and tuning of higher-order Fano resonances in plasmonic oligomer clusters,” ACS Nano 5(10), 8202–8211 (2011).
28. C. Wu, A. B. Khanikaev, R. Adato, N. Arju, A. A. Yanik, H. Altug, and G. Shvets, “Fano-resonant asymmetric metamaterials for ultrasensitive spectroscopy and identification of molecular monolayers,” Nat. Mater. 11(1), 69–75 (2012).
29. N. Liu, M. Hentschel, T. Weiss, A. P. Alivisatos, and H. Giessen, “Three-dimensional plasmon rulers,” Science
332(6036), 1407–1410 (2011).
30. C. Wu, A. B. Khanikaev, and G. Shvets, “Broadband slow light metamaterial based on a double-continuum Fano resonance,” Phys. Rev. Lett. 106(10), 107403 (2011).
31. W. S. Chang, J. B. Lassiter, P. Swanglap, H. Sobhani, S. Khatua, P. Nordlander, N. J. Halas, and S. Link, “A plasmonic Fano switch,” Nano Lett. 12(9), 4977–4982 (2012).
32. X. Piao, S. Yu, and N. Park, “Control of Fano asymmetry in plasmon induced transparency and its application to plasmonic waveguide modulator,” Opt. Express 20(17), 18994–18999 (2012).
33. A. Lovera, B. Gallinet, P. Nordlander, and O. J. F. Martin, “Mechanisms of Fano resonances in coupled plasmonic systems,” ACS Nano 7(5), 4527–4536 (2013).
34. Z. Ruan and S. Fan, “Temporal coupled-mode theory for Fano resonance in light scattering by a single obstacle,” J. Phys. Chem. C 114(16), 7324–7329 (2010).
35. V. Giannini, Y. Francescato, H. Amrania, C. C. Phillips, and S. A. Maier, “Fano resonances in nanoscale plasmonic systems: A parameter-free modeling approach,” Nano Lett. 11(7), 2835–2840 (2011). 36. B. Gallinet and O. J. F. Martin, “Ab initio theory of Fano resonances in plasmonic nanostructures and
metamaterials,” Phys. Rev. B 83(23), 235427 (2011).
37. C. L. Garrido Alzar, M. A. G. Martinez, and P. Nussenzveig, “Classical analog of electromagnetically induced transparency,” Am. J. Phys. 70(1), 37–41 (2002).
38. Y. S. Joe, A. M. Satanin, and C. S. Kim, “Classical analogy of Fano resonances,” Phys. Scr. 74(2), 259–266 (2006).
39. N. Engheta, “Circuits with light at nanoscales: optical nanocircuits inspired by metamaterials,” Science
40. B. Abasahl, C. Santschi, and O. J. F. Martin, “Quantitative extraction of equivalent lumped circuit elements for complex plasmonic nanostructures,” ACS Photon. 1(5), 403–407 (2014).
41. Z. Li, M. Gokkavas, and E. Ozbay, “Manipulation of asymmetric transmission in planar chiral nanostructures by anisotropic loss,” Adv. Opt. Mater. 1(7), 482–488 (2013).
42. M. A. Ordal, R. J. Bell, R. W. Alexander, Jr., L. L. Long, and M. R. Querry, “Optical properties of Au, Ni, and Pb at submillimeter wavelengths,” Appl. Opt. 26(4), 744–752 (1987).
43. L. Zhu, F. Meng, F. Zhang, J. Fu, Q. Wu, X. Ding, and J. L.-W. Li, “An ultra-low loss split ring resonator by suppressing the electric dipole moment approach,” Prog. Electromagn. Res. 137, 239–254 (2013).
44. Z. Li, K. Aydin, and E. Ozbay, “Transmission spectra and the effective parameters for planar metamaterials with omega shaped metallic inclusions,” Opt. Commun. 283(12), 2547–2551 (2010).
45. A. K. Azad, A. J. Taylor, E. Smirnova, and J. F. O’Hara, “Characterization and analysis of terahertz metamaterials based on rectangular split-ring resonators,” Appl. Phys. Lett. 92(1), 011119 (2008). 46. Y. Sun, B. Edwards, A. Alù, and N. Engheta, “Experimental realization of optical lumped nanocircuits at
infrared wavelengths,” Nat. Mater. 11(3), 208–212 (2012).
47. J. Zhou, T. Koschny, M. Kafesaki, E. N. Economou, J. B. Pendry, and C. M. Soukoulis, “Saturation of the magnetic response of split-ring resonators at optical frequencies,” Phys. Rev. Lett. 95(22), 223902 (2005). 48. Z. Li, K. Aydin, and E. Ozbay, “Determination of the effective constitutive parameters of bianisotropic
metamaterials from reflection and transmission coefficients,” Phys. Rev. E Stat. Nonlin. Soft Matter Phys. 79(2), 026610 (2009).
49. R. Zhao, T. Koschny, and C. M. Soukoulis, “Chiral metamaterials: retrieval of the effective parameters with and without substrate,” Opt. Express 18(14), 14553–14567 (2010).
50. R. M. Jones, (1970b), “The meaning of a complex group refractive index,” in URSI 1970 Fall Meeting, 15–17 September at The Ohio State University, Columbus, Ohio (1970), p. 51.
51. L. D. Landau and E. M. Lifshitz, Electrodynamics of Continuous Media, 2nd ed. (Pergamon, 1984), Chap. 7. 52. X. Hu, C. T. Chan, J. Zi, M. Li, and K. M. Ho, “Diamagnetic response of metallic photonic crystals at infrared
and visible frequencies,” Phys. Rev. Lett. 96(22), 223901 (2006).
53. R. A. Depine and A. Lakhtakia, “A new condition to identify isotropic dielectric-magnetic materials displaying negative phase velocity,” Microw. Opt. Technol. Lett. 41(4), 315–316 (2004).
54. A. Gorodetsky, A. D. Koulouklidis, M. Massaouti, and S. Tzortzakis, “Physics of the conical broadband terahertz emission from two-color laser-induced plasma filaments,” Phys. Rev. A 89(3), 033838 (2014).
1. Introduction
Before the conceptual work of Fano resonance in 1961 [1], the Lorentzian formula was regarded as the fundamental lineshape of a resonance. In contrast to Lorentzian resonance, Fano resonance exhibits a distinctively asymmetric shape. The origin of this asymmetric lineshape is due to the constructive and destructive interference of a broad spectral line or continuum with a narrow discrete resonance [2]. Although Fano resonance was firstly discovered in quantum mechanics, its classical analogs have been found to be ubiquitous in classical optics systems including plasmonic nanostructures and metamaterials [3]. For instance, the phenomenon of extraordinary optical transmission through an array of subwavelength holes can be understood in the Fano analysis [4,5]. Furthermore, when the frequencies of two Fano resonances overlap, an analog of electromagnetically induced transparency (EIT) effect can be realized [2,6]. Analogs of EIT effects have also been obtained in photonic crystals [7], and plasmonic structures [8]. Over the past several years Fano resonances have been observed in a number of plasmonic nanostructures [9–14], metamaterials [15–17], metasurfaces [18,19], and nanoclusters including different number of nanoparticles [20–27]. Due to their narrow bandwidth and highly asymmetric lineshape, Fano resonances can be utilized in applications such as biosensors [28], plasmonic rulers [29], slow light [30], plasmonic switch [31], and modulators [32], etc. In order to obtain Fano resonances, a popular design is to use a broad band dipolar resonator interfering with a narrow band higher order quadrupole resonator [8,9,18,20]. The dipole resonator is considered as a bright mode that can be excited by the incident wave, while the quadrupole resonator is considered as a dark mode that cannot be excited by the incident wave directly. Meanwhile, another way to create Fano resonances is to introduce symmetry breaking into plasmonic systems. For instance, Fano resonances have been realized by introduction of symmetry breaking into split ring resonators (SRRs) with double splits [16], and ring-disk nanocavities [10]. By introducing symmetry breaking, higher order resonant modes such as quadrupole modes can be excited. However, due to the complex characteristics of higher order resonant modes, it remains a challenging task to design Fano resonances at specific frequencies. The existence of higher order modes may also put strict precision requirement on
the fabrication process, where a small variation of the geometries could change the resonance line shape drastically. To avoid the disadvantages of using higher order resonant modes, Lovera et al. demonstrated Fano resonances from the interaction of two bright dipolar modes only and this kind of Fano resonances are more robust and easy to engineer [33].
In this paper, we report Fano resonances at terahertz (THz) frequencies arising from the interference of the transmission continuum of a continuous metallic wires array and the bright resonant mode of SRRs. In the present design of Fano resonances, no dark mode is used. Although there have been theoretical models addressing the analysis of Fano resonances of plasmonic structures with high accuracy, complex mathematics are needed in the derivations [34–36]. Therefore, a simple model of coupled mechanical oscillators (CMO) has been widely used in the analysis of Fano resonances of plasmonic structures [2,33,37,38]. While the CMO model can help us to understand the nature of Fano interference, its parameters do not correspond directly to the properties of the plasmonic structures so that the CMO model can hardly be used in the real design. Meanwhile, another method of lumped circuit elements was also proposed to study the response of plasmonic nanostructures [39, 40]. In order to better understand the underlying mechanisms involved in Fano resonances, in this paper we have used a transmission line combined with a lumped element (TLLE) model to describe Fano resonances [41]. In contrast to the CMO model, the TLLE model is more intuitive and its parameters correspond directly to the properties of the metamaterials. In the TLLE model, most of the input parameters of Fano resonances are the plasmonic properties of the original resonant modes before coupling. Therefore, we demonstrate clearly that it is the interaction between the original modes that results in the hybridized Fano resonant modes. By tuning the original modes of the SRRs, one can easily tune the frequency position of Fano resonances. Furthermore, we have also retrieved the effective refractive index and group index for the “Fano metamaterials”. At the frequency of transmission peak of the Fano resonance, a group index more than 800 can be obtained. Such “Fano metamaterials” could be exploited for the development of slow light devices.
2. The design of the Fano structures
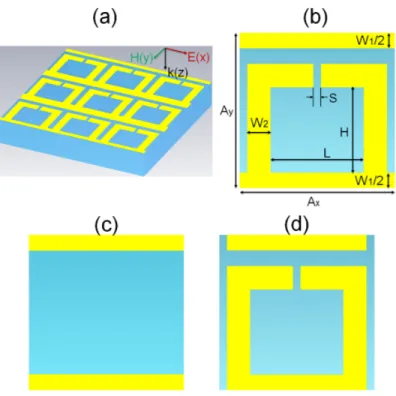
Figure 1(a) shows the schematics of the designed planar Fano structure, which consists of periodic continuous gold wires attached with periodic SRRs fabricated on a quartz substrate. The incident electromagnetic (EM) wave is polarized in the x direction along the continuous gold wires. Figure 1(b) depicts the unit cell of the Fano structure shown in Fig. 1(a). The dimensions of the unit cell are given in the caption of Fig. 1. Basically, the structure of Fig. 1(b) can be seen as the combination of a metallic wires structure shown in Fig. 1(c) and a SRR structure shown in Fig. 1(d).
Figure 2 shows the simulation results of transmission spectra for a series of Fano structures of Fig. 1(a) with different slit width (S = 1, 3, 5, and 7 μm). The simulations were carried out in the frequency domain using CST Microwave Studio commercial software in which finite integration technique is employed. The dielectric constant of gold is described by the Drude model 1 2/ ( 2 )
p c
f f if f
ε= − + with the plasma frequency fp =2175THz and the collision frequency fc =9THz [42], respectively. The quartz has a refractive index of 2.1. During the simulations, one unit cell of the metamaterial was placed inside a simulation region with the transverse boundary conditions set to be periodic. Two simulation regions were placed at the entrance and exit of the simulation region to serve as source and detector, respectively. The distance between the detector (or source) region and the metamaterial slab is set to be 3 cm. In order to obtain the pure response of the Fano structures in the transmission spectra, we employed a thick substrate and set the simulation region of detector to be impedance matched to the substrate to avoid Fabry-Perot echoes from the back surface of the substrate.
Fig. 1. (a) The schematics of the metallic planar Fano structure on a quartz substrate with a thickness of 0.38 mm. (b) The unit cell of the metallic Fano structure, which can be regarded as the combination of (c) A unit cell of purely continuous metallic wires structure, and (d) A unit cell of purely SRR structure. The dimensions of the Fano structures are as following: Ax =
Ay = 40 μm, W1 = 8 μm, W2 = 6 μm, L = 24 μm, H = 22 μm, and S is the slit width that can be
tuned. The thickness of gold for the Fano structure is 200 nm.
Fig. 2. The simulation results of the transmission magnitude spectra for the Fano structure of Fig. 1(a) with a varied slit width S = 1,3,5,and 7 μm, as shown in the inset. Asymmetric lineshapes of Fano resonances can be clearly seen, and the resonant frequency can be tuned by varying the slit width S.
From Fig. 2, it is seen clearly that a series of asymmetric lineshapes of transmissions, which are the main characteristics of Fano resonance, are obtained in the frequency range of 1.0 to 1.2 THz. When the slit width (S) increases from 1 μm to 7 μm gradually, the transmission peak of the Fano resonance shifts accordingly from 1.00 THz to 1.15 THz. At the same time, the strength of the Fano resonance decreases, and the FWHM (full width at half maximum) of the transmission peak increases. The reason is that when the slit width increases, the residual electric dipole moment becomes larger. Therefore, the radiation loss of the SRR structure increases [43]. This results in the lower quality factor of the resonance and the line width of the transmission peak increases.
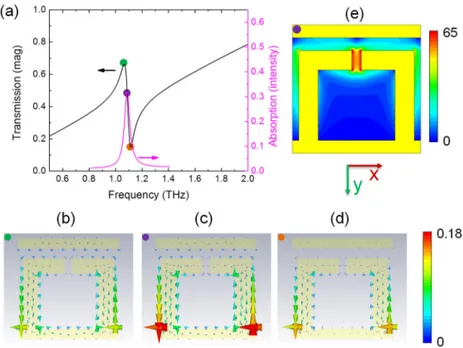
Fig. 3. (a) The simulation results of the transmission and absorption spectra for the Fano structure with slit width S = 3 μm. (b), (c), and (d) are the current distribution corresponding to the three frequencies indicated by the colored dots on the transmission spectrum. (e) is the electric field |E| distribution at Fano resonance on the cut plane at the middle thickness of the Fano structure.
In order to study the nature of the Fano resonance, it is helpful to calculate the current and field distributions around the resonant frequency. However, it is difficult to determine the exact frequency of Fano resonance only from the transmission spectrum. Therefore, we also calculated the absorption spectrum for a typical Fano structure with slit width S = 3 μm. Here the absorption spectrum is obtained according to the formula A = 1-T-R, where A is absorption intensity, T is transmission intensity, and R is reflection intensity, respectively. Figure 3(a) shows the simulation results of both transmission and absorption spectra. The frequency of the absorption peak corresponds to the exact frequency of the Fano resonance which lies between the transmission peak and dip [19]. On the curve of the transmission spectrum, we marked three frequency positions with different colored dots which correspond to transmission peak, Fano resonance, and transmission dip, respectively. Figures 3(b)–3(d) show the current distributions for the three frequencies corresponding to the three colored dots. Since the currents in the y direction do not contribute to the far-field scattered fields polarized in the x direction, in the following we will mainly discuss the current distributions that flow in the x direction (horizontal direction). The green dot corresponds to the transmission peak. As shown in Fig. 3(b), at this frequency, the currents on the overlapping area of the SRRs and continuous wires flow in the direction that is opposite to the currents on
the rest area of the Fano structure. This will result in a destructive interference of the scattered field, which leads to the transmission peak. On the other hand, the orange dot corresponds to the transmission dip. It can be seen from Fig. 3(d) that at this frequency the currents on the overlapping area are almost cancelled out, while the currents on the rest areas are in phase and their scattered fields will interfere constructively leading to the transmission dip. According to the peak position of absorption, the true Fano resonant frequency is marked in purple. Its current distribution is shown in Fig. 3(c). It is seen that the currents in Fig. 3(c) are considerably stronger than that of Figs. 3(b) and 3(d). Since the absorption comes from the resistance of the gold layer, the stronger currents in Fig. 3(c) result in the peak of the absorption spectrum. The frequency of the purple dot also corresponds to the highest electric field enhancement. Figure 3(e) shows the magnitude of the electric field distribution on the cut plane at the half thickness of the gold layer. The maximum electric field enhancement is located at the slit gap area of the Fano structure. The magnitude of the electric field can be enhanced by a factor of 65 that corresponds to an intensity enhancement of more than 4,000. This will be useful in applications of plasmonic sensors. While for the other two frequencies, the enhancement factors of the electric field magnitude are 36 for the transmission peak (green dot) and 12 for the transmission dip (orange dot), respectively.
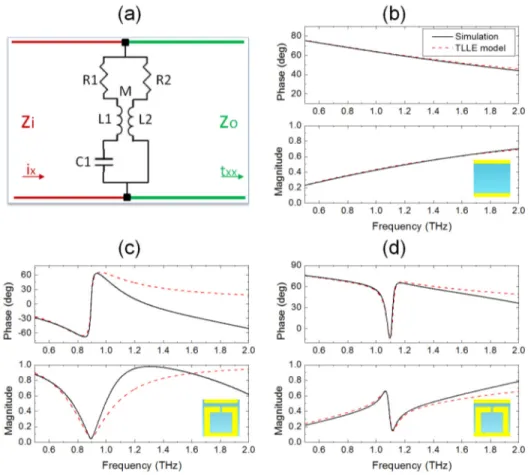
Fig. 4. (a) The TLLE-model for the Fano structure. (b), (c), and (d) are the comparison between the results of TLLE-model and the results of simulation for the continuous wires structure, SRR structure, and Fano structure, respectively. Both the magnitude and phase information are presented. The transmission magnitudes of samples are all normalized to the results of a bare substrate.
As can be seen from Fig. 1, the Fano structure is intuitively constructed by adding the SRR structure to the continuous wires structure. Therefore, to better understand the formation
of Fano resonance, one should also study the characteristics of the SRR arrays and continuous wires arrays quantitatively. Accordingly, we have calculated the transmission spectra (both magnitude and phase) for the continuous wires structure and SRR structure with slit width S = 3 μm, and the results are shown in Figs. 4(b) and 4(c). The results of Fano structure with slit width S = 3 μm are also shown in Fig. 4(d) for comparison.
From Fig. 4(b), it is seen that the continuous wires structure shows a typically continuum transmission characteristic of a plasmonic metamaterial with its permittivity being negative [44], where below the effective plasmonic frequency the transmission becomes lower when the operation frequency decreases. It can be seen from Fig. 4(c) that the SRR structure shows a typically narrow Lorentz transmission dip at 0.89 THz. In the higher frequency range, the line shape is distorted by the higher frequency mode [41,45]. In Fig. 4(d) of the Fano structure, it is seen that an asymmetric line shape of resonance is added on to the continuum spectrum. The resonant frequency of this Fano resonance (1.08 THz) is blue shifted compared to the SRR resonance frequency (0.89 THz). In order to better understand the mechanisms of Fano resonance and the blue shift of the resonant frequency, we have established TLLE models to mimic the planar structures of Fig. 1 [41]. Compared with the usually used CMO model [37,38], the parameters of the TLLE-model (resistance R, inductance L, capacitance C) are more intuitive because they correspond physically to the properties of the metasurfaces and plasmonic structures [45,46]. Figure 4(a) shows the TLLE-model for the Fano structure. Zi and Zo represent the impedances of input side (air) and output side (quartz substrate). R1, L1, and C1 represent the lumped element parameters of the SRR structure. R2 and L2 represent the lumped element parameters of the continuous wires structure. There is a mutually inductance M between L1 and L2, where M=κ L1 L2⋅ . κ is the coupling
coefficient in the range from 0 to 1. When R1 is set to be infinite (a very large value practically) and κ is set to be 0, the TLLE-model is effectively mimicking the continuous wires structure. Figure 4(b) shows the fitting results compared to the simulation results with the lumped element parameters R2 = 0.5 Ω, and L2 = 9.36 pH. It is seen that both the magnitude and the phase information are in good agreement. Similarly, after setting the R2 to be infinite and κ to be 0, we can fit the resonance of the SRR. Figure 4(c) shows the fitting results and the simulation results with the lumped element parameters R1 = 5.8 Ω, L1 = 35.87 pH, and C1 = 0.8824 fF. It is seen that the fitting results and the simulation results are in good agreement in the lower frequency range, while in the higher frequency range they do not match to each other. This is because a higher frequency electric dipole resonance mode lying at 2.54 THz is not included in the TLLE model [41,45]. Based on the obtained lumped element parameters of continuous wires and SRRs, the simulation results of the Fano structure can be fitted with the TLLE model. During the fitting process of the Fano structure, the parameters of R1, L1, R2, and L2 are fixed at the original values and only the values of C1 and κ are varied. Since the connection of the SRRs has changed the capacitance between neighboring SRRs, C1 should be changed [47]. The final fitting results are shown in Fig. 4(d) and agree well with the simulation results. The lumped element parameters R1, L1, R2, and L2 remain unchanged. C1 decreased from 0.8824 fF to 0.6042 fF, and the coupling coefficient κ is 0.25. It is worth noting that in the higher frequency range, the fitting results and the simulation results agree better for the Fano structure [Fig. 4(d)] than for the pure SRR structure [Fig. 4(c)]. This is because some of the higher order modes that exist in the SRR structure are eliminated by the connection of the continuous metallic wires. Consequently, by using the TLLE model, it is verified both qualitatively and quantitatively that the blue shift of the resonant frequency of the Fano structure compared to the SRR structure is mainly due to the variation of the capacitance of the SRR structure. However, if the CMO model is used to fit the simulation results, it would be difficult to obtain the above quantitative results. Therefore, compared to the CMO model, the TLLE model can play much powerful role in the future design of Fano resonance structures or EIT structures.
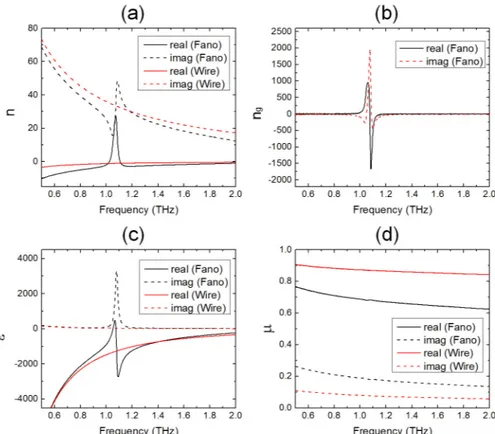
Fig. 5. (a) The retrieved effective index n (real and imaginary parts) of the Fano structure and the wires structure, respectively. (b) The calculated effective group index ng (real and
imaginary parts) of the Fano structure based on the data of (a). (c) The retrieved results of permittivity ε (real and imaginary parts) for the Fano structure and the wires structure. (d) The retrieved results of permittivity μ (real and imaginary parts) for the Fano structure and the wires structure.
One of the applications of the sharp Fano resonance is to obtain slow light. Therefore it is of interest to calculate the effective index (n) of the Fano structure. It is valid to assign effective parameters to the Fano structure since the periodicity of the Fano structure is 40 μm that is only one seventh of the operation wavelength. Actually, in the research field of metamaterials, the continuous metallic wires structure is usually used to obtain negative permittivity, and the SRR structure is usually used to obtain negative permeability when the incident wave is along the plane of SRR and the electric field is polarized parallel to the plane of SRRs [48]. However, here the propagation direction of the incident wave is normal to the plane of SRRs. In this case, one cannot obtain negative permeability although the inductance-capacitance (LC) resonance mode of the SRRs can still be excited [44]. In order to calculate the effective index, we have obtained the reflection and transmission data including both the magnitudes and phase information. Then we use the retrieval method reported in previous works to retrieve the effective parameters [44,48,49]. During the retrieval process, the effective thickness of the Fano structure is set to be 200 nm, which is the thickness of the gold layer. Figure 5(a) shows the retrieved effective index (n) including both real and imaginary parts for the Fano structure. It is seen that around the frequency of 1.1 THz, the real part the effective indices are positive. At the frequency of 1.07 THz, the imaginary part of the effective index is the least. Based on the data of effective index, we have calculated the effective group index (ng) for the Fano structure as shown in Fig. 5(b). It is seen that the group index shows large values in the resonant frequency range which may be used for the application of slow light. To get a good performance of the slow light, one should choose the
frequency point of zero imaginary part of ng [50]. Around the frequency of 1.05 THz, the imaginary parts of ng are nearly zero, while the real parts of ng are more than 800. This means that at the frequency of 1.05 THz, an incident electromagnetic wave pulse will propagate through the 200 nm thick Fano structure at a speed 800 times slower than it propagates in vacuum.
In Fig. 5(a), the real part of n for the Fano structure is negative over a large spectral range except for the resonant frequency range, and this may seem unreasonable at the first glance. Furthermore, considering the absorption curve in Fig. 3(a), the imaginary part of n for the Fano structure does not show a traditional resonant peak as one might expect intuitively. In order to explain these phenomena, we have done more retrieval works for the Fano structure as well as the wires structure. The effective refractive index n for the wires structure is also shown in Fig. 5(a). It is clearly seen that the real part of n for the wires structure is negative in the whole frequency range. The n (including the real and imaginary parts) of the wires structure shows similar features as the n of the Fano structure except for the frequency range of resonance. Figures 5(c) and 5(d) show the corresponding effective parameters of permittivity (ε) and permeability (μ) for the Fano structure and the wires structure, respectively. The parameter ε of the wires structure shows a typical shape of Drude model with loss. The parameter ε of the Fano structure can be seen as the summation of the lineshapes of Drude model and Lorentz model. Therefore, the results of ε for both the wires structure and the Fano structure are reasonable and easy to understand. However, the results of μ in Fig. 5(d) show “unusual” features. The real part of μ is less than 1, and the imaginary part of μ is larger than 0. Actually, it was pointed out several decades ago that this kind of diamagnetic response can happen when a metallic body is subjected to a high frequency magnetic field owning to the generation of eddy currents within the skin depth [51]. Diamagnetic response was also achieved in metallic photonic crystals [52]. For a metamaterial with effective permittivityε ε= +' iε'', and permeabilityμ μ= +' iμ'', a possible (not the only) way to achieving a negative refractive index is to satisfy the equation
' ' 0
ε μ μ ε+ < [53]. Thus, a negative real part of the refractive index n= εμ can be obtained. For the wires structure and the Fano structure studied here, the above equation is satisfied in a wide frequency range. Consequently, the real part of the n of the wires structure and the Fano structure is negative in the corresponding frequency range. Furthermore, the imaginary part of the n of the Fano structure does not represent the absorption behavior of the Fano structure. Instead, the absorption behavior is closely related to the imaginary part of the effective parameter of ε.
3. Experiment results and discussions
Based on the design of Fig. 1(a), we have fabricated the Fano structures (with S = 3 μm and 5 μm) on a 0.38 mm thick quartz substrate using photolithography and lift-off. The gold layer has a thickness of 200 nm. The whole sizes of the samples are 1 cm by 1 cm. Two optical microscope images of the samples are shown in Fig. 6.
Fig. 6. The fabricated Fano structures with slit width (a) S = 3 μm, and (b) S = 5 μm.
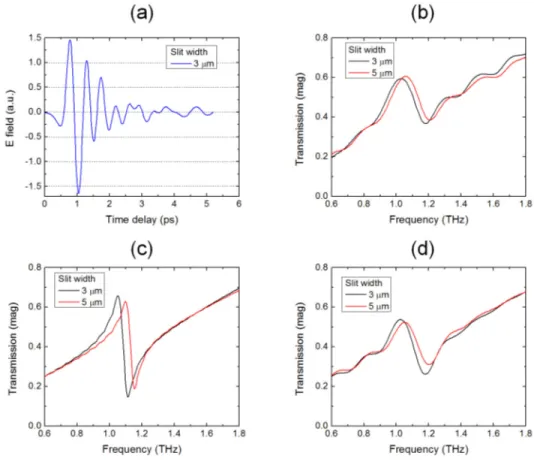
Fig. 7. (a) A typical time domain signal in the measurement truncated at 5.2 ps for the Fano structure with slit width S = 3 μm. (b) The transmission spectra of experimental results for two Fano structures with slit width S = 3 μm and 5 μm. (c) The transmission spectra of simulation results with the time domain signal truncated at 20 ps. (d) The transmission spectra of simulation results with the time domain signal truncated at 5.2 ps.
For the experimental study of the metamaterial samples, a powerful THz time-domain spectroscopic system was used. An amplified kHz repetition rate Ti:Sapphire laser system delivering 35 fs pulses at 800 nm central wavelength and maximum energy of 2.3 mJ/pulse
was used. Part of the initial beam, with energy equal to 1.3 mJ/pulse, was focused in ambient air after partial frequency doubling in a beta-barium-borate (BBO) crystal (50 μm thick) to produce a two-color filament and subsequently, THz radiation [54]. For the detection of the emitted THz radiation, a time resolved electro-optic sampling method was used where a small part of the initial laser pulse probes the THz-induced birefringence in an electro-optic crystal (1 mm thick ZnTe crystal). By varying the time delay between the probe and the THz beam, the time profile of the THz electric field of the THz pulse was recorded. The frequency profile of the THz electric field was obtained by Fourier transform of the time profile. The frequency dependent amplitudes T(ω) of the transmitted THz pulse through the samples were normalized by dividing the sample spectra by the reference spectrum, T(ω) = Esample(ω)/Eref(ω), where the reference spectrum was the recorded spectrum of the bare quartz substrate. The whole experimental setup was enclosed in a purge gas chamber to avoid water vapor absorption of the THz radiation and all measurements were performed at low levels of humidity.
In order to avoid the Fabry-Perot echoes from the back and front surfaces of the substrate [16], the time domain signals of the measurements are truncated at 5.2 ps according to the thickness of the of quartz substrate. Figure 7(a) shows a typical time domain signal in the measurement truncated at 5.2 ps for the Fano structure with slit width S = 3 μm. It can be seen clearly that at 5.2 ps, the oscillations of the signal has not dumped out. Therefore after the truncation the spectra will show less sharp resonant features compared to the simulation results [16]. Figure 7(b) shows the transmission spectra of the measured results for two Fano structures with S = 3 μm, and 5 μm, respectively. It is seen that the resonant lineshape of the measurement results is not as sharp as the simulation results in Fig. 2 due to the limited time window of the measurement. In order to further illustrate the effect of the truncation of time domain signals, we have carried out time domain simulations for the two Fano structures. The simulation setup is similar to that used in the frequency domain simulation. We firstly obtain the time domain signals, then Fourier transform the time domain signals with different truncations to get the transmission spectra in frequency domain. Figures 7(c) and 7(d) shows the two transmission spectra for the time domain signal truncated at 20 ps and 5.2 ps, respectively. It is shown that the results in Fig. 7(c) are very close to the designed results shown in Fig. 2, while the simulation results in Fig. 7(d) shows less sharp Fano resonances very similar to the measured results of Fig. 7(b). The discrepancy between the experiment results of Fig. 7(b) and the simulation results of Fig. 7(d) might mainly come from two aspects. One aspect is that the fabricated structure is not exactly the same as the designed one. The dimensions of the fabricated structures are not uniform but have a random distribution. The other aspect is that the dielectric constant of the metal gold in the simulation may not exactly match that of the gold film in the experiment. Consequently, the results of experiments and simulations are not in perfect agreement. In summary, Fano resonances around 1 THz have been experimentally obtained which match the simulation results and the Fano resonance can be tuned by changing the slit width of the SRR structures.
One interesting question may be whether it is possible to retrieve the effective parameters from the experimental data. Theoretically, if the magnitude and phase information of the reflection and transmission can be obtained accurately in the experiment, the effective parameters of the samples can be readily retrieved according to the appropriate retrieval algorithm [44,48,49]. However, this requires more sophisticated experimental configurations that may be studied in the future.
4. Conclusions
In conclusion, we have studied Fano resonances in terahertz metamaterials that are constructed by combining SRRs to continuous wires structures. The asymmetric Fano lineshape of the transmission spectrum comes from the coupling and interference between the nonresonant background transmission continuum of the continuous wires structure and the resonant scattering of the bright mode of the SRRs. By using a TLLE model, the underlying mechanism of Fano resonance has been analyzed in detail. The reason for the frequency shift
of Fano resonance compared to the original SRR resonance is revealed quantitatively with the aid of TLLE model. Since the parameters in the TLLE model correspond directly to the physical properties of plasmonic structures, we hope that it can play more important roles in future design of Fano resonance structures and EIT structures. We also retrieved the effective parameters of refractive index and group index for the Fano structure. A large group index of more than 800 is obtained which shows potential applications for slow light devices.
Acknowledgments
This work is supported by the projects DPT-HAMIT, ESF-EPIGRAT, NATO-SET-181 and TUBITAK under Project Nos., 107A004, 109A015, 109E301. Financial support was also provided by the Aristeia project “FTERA” (grant no 2570) co-financed by the EU and Greek National Funds and the EU project “Laserlab Europe”. The author E.O. acknowledges partial support from the Turkish Academy of Sciences. The author X.Y. acknowledges partially support from the University of Missouri Interdisciplinary Intercampus Research Program. The authors acknowledge J. Gao for helpful discussions about this work.