BIOACTIVE PEPTIDE NANOFIBERS FOR
BONE TISSUE REGENERATION
A DISSERTATION SUBMITTED TO
THE GRADUATE SCHOOL OF ENGINEERING AND SCIENCE OF BILKENT UNIVERSITY
IN PARTIAL FULFILLMENT OF THE REQUIREMENTS FOR THE DEGREE OF
DOCTOR OF PHILOSOPHY IN
MATERIALS SCIENCE AND NANOTECHNOLOGY
By
GÜLİSTAN TANSIK June 2017
ii
BIOACTIVE PEPTIDE NANOFIBERS FOR BONE TISSUE REGENERATION By Gülistan Tansık
June 2017
We certify that we have read this dissertation and that in our opinion it is fully adequate, in scope and in quality, as a dissertation for the degree of Doctor of Philosophy.
Ayşe Begüm Tekinay (Advisor)
Mustafa Özgür Güler (Co-advisor)
Çağdaş Devrim Son
Aykutlu Dana
Tamer Uyar
Ufuk Gündüz
Approved for the Graduate School of Engineering and Science:
Ezhan Karaşan
iii ABSTRACT
BIOACTIVE PEPTIDE NANOFIBERS FOR BONE TISSUE REGENERATION
Gülistan Tansık
Ph.D. in Materials Science and Nanotechnology Advisor: Ayşe Begüm Tekinay
Co-Advisor: Mustafa Özgür Güler June, 2017
Replacement and repair of bone tissue that is lost due to fractures, tumor resection, degenerative diseases and infections still remain major clinical challenges. Autografting, allografting and xenografting are the current strategies for the treatment of bone defects. However, these strategies cause problems such as immunological response and disease transmission in clinical applications. To overcome these limitations, regeneration of new bone can be induced by the use of synthetic bioactive materials. One of the most promising strategies is to develop synthetic scaffolds mimicking the functional components of the extracellular matrix (ECM).
Biomineralization is mineralization carried out by living organisms. Glycosaminoglycans have crucial roles in biomineralization and enhance the functions of growth factors involved in biomineralization. Success in bone regeneration studies requires a thorough understanding of the necessary conditions for triggering biomineralization during the bone tissue formation process. In this study, the effect of bioactive and biocompatible peptide nanofibers on osteogenic differentiation,
iv
biomineralization and bone tissue regeneration are investigated under in vitro and in vivo conditions. In the first chapter, bone tissue composition, the clinical need for bone regeneration and general principles in bone tissue engineering are discussed. Bone tissue regeneration strategies are also highlighted in this part, with emphasis on peptide amphiphiles and self-assembly behavior. In the second chapter, a fully synthetic, extracellular matrix-mimetic peptide nanofiber system is described for enhancing the biomineralization and regeneration of bone tissue. This nanostructural environment forms artificial intracellular networks and supports biomineralization by providing cell-material and protein-material interactions. In the third chapter, effect of osteoinductive peptide nanofibers on osteogenic differentiation of rat mesenchymal stem cells (MSCs) were investigated. In the fourth chapter, the natural biomineralization process in bone tissue was mimicked on peptide nanofibers and the effect of this system on the osteogenic differentiation of osteoblast-like cells was investigated. In the fifth chapter, a dentin-mimetic peptide amphiphile (SpDSp-PA) molecule that is capable of emulating the structure and function of dentin phosphoprotein was designed and its capacity to support the deposition of hydroxyapatite and survival and biomineralization of osteoblast-like cells was evaluated.
Keywords: Bone regeneration, biomineralization, peptide amphiphiles, mesenchymal stem cell, extracellular matrix
v ÖZET
BİYOAKTİF PEPTİT NANOFİBERLERİN KEMİK REJENERASYONU İÇİN KULLANILMASI
Gülistan Tansık
Malzeme Bilimi ve Nanoteknoloji, Doktora Tez Danışmanı: Ayşe Begüm Tekinay Tez Eşdanışmanı: Mustafa Özgür Güler
Haziran, 2017
Günümüzde kemik hastalıklarında, kırıklarda, enfeksiyonlarda veya tümorlü dokuların cerrahi olarak alınmasından sonra oluşan boşluklarda, kemik doku rejenerasyonunun ve tamirinin sağlanmasında klinik aşamada zorluklar yaşanmaktadır. Kemik hasarlarının tedavisinde allograft, otograft ya da xenograft kaynaklı yapıları kullanmak güncel tedavi yöntemleridir. Ancak, bu yapıların kullanılması immunolojik reaksiyonlara ya da hastalık bulaşmasına sebep olabilmektedir. Yeni sentetik biyomalzemelerin kemik doku hasarlarının rejenerasyonu amaçlı kullanılması ile bu sorunlar ortadan kaldırılabilir. Bu bağlamda, hücrelerin ekstraselüler matris yapısının fonksiyonel yapıları taklit edilerek hazırlanan sentetik iskelelerin kullanılması etkili bir tedavi yaklaşımı vadetmektedir. Biyomineralizasyon, canlı organizmaların gerçekleştirdiği mineralizasyon işlemidir. Glikozaminoglikanlarin biyomineralizasyonda da önemli olduğu ve biyomineralizasyonda görevli büyüme faktörlerinin işlevini arttırdığı bilinmektedir. Kemik doku oluşumu sürecinde biyomineralizasyonun tetiklenmesi için gerekli koşulların çalışılması kemik doku
vi
yenilenmesi uygulamalarının başarısı için önemlidir. Bu tez çalışmasında, sentetik biyoaktif peptit nanofiberlerden oluşan yapay hücrelerarası iskelelerin osteojenik farklılaşmaya, biyomineralizasyona ve kemik rejenerasyonuna olan etkileri in vitro ve in vivo koşullarda incelenmiştir. İlk kısımda, kemik dokusunun yapısı, kemik rejenerasyonu gerektiren klinik vakalar ve kemik doku mühendisliğinin prensipleri hakkında bilgi verilmiştir. Ayrıca, kemik rejenerasyonu stratejilerinden bahsedilerek, peptit amfifil molekülleri ve kendiliğinden bir araya toplanma özellikleri üzerinde durulmuştur. İkinci kısımda, kemik doku oluşumunda biyomineralizasyonun biyomimetik malzemeler kullanılarak hızlandırılması hedeflenmiştir. Bu amaçla peptit nanofiberlerden oluşan, hücrelerarası matrisi taklit eden sentetik malzemeler kullanılmıştır. Bu nanoyapılardan oluşan ortam, yapay hücrelerarası yapıyı oluşturmuş ve hem malzeme-hücre hem de malzeme-protein etkileşimleri sağlayarak biyomineralizasyon mekanizmasına destek olmuştur. Üçüncü kısımda, osteoindüktif peptit amfifil nanoyapılar üzerindeki kök hücrelerin osteojenik farklılaşması araştırılmıştır. Bu kapsamda, peptit nanofiberler üzerinde kemik hücresine doğru farklılaşan mezenkimal kök hücrelerin belirli zamanlardaki osteojenik farklılaşması incelenmiştir. Dördüncü bölümde, kemik dokusunun doğal ortamında görülen biyomineralizasyon mekanizması sentetik peptit nanofiberler üzerinde taklit edilmiş ve bu sistemin osteoblast benzeri hücrelerin osteojenik farklılaşması üzerindeki etkileri incelenmiştir. Beşinci kısımda, dentin fosfoprotein yapısını ve fonksiyonunu taklit etmesi amacıyla dentin mimetik peptit amfifil molekülü (SpDSp-PA) tasarlanmıştır. Ayrıca, bu sistemin hidroksiapatit birikimi ve osteoblast benzeri hücrelerin biyomineralizasyon kapasiteleri üzerindeki etkileri incelenmiştir.
vii
Anahtar kelimeler: Kemik rejenerasyonu, biyomineralizasyon, peptit amfifil, mezenkimal kök hücre, hücrelerarası iskele
viii
Acknowledgement
I would like to express my deepest appreciation to my thesis advisors Prof. Ayşe Begüm Tekinay and Prof. Mustafa Özgür Güler for their scientific knowledge, guidance, encouragement and support throughout my PhD thesis studies. I would like to thank Prof. Aykutlu Dana for his scientific support during my studies. I would also like to acknowledge my jury members for their contributions to my thesis.
I would like to express my special thanks to Dr. Gulcihan Gulseren, Mustafa Beter, Ahmet Emin Topal and Egemen Deniz Eren for their fruitful collaboration.
I would like to acknowledge my previous and present lab and office members Dr. Hakan Ceylan, Melike Sever, Nuray Gündüz, Dr. Melis Şardan, Dr. Göksu Çınar, Aygül Zengin, Meryem Hatip, Dr. Büşra Mammadov, Dr. Ruslan Garifullin, Dr. M. Aref Khalily, Nurcan Haştar, İdil Uyan, Dr. Rashad Mammadov, Dr. Özlem Erol, Dr. Ashif Shaikh, Dr. Handan Acar, Dr. Aslı Çelebioğlu, Dr. Ayşe Özdemir, Özüm Şehnaz Günel, Ceren Garip Yaşa, Hatice Kübra Kara, Çağla Eren, Öncay Yaşa, Hepi Hari Susapto, Şehmus Tohumeken, Zeynep Orhan, İbrahim Çelik, Gökhan Günay, Seren Hamsici, Merve Şen, Canelif Yılmaz, Fatih Yergöz, Oğuz Tuncay, Burak Demircan, Dr. Zeynep Aytaç, Dr.Yelda Ertaş, Dr. Aydan Yeltik, Göksemin Fatma Şengül and Tuğçe Önür, for creating such a warm working environment. I would like to thank Alper Devrim Özkan for reading my thesis and suggesting corrections.
I would like to thank Mrs. Zeynep Erdoğan for her technical contribution to my thesis. I also thank to Suna Temiz who has always given me positive energy with her cheerful laughs.
ix
I would like to acknowledge The Scientific and Technological Research Council of Turkey (TÜBİTAK BIDEB-2211C, 112T042 and 113S552) for funding my PhD research.
I would like to thank Mustafa Beter, Özge Uysal and Begüm Dikeçoğlu for their warm personality and good friendship. I am thankful to my dearest friends Dr. Berna Şentürk, Dr. Gülcihan Gülseren, Elif Arslan, Melis Göktaş, Yasin Tümtaş and Didem Mumcuoğlu. I enjoyed my time in UNAM with their worthy friendship. I would like to extend my special thanks to Burcu Özsoy and Canan Kurşungöz, who are always with me during those years.
My sincere thanks also goes to my special tangueras and tanguero; Ayşegül Hacısalihoğlu, Hıdır Askar, Mevlüde Tigel, Selen Berk, Gizem Altunok, Vildan Şener for all the fun we have had during the milongas and especially Dr. Aysel Kızıltay for her invaluable support during the period of thesis writing.
I am deeply grateful to Zeynep Aybaş Kavalcı and my aunt Suheyla Demirel for their love and support during my studies.
I would like to express my most sincere gratitude to my family, my mother Cahide Tansık and my super-brother Ali Erdem Tansık for their endless love, motivation and encouragement. I would not be where I am today without their help and support. Last but not least, I would like to express my most heartfelt thanks to my father for his love, care, support, motivation and unquestionable belief in me during his life. I dedicate this thesis to my beloved father, Mehmet Tansık.
x
Contents
ABSTRACT ... iii
ÖZET... v
Acknowledgement... viii
List of Figures ... xvii
List of Tables... xxvii
Abbreviations ... xxviii
Chapter 1 ... 1
1. Introduction ... 1
1.1 Bone Tissue ... 1
1.1.1 Hierarchical Structure of Bone... 1
1.1.2 Bone Cells ... 2
1.1.2.1 Osteoblasts ... 4
1.1.2.2 Osteocytes ... 4
1.1.2.3 Osteoclasts ... 5
1.1.3 Bone Extracellular Matrix ... 6
1.1.3.1 Bone Matrix Proteins ... 6
1.1.3.2 Glycosaminoglycans (GAGs) in Bone Tissue ... 8
1.1.3.3 Growth Factors ... 10
1.1.4 Bone Matrix Mineralization ... 12
1.1.5 Bone Formation ... 15
1.1.5.1 Intramembranous (Mesenchymal) Ossification ... 15
1.1.5.2 Intracartilaginous (Endochondral) Ossification ... 15
xi
1.1.7 General Principles in Bone Tissue Engineering... 16
1.1.8 Bone Tissue Regeneration Strategies ... 17
1.1.8.1 Biomaterials for Bone Repair ... 19
1.1.8.2 Polymers ... 19
1.1.8.3 Ceramics ... 21
1.1.8.4 Metals ... 21
1.1.8.5 Composites ... 22
1.1.8.6 Peptide Based Scaffolds ... 22
1.1.8.6.1 Peptide Amphiphiles ... 23
Chapter 2 ... 27
2. Bone Regeneration Through Induction of Biomineralization by Glycosaminoglycan Mimetic Peptide Nanofiber Gel ... 27
2.1 Introduction ... 27
2.2 Experimental Section ... 29
2.2.1 Materials ... 29
2.2.2 Synthesis of Peptide Amphiphile (PA) Molecules... 31
2.2.3 Scanning Electron Microscope (SEM) Imaging of PA Nanofiber Networks ... 32
2.2.4 Circular Dichroism (CD) ... 33
2.2.5 Fourier Transform Infrared (FT-IR) Spectroscopy ... 33
2.2.6 Cell Culture and Maintenance ... 33
2.2.7 Tissue Culture Plate Coating ... 34
2.2.8 Viability Assay ... 34
xii
2.2.10 SEM Imaging of rMSCs on PA Nanofiber Coated Surfaces ... 35
2.2.11 Alkaline Phosphatase (ALP) Activity Assay ... 36
2.2.12 Detection of Mineralization by Alizarin Red Staining ... 36
2.2.13 Gene Expression Analysis... 37
2.2.14 In Vivo Experiments ... 38
2.2.14.1 Surgical Procedure ... 38
2.2.14.2 Micro Computed Tomography (Micro-CT) Analysis ... 39
2.2.14.3 Histological Analysis ... 40
2.2.15 Statistical Analysis ... 40
2.3 Results and Discussion ... 41
2.3.1 Characterization of Peptide Amphiphile (PA) Molecules and Self-Assembled PA Nanofibers ... 41
2.3.2 Cell Behavior and Viability on PA nanofibers ... 48
2.3.3 Alkaline Phosphatase Activity and Mineralization on Bioactive Peptide Nanofibers ... 53
2.3.4 Gene Expression Profiles of Osteogenic Markers ... 56
2.3.5 In Vivo Bone Regeneration Model ... 60
2.3.5.1 Quantification of Bone Formation by Micro-CT ... 60
2.3.5.2 Histological Evaluation of Regenerated Bone ... 64
2.4 Conclusion ... 69
Chapter 3 ... 70
3. Osteoinductive Peptide Nanofibers Induce Osteogenic Differentiation of Rat Mesenchymal Stem Cells ... 70
xiii
3.2 Experimental Section ... 70
3.2.1 Materials ... 70
3.2.2 Synthesis of PA Molecules ... 71
3.2.3 Formation of Self-Assembled PA Nanofibers ... 72
3.2.4 Characterizations of Self-Assembled PA Nanofibers ... 72
3.2.4.1 Circular Dichroism (CD)... 72
3.2.4.2 Scanning Electron Microscopy (SEM) Imaging ... 73
3.2.5 Cell Culture and Maintenance ... 73
3.2.6 Viability Assay ... 74
3.2.7 Actin Staining of rMSCs on PA Nanofiber-Coated Surfaces ... 74
3.2.8 Alkaline Phosphatase (ALP) Activity Assay ... 75
3.2.9 Gene Expression Analysis ... 75
3.2.10 Detection of Mineralization by Alizarin Red Staining ... 77
3.2.11 Statistical Analysis ... 77
3.3 Results and Discussion ... 78
3.3.1 Characterization of Peptide Amphiphile (PA) Molecules and Self-Assembled PA Nanofibers ... 78
3.3.2 Cell Behavior and Viability on PA Nanofibers ... 82
3.3.3 Molecular Analysis of Osteogenic Differentiation Markers ... 83
3.3.4 Mineralization on Bioactive Peptide Nanofibers ... 87
3.4 Conclusion ... 90
Chapter 4 ... 91
4. Mineralized Peptide Nanofiber Gels for the Promotion of Osteogenic Differentiation ... 91
xiv
4.1 Introduction ... 91
4.2 Experimental Section ... 93
4.2.1 Materials ... 93
4.2.2 Synthesis and Characterization of Peptide Amphiphiles (PAs) ... 93
4.2.3 Preparation of Mineralized Hydrogels ... 94
4.2.4 Transmission Electron Microscopy (TEM) ... 94
4.2.5 X-Ray Diffraction (XRD) Analysis ... 94
4.2.6 Oscillatory Rheology ... 95
4.2.7 Cell Culture and Maintenance ... 95
4.2.8 Viability Assay ... 96
4.2.9 Actin Staining of Saos-2 Cells on Mineralized PA Nanofibers ... 96
4.2.10 Cell Adhesion Assay ... 97
4.2.11 Cell Proliferation Assay ... 97
4.2.12 Alkaline Phosphatase (ALP) Activity Assay ... 98
4.2.13 Gene Expression Analysis... 99
4.3 Results and Discussion ... 100
4.3.1 Peptide Synthesis and Characterization ... 100
4.3.2 Morphology of Mineralized PA Nanofibers ... 102
4.3.3 Characterization of Mineral Type on Mineralized PA Nanofibers ... 102
4.3.4 Mechanical Properties of Mineralized PA Nanofibers ... 105
4.3.5 Cell Viability and Behavior on Mineralized PA Nanofibers ... 105
4.3.6 Alkaline Phosphatase Activity (ALP) Assay ... 109
4.3.7 Gene Expression Profiles of Cells on Mineralized PA Nanofibers .... 111
xv
Chapter 5 ... 117
5. Dentin Phosphoprotein (DPP)-Mimetic Peptide Nanofibers Promote Biomineralization ... 117
5.1 Introduction ... 117
5.2 Experimental Section ... 120
5.2.1 Materials ... 120
5.2.2 Synthesis of Peptide Amphiphile (PA) Molecules... 120
5.2.3 Circular Dichroism (CD) of DPP-Mimetic PAs ... 121
5.2.4 Oscillatory Rheology Measurements of DPP-Mimetic PAs ... 121
5.2.5 Transmission Electron Microscopy (TEM) Imaging of DPP-mimetic PAs ... 122
5.2.6 Mineralization of DPP-Mimetic Nanonetworks in Simulated Body Fluid ... 122
5.2.7 Cell Culture and Maintenance ... 122
5.2.8 Viability of Saos-2 Cells on PA Networks ... 123
5.2.9 Immunocytochemistry (ICC) ... 124
5.2.10 Gene Expression Analysis... 124
5.3 Results and Discussion ... 125
5.3.1 Design and Characterization of DPP-Mimetic Peptide Amphiphile Molecules ... 125
5.3.2 Mineral Deposition Capacity of DPP-Mimetic PAs under Ionic Self-Assembly ... 130
5.3.3 Viability of Saos-2 Cells on DPP-Mimetic PA networks ... 135
xvi
5.3.5 Mineral Deposition of Saos-2 Cells on DPP-Mimetic PA networks .. 143
5.4 Conclusion ... 146
Chapter 6 ... 147
6. Conclusion and Future Prospects ... 147
Bibliography ... 151
xvii
List of Figures
Figure 1.1 Hierarchical structural organization of bone. (Reproduced from Ref. 4 with permission from Elsevier Publishing Group) ... 3 Figure 1.2 a) Bone homeostasis is achieved by osteoclasts (which are responsible for bone resorption) and osteoblasts (which are responsible for bone formation). b) Osteoblasts can differentiate from mesenchymal progenitors through two processes, intramembranous or endochondral ossification. (Adapted from Ref. 10 with permission from Nature Publishing Group) ... 5 Figure 1.3 The extracellular matrix (ECM) of bone. (Adapted from Ref. 19 with permission from John Wiley and Sons Publishing Group) ... 7 Figure 1.4 Repeating disaccharide units and possible sulfation positions of glycosaminoglycan chains. (Adapted from Ref. 35 with permission from Elsevier Publishing Group). ... 11 Figure 1.5 Structure of a representative PA. (Adapted from Ref. 107 with permission from John Wiley and Sons Publishing Group) ... 24 Figure 2.1 Schematic representation of the rabbit tibia bone tissue regeneration model. ... 30 Figure 2.2 Chemical structures of the PA molecules ... 42 Figure 2.3 Liquid chromatogram and mass spectrum of GAG-PA. (A) RP-HPLC chromatogram of GAG-PA, the change of response units with respect to time at 220 nm. (B) Mass spectrometry of GAG-PA. [M-H]- (calculated): 1225.59, [M-H] -(observed): 1224.66, [M-2H]-2/2 (calculated): 611.79, [M-2H]-2/2 (observed): 611.83, [M-3H]-3/3 (calculated): 407.53, [M-3H]-3/3 (observed): 407.55. ... 44
xviii
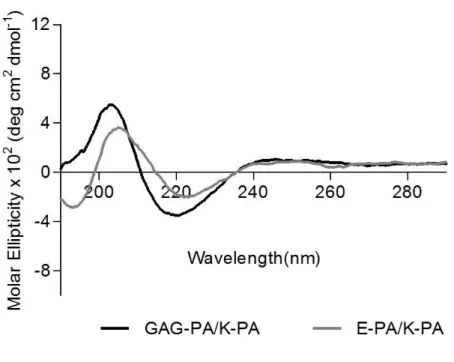
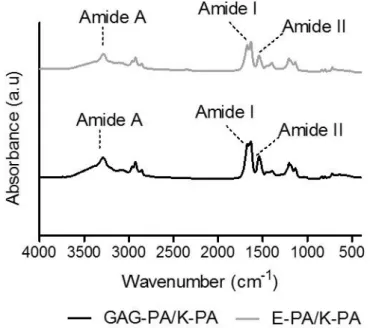
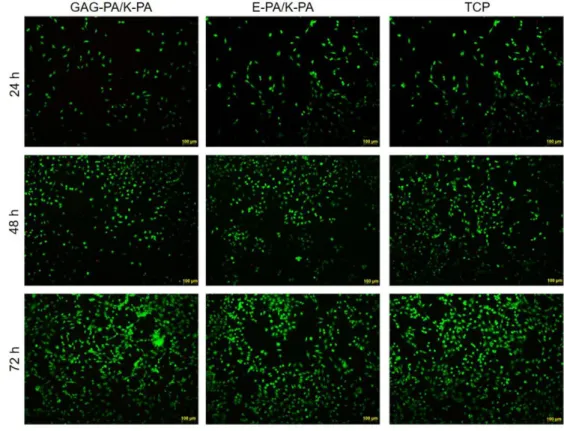
Figure 2.4 Liquid chromatogram and mass spectrum of E-PA. A) RP-HPLC chromatogram of E-PA, the change of response units with respect to time at 220 nm. (B) Mass spectrometry of E-PA. [M-H]- (calculated): 655.42, [M-H]- (observed): 654.45, [M-2H]-2/2 (calculated): 326.71, [M-2H]-2/2 (observed): 326.72. ... 45 Figure 2.5 Liquid chromatogram and mass spectrum of K-PA. (A) RP-HPLC chromatogram of K-PA, the change of response units with respect to time at 220 nm. (B) Mass spectrometry of K-PA. [M+H]+ (calculated):653.48, [M+H]+(observed): 654.47, [2M+H]+(calculated): 1307.96, [2M+H]+ (observed): 1307.93, [M+2H]+2/2 (calculated): 327.74, [M+2H]+2/2 (observed): 327.73. ... 46 Figure 2.6 SEM images show the nanofibrous network. ... 47 Figure 2.7 Circular dichroism spectra of the PA samples, demonstrating a predominance of β-sheet in the PA nanofibers. ... 47 Figure 2.8 FTIR spectra of PA nanofibers. Both peptides displayed amide I peaks located in 1630–1640 cm− 1 region, suggesting β-sheet formation. ... 48 Figure 2.9 Viability of rMSCs cultured on peptide nanofibers and TCP, analyzed by calcein/ethidium homodimer live−dead assay. ... 49 Figure 2.10 Viability of rMSCs cultured on peptide nanofibers and uncoated surface (TCP), analyzed by calcein ethidium homodimer live−dead assay. ... 49 Figure 2.11 Morphology of rMSCs on PA nanofibers and TCP after 3 days of incubation. Actin filaments stained with phalloidin (green) and nuclei stained with TO-PRO-3 (blue) (A, C, and E). Scale bars are 20 μm. SEM images of rMSCs on PA nanofibers and TCP (B, D, and F). Scale bars are 5 μm. ... 50
xix
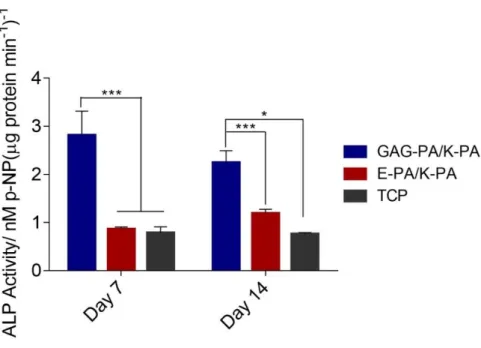
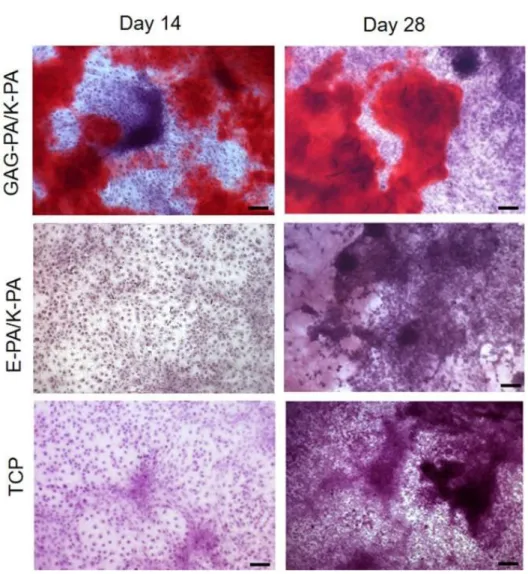
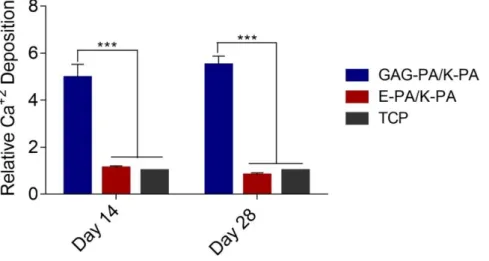
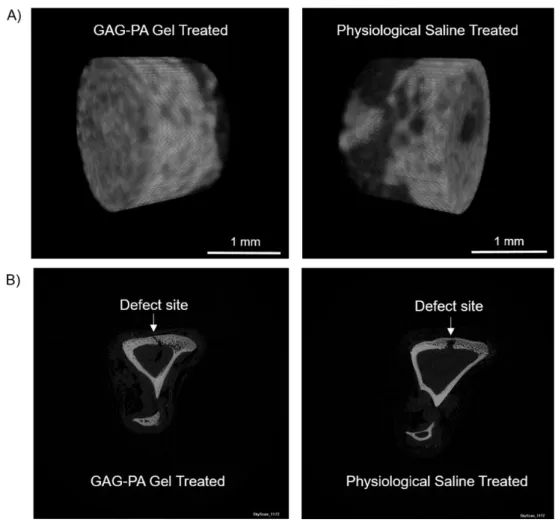
Figure 2.12 F-Actin filaments stained with phalloidin (green) showing actin networks formed by rMSCs on PA nanofibers and TCP. Nuclei were stained with TO-PRO-3 reagent (blue). Scale bars are 20 μm. ... 51 Figure 2.13 SEM images of rMSCs cultured on GAG-PA/K-PA, E-PA/K-PA nanofibers and TCP at 14 days after cell seeding. Scale bars are 40 μm. ... 52 Figure 2.14 Impact of GAG mimetic peptide nanofibers on alkaline phosphatase activity on days 7 and 14, *p < 0.05, ***p < 0.001. ... 54 Figure 2.15 Biomineralization on peptide nanofibers and TCP on days 14 and 28 as demonstrated by Alizarin red staining. Scale bars are100 µm. ... 55 Figure 2.16 Quantification of relative calcium deposition on peptide nanofibers and TCP on days 14 and 28, ***p < 0.001. ... 56 Figure 2.17 Gene expression analysis of Runx2, collagen-I, and osteopontin on days 7 and 14. Expression level of each gene was normalized against TCP and GAPDH was used as internal control, *p < 0.05, **p < 0.01. ... 57 Figure 2.18 Representative Micro-CT images after 4 weeks of GAG-PA gel treatment. A) Three-dimensional reconstruction images of one voxel of interest showing newly formed bone (Grey color: the newly formed bone, black color: total defect volume). B) Nrecon images showing defect site. ... 61 Figure 2.19 Newly formed cortical bone analysis at the defect site of rabbit tibia after 4 weeks of GAG-PA gel treatment. (A) BV/TV (%). (B) BMD of cortical bone, *p < 0.05. ... 62 Figure 2.20 Histological evaluation of rabbit tibial defects after 4 weeks of hydrogel treatment. Tissue sections of GAG-PA gel and physiological saline control groups
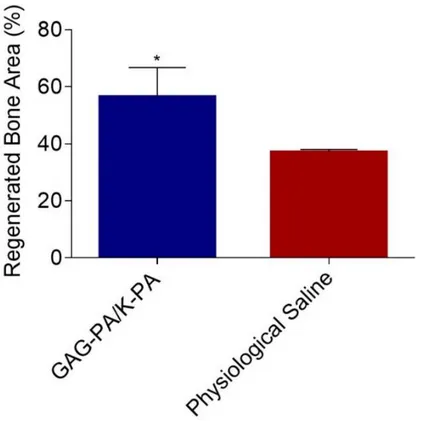
xx
were stained with H&E, scale bars are 100 µm. (CB: Cortical bone, W: Woven bone, L: Lamellar bone, BV: Blood vessel). ... 65 Figure 2.21 Regenerated bone areas were quantified through the histological evaluation of H&E results (G), *p < 0.05. ... 66 Figure 2.22 Histological evaluation of a tibial defect model after 4 weeks of GAG-PA gel treatment. Tissue sections of GAG-PA gel treated and physiological saline sham groups were stained with H&E (A, B) (Black lines show regenerated area). Deposition of bone matrix was confirmed by positive staining of collagen with Masson’s trichrome staining (C, D). Endochondral ossification was observed by Alcian blue staining (E, F). Scale bars are 200 µm. ... 67 Figure 3.1 Chemical representations of Lauryl-VVAGEEE (E3-PA), and
Lauryl-VVAGKKK-Am (K3-PA). ... 78
Figure 3.2 RP-HPLC chromatogram of E3-PA, the change of response units with
respect to time at 220 nm. ... 79 Figure 3.3 [M-H]- (calculated): 912.50, [M-H]- (observed): 912.35; [M/2-H] -(calculated): 455.75, [M/2-H]- (observed): 455.64; [M/3+H]+ (calculated): 303.16, [M/3+H]+ (observed): 303.41... 79 Figure 3.4 RP-HPLC chromatogram of K3-PA, the change of response units with
respect to time at 220 nm. ... 80 Figure 3.5 [M+H]+ (calculated): 910.67, [M+H]+ (observed): 910.67; [M/2+H]+ (calculated): 455.83, [M/2+H]+ (observed): 455.83; [M/3+H]+ (calculated): 304.22,
[M/3+H]+ (observed): 304.22; [2M+2H]+2 (calculated): 1821.34, [2M+2H]+2 (observed): 1821.35... 80 Figure 3.6 SEM image of E3/K3-PA nanofibers. Scale bar is 2 µm. ... 81
xxi
Figure 3.7 Circular dichroism (CD) spectroscopy characterization of peptide amphiphile molecules (E3-PA and K3-PA) and nanofibrous peptide assemblies (E3/K3
-PA). ... 81
Figure 3.8 Viability of rMSCs cultured on PA coated, gelatin coated and uncoated surface (TCP), as analyzed by calcein-ethidium homodimer live−dead assay. Scale bars are 100 μm. ... 82
Figure 3.9 F-actin filaments stained with phalloidin (green), showing actin networks formed by rMSCs on PA nanofibers, gelatin-coated and bare TCP. Nuclei were stained with TO-PRO-3 reagent (blue). Scale bars are 20 μm. ... 83
Figure 3.10 Effect of E3/K3-PA nanofibers on ALP activity of rMSCs on days 3, 7 and 14 of osteogenic differentiation. ... 84
Figure 3.11 Gene expression analysis of Runx2 on days 3, 7 and 14. ... 85
Figure 3.12 Gene expression analysis of collagen I on days 3, 7 and 14... 86
Figure 3.13 Gene expression analysis of osteopontin on days 3, 7 and 14. ... 87
Figure 3.14 Alizarin red staining of rMSCs on PA coated, gelatin coated and uncoated TCP surfaces on days 3, 7 and 14. Scale bars are 100 µm. ... 88
Figure 3.15 Quantification of Ca2+ deposition on PA coated, gelatin coated and uncoated TCP surfaces on days 7 and 14, **p < 0.01, ***p < 0.001. ... 89
Figure 3.16 Alizarin red staining of E3/K3-PA nanofibers, gelatin-coated and bare TCP (samples without cells) after 7 and 14 days of incubation in osteogenic medium. No staining was observed on E3/K3-PA nanofibers, gelatin-coated or bare TCP. Scale bars are 100 µm. ... 90
xxii
Figure 4.2 RP-HPLC chromatogram of E3-PA, the change of response units with
respect to time at 220 nm. ... 101 Figure 4.3 [M-H]- (calculated):912.50, [M-H]- (observed):912.35; [M/2-H]-
(calculated): 455.75, [M/2-H]- (observed): 455.64; [M/3+H]+ (calculated): 303.16, [M/3+H]+ (observed): 303.41... 101 Figure 4.4 TEM images of formation of plate-like hydroxyapatite crystals in the presence of peptide amphiphile molecules. (a) Peptide nanofibers in the absence of minerals (scale bar is 250 nm), (b) calcium phosphate mineralization after 30 min of incubation (scale bar is 100 nm) and (c) calcium phosphate mineralization after 90 min of incubation (scale bar is 50 nm). ... 102 Figure 4.5 XRD patterns of calcium phosphate mineralized E3-PA nanofibers. ... 103
Figure 4.6 XRD patterns of non-mineralized E3-PA nanofibers. The triggering
mechanism of self-assembly is calcium ions. ... 104 Figure 4.7 XRD patterns of NaCl salt. ... 104 Figure 4.8 Equilibrium storage moduli of mineralized E3-PA nanofibers. ... 105
Figure 4.9 Relative adhesion of Saos-2 cells on the peptide nanofibers after 4 h. .. 106 Figure 4.10 Viability of Saos-2 cells on mineralized and non-mineralized peptide nanofibers after 24 h of incubation. Live cells–green. Dead cells–red. Scale bars are 100 µm. ... 107 Figure 4.11 Viability of Saos-2 cells on mineralized and non-mineralized peptide nanofibers after 24 h of incubation. ... 107 Figure 4.12 Spreading of Saos-2 cells characterized with actin fiber staining (nuclei stained with TO-PRO3 (blue), actin fibers stained with TRITC-conjugated phalloidin (green). Scale bars are 20 µm. ... 108
xxiii
Figure 4.13 Relative proliferation of cells normalized to TCP on day 1 and 3. Error bars represent mean ± SEM, (*p < 0.05, **p < 0.01, ***p < 0.001). ... 108 Figure 4.14 Effect of mineralized and non-mineralized peptide nanofibers on ALP activity of Saos-2 cells in normal medium on days 3, 7, and 14. ***p < 0.001, **p < 0.01. ... 110 Figure 4.15 Effect of mineralized and non-mineralized peptide nanofibers on ALP activity of Saos-2 cells in osteogenic medium on days 3, 7, and 14. ***p < 0.001, **p < 0.01. ... 110 Figure 4.16 Gene expression analysis of Runx2 on days 3, 7 and 14 in maintenance medium. Expression levels of each gene were normalized against TCP and GAPDH was used as internal control, *p < 0.05. ... 111 Figure 4.17 Gene expression analysis of collagen I in maintenance medium on days 3, 7 and 14. Expression levels of each gene were normalized against TCP and GAPDH was used as internal control, *p < 0.05. ... 112 Figure 4.18 Gene expression analysis of osteocalcin in maintenance medium on days 3, 7 and 14. Expression levels of each gene were normalized against TCP, and GAPDH was used as internal control, *p < 0.05. ... 113 Figure 4.19 Gene expression analysis of Runx2 in osteogenic medium on days 3, 7 and 14. Expression levels of each gene were normalized against TCP, and GAPDH was used as internal control, ****p < 0.0001. ... 114 Figure 4.20 Gene expression analysis of collagen I in osteogenic medium on days 3, 7 and 14. Expression levels of each gene were normalized against TCP, and GAPDH was used as internal control, ****p < 0.0001. ... 114
xxiv
Figure 4.21 Gene expression analysis of osteocalcin in osteogenic medium on days 3, 7 and 14. Expression levels of each gene were normalized against TCP, and GAPDH was used as internal control. ... 115 Figure 4.22 Immunostaining of collagen I in osteogenic medium on day 7. ... 115 Figure 5.1 Processing of dentin sialophosphoprotein (DSPP). DSPP is the precursor of dentin phosphoprotein (DPP). (Reproduced from Ref. [228] with permission from Frontiers in Bioscience Publishing Group). ... 118 Figure 5.2 Chemical structures of the designed PA molecules ... 126 Figure 5.3 Liquid chromatography and mass spectrometry results of the PA molecules. (a) [M-H]- (calculated): 1030.96, [M-H]- (observed): 1030.31; [M/2-H]- (calculated): 514.49, [M/2-H]- (observed): 514.62; [M/3-H]- (calculated): 342.65, [M/3-H] -(observed): 342.73. (b) [M-H]- (calculated): 870.02, [M-H]- (observed): 870.38; [M/2-H]- (calculated): 434.01, [M/2-H]- (observed): 434.66. ... 127
Figure 5.4 Secondary structure analysis of gels formed with the addition of calcium ion. ... 128 Figure 5.5 Oscillatory rheology of DPP-mimetic PA networks after addition of calcium ions. ... 129 Figure 5.6 TEM images of DPP-mimetic PA networks after addition of calcium ions. ... 129 Figure 5.7 Hydroxyapatite deposition on peptide coated surfaces. Mineral deposition on peptide surfaces with and without hydrogel formation. ... 130 Figure 5.8 Schematic representation of the different stages of surface-directed mineralization of calcium phosphate from SBF at 37 °C. Stage 1: loose aggregation of prenucleation clusters in equilibrium with ions in solution. Stage 2: prenucleation
xxv
clusters aggregate in the presence of the monolayer with loose aggregates still present in solution. Stage 3: aggregation leads to densification near the monolayer. Stage 4: nucleation of amorphous spherical particles only at the monolayer surface. Stage 5: development of crystallinity following the oriented nucleation directed by the monolayer. (Reproduced from Ref. 242 with permission from Nature Publishing Group) ... 133 Figure 5.9 CaP mineralization on Ca ion-treated SpDSp-PA hydrogel. ... 134 Figure 5.10 Viability of Saos-2 cells cultured on peptide nanofibers and uncoated surface (TCP), as analyzed by calcein-ethidium homodimer live−dead assay. ... 135 Figure 5.11 Viability of Saos-2 cells cultured on peptide nanofibers and uncoated surfaces (TCP), as analyzed by calcein-ethidium homodimer live−dead assay. ... 136 Figure 5.12 Molecular analysis of osteogenic differentiation in osteogenic medium. Gene expression analysis of Runx2. The level of Runx2 gene expression was normalized to GAPDH. Values represent mean ± SEM (**p < 0.01, *p < 0.05). ... 137 Figure 5.13 Molecular analysis of osteogenic differentiation in osteogenic medium. Gene expression analysis of collagen I. The level of collagen I gene expression was normalized to GAPDH. Values represent mean ± SEM (***p < 0.001, **p < 0.01, *p < 0.05). ... 138 Figure 5.14 Molecular analysis of osteogenic differentiation in osteogenic medium. Gene expression analysis of osteopontin. The level of osteopontin gene expression was normalized to GAPDH. Values represent mean ± SEM (***p < 0.001, **p < 0.01, *p < 0.05). ... 139 Figure 5.15 Confocal images of DMP-1 immunostaining in osteogenic medium on day 14. Green shows DMP-1, and blue shows the nucleus. ... 140
xxvi
Figure 5.16 Molecular analysis of osteogenic differentiation in maintenance medium. Gene expression analysis of Runx2. The level of Runx2 gene expression was normalized to GAPDH. Values represent mean ± SEM (****p < 0.0001, ***p < 0.001). ... 141 Figure 5.17 Molecular analysis of osteogenic differentiation in maintenance medium. Gene expression analysis of collagen I. The level of collagen I gene expression was normalized to GAPDH. Values represent mean ± SEM (****p < 0.0001, *p < 0.05). ... 141 Figure 5.18 Molecular analysis of osteogenic differentiation in maintenance medium. Gene expression analysis of osteopontin. The level of osteopontin gene expression was normalized to GAPDH. Values represent mean ± SEM (**p < 0.01, *p < 0.05). ... 142 Figure 5.19 Confocal images of DMP-1 immunostaining in maintenance medium on day 14. Green shows DMP-1, and blue shows the nucleus. ... 143 Figure 5.20 Biomineralization of Saos-2 cells on DPP-mimetic PA nanofibers and TCP on day 7, as demonstrated by Alizarin red staining. Scale bars are 100 µm. .. 144 Figure 5.21 Quantification of Ca2+ deposition on DPP-mimetic PA nanofibers and
uncoated TCP surfaces on day 7, **p < 0.01. ... 144 Figure 5.22 Biomineralization of Saos-2 cells on DPP-mimetic PA nanofibers and TCP on day 14, as demonstrated by Alizarin red staining. Scale bars are 100 µm. 145 Figure 5.23 Quantification of Ca2+ deposition on DPP-mimetic PA nanofibers and uncoated TCP surfaces on day 14, **p < 0.01, ***p < 0.001, ****p < 0.0001. .... 145
xxvii
List of Tables
Table 1.1 Main GF acting on bone repair. (Reproduced from Ref. 50 with permission from Springer Publishing Group)………...13
Table 2.1 Primers used for qRT-PCR expression analysis……….37
Table 3.1 Primers used for qRT-PCR expression analysis……….76
Table 4.1 Primers used for qRT-PCR expression analysis………...100
Table 5.1 SEM-EDX results of SpDSp-PA + Ca……….131
Table 5.2 SEM-EDX results of SpDSp-PA………..131
Table 5.3 SEM-EDX results of SDS-PA + Ca………..132
Table 5.4 SEM-EDX results of SDS-PA………...132
xxviii
Abbreviations
AFM Atomic force microscopy
ALP Alkaline phosphatase
ANOVA Analysis of variance
BMP Bone morphogenetic protein
BSA Bovine serum albumin
CD Circular dichroism
DCM Dichloromethane
DIEA N,N-diisopropylethylamine
DMEM Dulbecco's modified Eagle's medium
DMF N,N-Dimethylformamide
ECM Extracellular matrix
ESI Electrospray ionization
FBS Fetal bovine serum
FGF Fibroblast growth factor
Fmoc 9-Fluorenylmethoxycarbonyl
FTIR Fourier transform infrared spectroscopy
GAG Glycosaminoglycan
GAPDH Glyceraldehyde 3-phosphate dehydrogenase
GF Growth factor
HA Hydroxyapatite
HBTU N,N,N′,N′-Tetramethyl-O-(1H-benzotriazole-1-yl) uronium hexafluorophosphate
H&E Hematoxylin and eosin
HPLC High pressure liquid chromatography IGF Insulin-like growth factor
IM Intramuscular
LC-MS Liquid chromatography-mass spectroscopy
Micro-CT Micro Computed Tomography
MSC Mesenchymal stem cell
xxix
PBS Phosphate buffered saline
PDGF Platelet-derived growth factor
rMSC Rat mesenchymal stem cell
qRT-PCR Quantitative real-time polymerase chain reaction
QTOF Quadrapole time of flight
SD Standard deviation
SEM Standard error of mean
SEM Scanning electron microscopy
TCP Tissue culture plate
TEM Transmission electron microscopy
TFA Trifluoroacetic acid
TIS Triisopropyl silane
TGF-β Transforming growth factor-β
UV Ultraviolet
1
Chapter 1
1. Introduction
1.1 Bone TissueBone is a dynamic and highly vascularized tissue characterized by its rigidity, strength and ability to support the frame of the body [1, 2]. There are 206 different bones making up the skeleton, ranging from the long bones found in the limbs, short bones in the wrist and ankle, and flat bones in the sternum and skull, to irregular bones such as the pelvis and vertebrae [1]. The bones of the skeleton protect the vital organs, provide an environment for hematopoiesis within the marrow, serve as a reservoir of growth factors and cytokines, provide maintenance of acid-base balance and act as a mineral reservoir for calcium homeostasis [2]. Bone remodels throughout the lifetime of an individual by the removal of old, microdamaged bone and its replacement with new, mechanically stronger bone to help preserve bone strength [2, 3].
1.1.1 Hierarchical Structure of Bone
Bone has a hierarchical structure that includes macroscale, microscale, sub-microscale, nanoscale, and sub-nanoscale level organizations (Figure 1.1). The macroscale level of bone can be classified as compact bone (cortical bone) and trabecular bone (cancellous bone) [4]. The cortical bone is dense, solid, and surrounds the marrow space, while the trabecular bone is composed of a honeycomb-like network of trabecular plate rods interspersed in the bone marrow compartment [5]. Cortical bone is covered by an outer periosteal surface (periosteum), which is a fibrous connective tissue sheath surrounding the outer cortical surface of bone, except at the joints of long bones. The periosteum has an important role in fracture repair,
2
appositional growth, protection, nourishment and bone formation. It contains osteoblasts, osteoclasts, blood vessels and nerve fibers. Endosteum, the inner endosteal surface of the bone, is a membranous structure covering the inner surface of all bones and surrounds the blood vessel canals (Volkmann’s canals) that are present in bone [5]. Cortical bone can have a thickness between several tenths of a millimetre to several millimetres or even centimetres [6].
Cancellous bone is supported by struts, the thickness of which is typically between 100 and 300 µm [6]. In this bone type, the most prominent structures seen at the nanoscale are mineralized collagen fibers with diameters of c. 100 nm [7]. The fundamental structural unit of fibrils consists of 300 nm-long and 1.5 nm-thick collagen molecules, which are deposited by osteoblasts into the extracellular space and then aggregate into fibrils through a self-assembling process. Adjacent collagen molecules are staggered in their long axis by 67 nm and generate a characteristic pattern of gap zones with 35 nm lengths and overlap zones with 32 nm lengths within the fibril [8]. Bone mineral crystals occur at regular intervals along the fibrils with an approximate repeat distance of 67 nm, corresponding to the distance by which adjacent collagen molecules are staggered [9].
1.1.2 Bone Cells
A balance between the activities of bone-forming osteoblasts and bone-resorbing osteoclasts is necessary to maintain the mature skeleton of mammals, including humans (Figure 1.2) [10].
3 F igu re 1.1 Hiera rc hi c al struc tura l or g aniz ati on of bone . (Re p roduc ed fr om R ef. 4 with pe rmiss ion fr om Elsevie r P ubli shing Gr oup)
4 1.1.2.1 Osteoblasts
Osteoblasts are the bone-making cells that produce a unique combination of extracellular proteins, such as osteocalcin, alkaline phosphatase and a large amount of type I collagen. When type I collagen is first deposited and but not yet mineralized, the extracellular matrix is described as osteoid. This preliminary arrangement can be subsequently mineralized through the accumulation of calcium phosphate in the form of hydroxyapatite. Osteoblasts are polarized cells with cellular membranes that are basally in direct contact with the bone surface, and extend a multitude of cytoplasmic processes into the newly deposited osteoid [11]. Osteoblasts possess a strongly basophilic cytoplasm, abundant mitochondria and a large Golgi apparatus, all of which enable these cells to produce large amounts of extracellular proteins [12].
The differentiation process of osteoblasts is divided into three stages, which are mesenchymal progenitors, preosteoblasts and osteoblasts. Osteoblasts are often characterized by the expression of osteocalcin; however, molecular markers for the mesenchymal progenitors are not very clear [10]. The “preosteoblast” moniker is applied to all cells transitioning from progenitors to mature osteoblasts. These cells are usually known to express the transcription factor runx2 or, at a more advanced stage of differentiation, both runx2 and osterix [10].
1.1.2.2 Osteocytes
A subset of osteoblasts can become osteocytes upon being entrapped within the bone matrix, while the remaining osteoblasts undergo apoptosis or become inactive bone-lining cells [13]. Osteocytes constitute 95% of cells in the mature bone tissue and function within syncytial networks in cooperation with each other, osteoblasts and/or
5
lining cells on the bone surface. Osteocytes are important regulators of bone remodelling in response to both mechanical and hormonal signals.
Figure 1.2 a) Bone homeostasis is achieved by osteoclasts (which are responsible for bone resorption) and osteoblasts (which are responsible for bone formation). b) Osteoblasts can differentiate from mesenchymal progenitors through two processes, intramembranous or endochondral ossification. (Adapted from Ref. 10 with permission from Nature Publishing Group)
1.1.2.3 Osteoclasts
Osteoclasts are multinucleated cells responsible for bone resorption (Figure 1.2) and are derived from mononuclear precursor cells of the monocyte/macrophage lineage [14]. Two cytokines are known to play crucial roles for osteoclast formation: RANKL
6
and macrophage CSF (M-CSF). These factors are produced mainly by marrow stromal cells and osteoblasts in membrane-bound and soluble forms [15]. The presence of stromal cells and osteoblasts in bone marrow is required for osteoclastogenesis [15]. RANKL belongs to the TNF superfamily and is critical for osteoclast formation. M-CSF functions in the proliferation, survival, and differentiation of osteoclast precursors, as well as osteoclast survival and the cytoskeletal rearrangements required for bone resorption [16].
1.1.3 Bone Extracellular Matrix
Cells of connective tissues are surrounded by an extracellular matrix (ECM), which is a dynamic network of molecules secreted by cells. ECM binds cells, acts as a scaffold for them, modulates their survival, development, shape and migratory behavior, and also serves as a reservoir for growth factors and cytokines (Figure 1.3) [17]. The organic phase of bone ECM consists of collagenous proteins (90%), mainly of type I collagen, and noncollagenous proteins including osteocalcin, osteonectin, osteopontin, fibronectin and bone sialoprotein II, bone morphogenetic proteins (BMPs), and growth factors [18, 19]. Hydroxyapatite crystals form the inorganic phase of bone ECM [18].
1.1.3.1 Bone Matrix Proteins
85 to 90% of the bone matrix is composed of collagenous proteins. The most abundant protein in bone matrix is type I collagen [20], in addition to trace amounts of type III, type V and Fibril-Associated Collagens with Interrupted Triple Helices (FACIT) collagens at certain stages of bone formation. FACIT collagens are a group of nonfibrillar collagens serving as molecular bridges that are important for the organization and stability of extracellular matrices. This protein family contains collagens IX, XII, XIV, XIX, XX, and XXI [21].
7
Figure 1.3 The extracellular matrix (ECM) of bone. (Adapted from Ref. 19 with permission from John Wiley and Sons Publishing Group)
Bone protein is composed of 10 to 15% noncollagenous proteins. During the last two decades, a number of noncollagenous proteins, such as osteocalcin, matrix gla-protein, osteonectin, osteopontin, and bone sialoprotein have been isolated from bone tissue and characterized [22-30]. The functions of each of the bone proteins are not well understood at present, and many seem to serve multiple functions such as regulation of bone mineral deposition and turnover and regulation of bone cell activity. For example, osteocalcin was previously shown to function as a promoter or initiator of calcium deposition, and therefore accepted as a marker of bone formation. On the other hand, it was also shown that osteocalcin knockout mice had a high bone mass phenotype, which suggests that osteocalcin normally inhibits bone formation. Osteocalcin is currently accepted as a marker of bone turnover rather than a specific marker of bone formation because serum osteocalcin is derived from both matrix release by osteoclast activity and osteoblast synthesis [21]. The main glycosylated
8
protein present in bone is alkaline phosphatase (ALP), which is bound to osteoblast surfaces by a phosphoinositol linkage and is also found free within the mineralized matrix. ALP hydrolyzes pyrophosphate and provides inorganic phosphate groups to promote mineralization [31]. The most abundant noncollagenous protein in bone is osteonectin, which accounts for approximately 2% of total protein in developing bone. It has roles in osteoblast growth and/or proliferation and matrix mineralization [21]. Osteopontin is involved in mineral deposition and growth, perhaps as an inhibitor [32, 33]. Bone sialoprotein has been thought to be involved in hydroxyapatite nucleation [32].
1.1.3.2 Glycosaminoglycans (GAGs) in Bone Tissue
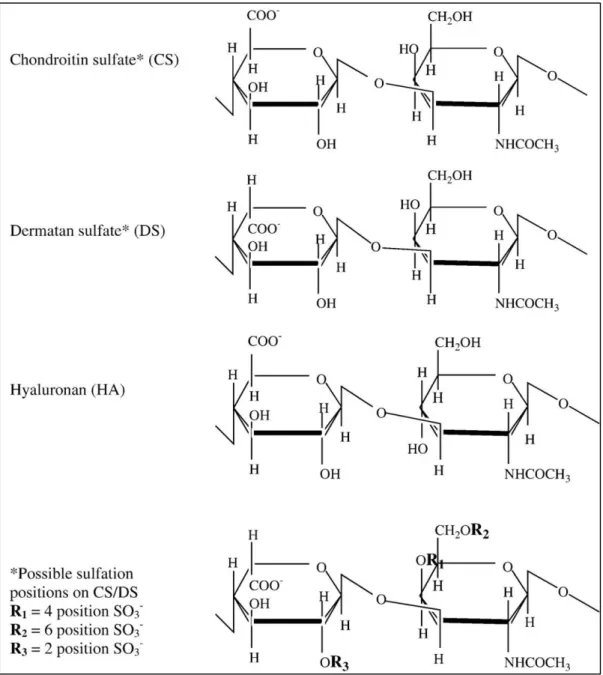
Glycosaminoglycans (GAGs) have an essential role in tissue organisation through their interactions with a diverse range of proteins, growth factors and other chemokines. All GAGs are present in the body as proteoglycans, and are therefore covalently cross-linked to a protein core, except for the unsulfated hyaluronic acid and the highly sulfated heparin [34, 35].
PGs are categorized according to their sugar composition as keratan sulfate(s), chondroitin sulfate(s), dermatan sulfate(s), and heparan sulfate(s) (Figure 1.4) [35, 36]. Hyaluronic acid is not sulfated and not attached to a protein backbone [36-38]. Proteoglycans can also be classified according to their function and tissue distribution: aggrecan and versican, for example, are large secreted proteoglycans, while decorin and lumican are small leucine-rich proteoglycans, and perlecan is a basement membrane proteoglycan. In addition, syndecans are cell-surface-associated proteoglycans, whereas serglycin is an intracellular proteoglycan. The molecular
9
diversity of proteoglycans provides structural basis for a multitude of biological functions [37].
GAGs are linear polysaccharides composed of disaccharide repeat units, one of which is a hexuronic acid, glucuronic acid or iduronic acid, and the other is a hexosamine, N-acetylglucosamine (GlcNAc) or N-acetylgalactosamine [39]. Their biosynthesis is a complex nontemplate-driven process carried out by several enzymes that assemble the GAG polymer and then sulfate it at specific positions. Synthesis of heparan sulfates and chondroitin sulfates take place in the Golgi, where the individual GAG chains are O-linked to a core protein [40-42]. On the other hand, synthesis of keratan sulfate can
involve either N-linking or O-linking to the core protein of the proteoglycan [40, 43].
Hyaluronic acid is not synthesized in the Golgi from the core protein, but instead requires an integral plasma membrane synthase, which secretes the nascent chain immediately [40, 44].
GAGs are highly negatively charged molecules, with extended conformations that provide high viscosity to the solution. These polysaccharides are located mainly on the surface of cells or in the ECM. The high viscosity of GAGs also results in low compressibility, which makes these molecules ideal for serving as lubricating fluid in the joints [45]. GAGs are present in an environment containing a variety of proteins, such as growth factors, cytokines, morphogens, and enzymes. Generally, they exert their biological activities through the localisation, stabilisation, activation or inactivation of interacting proteins [46]. GAGs play crucial roles in mediating the formation of protein complexes such as growth factor-receptor or enzyme-inhibitor associations on the cell surface and in the ECM. Cell signalling events are iniated or inhibited through a network of signals that are transduced through the formation of
10
ternary complexes of ligand, receptor, and proteoglycan. Thus, proteins and enzymes can be potentially sequestered by GAGs and presented to the appropriate site for activation [47]. GAGs can also function in maintaining morphogen gradients across a cell or tissue, which is crucial for a range of developmental processes [48]. Graded affinities between different GAG sequences and proteins may lead to the establishment and maintenance of a gradient in the concentration of growth factors or morphogens.
Alongside collagens, proteoglycans are the major constituents of the organic matrix of bone and play crucial roles in many bone processes, including the organization of the bone ECM and regulation of collagen fibrillogenesis. Proteoglycans also show selective patterns of reactivity with several constituents such as cytokines and growth factors, which modulates their bio-availability and biological activity in the bone tissue [49]. Different proteoglycan families are present in the bone matrix, including small leucine-rich proteoglycans (the most abundant), heparan sulphate proteoglycans, aggrecan and hyaluronic acid, all of which are responsible for exerting specific functions [49].
Growth Factors
The main growth factors affecting the functions of skeleton are bone morphogenetic proteins (BMPs), transforming growth factor-β (TGF-β), fibroblast growth factor (FGF), platelet-derived growth factor (PDGF), vascular endothelial growth factor (VEGF) and insulin-like growth factors (IGFs) (Table 1.1). In general, growth factors that are found embedded within the bone matrix or secreted by bone are considered to be major players during the bone repair process.
11
Figure 1.4 Repeating disaccharide units and possible sulfation positions of glycosaminoglycan chains. (Adapted from Ref. 35 with permission from Elsevier Publishing Group).
12
Immediately after bone injury, clot formation is observed and platelet α-granules release TGF-β, PDGF, VEGF and IGF [50]. FGF, PDGF and TGF-β are secreted by macrophages and other inflammatory cells subsequent to the inflammatory reaction. BMPs, PDGF, FGF and VEGF enhance the migration of osteoprogenitors, while PDGF and FGF stimulate the proliferation of periosteum-derived cells during the early stages of bone repair [51]. TGF-β, IGFs, BMP-6, BMP-2 and BMP-7 modulate the proliferation and differentiation of osteoprogenitor cells, whereas VEGF and FGF-2 regulate vascular ingrowth in the healing bone [50].
1.1.4 Bone Matrix Mineralization
Bone contains of 50 to 70% mineral, 20 to 40% organic matrix, 5 to 10% water, and 3% lipids. The mineral content of bone is mostly hydroxyapatite [Ca10(PO4)6(OH)2],
with small amounts of carbonate, magnesium, and acid phosphate. In contrast to geological hydroxyapatite crystals, bone hydroxyapatite crystals are very small, measuring around 200 Å in their largest dimension. This small, poorly crystalline, carbonate-substituted structure makes these crystals more soluble than geologic hydroxyapatite crystals, which allow them to support the mineral metabolism [21]. Expression of ALP and several noncollagenous proteins such as osteocalcin, osteopontin, and bone sialoprotein mainly occurs during matrix maturation. It is assumed that the amount and size of hydroxyapatite crystals are regulated by these calcium- and phosphate-binding proteins [21].
The mechanical rigidity and load-bearing strength of bone are provided by bone minerals, while its elasticity and flexibility are derived from the organic matrix. Between the ends of collagen fibers, there are “hole” zones in which bone mineral is initially deposited [52].
13
Table 1.1 Main growth factors acting on bone repair. (Reproduced from Ref. 50 with permission from Springer Publishing Group).
GF Cell source Biological effect Action on bone
BMP Osteoprogenitor cell, osteoblast, Chondro-osteogenesis, Migration of osteoprogenitors, chondrocyte, endothelial cell (BMP-2) Chondro-osteogenesis, osteoinduction (BMP-2) Migration of osteoprogenitors, induction of proliferation, differentiation and matrix synthesis FGF Macrophage, monocyte,BMSC, chondrocyte, osteoblast,endothelial cell Angiogenesis, proliferation of fibroblast, and smooth muscle cells of vessels
Chondrocyte maturation (FGF-1). Osteoblast proliferation and differentiation, inhibition of apoptosis of immature osteoblasts, induction of apoptosis of mature osteocytes, bone resorption (FGF-2) IGF Osteoblast, chondrocyte, hepatocyte, endothelial cell Regulation of growth hormone effects Osteoblast proliferation and bone
matrix synthesis, bone resorption PDGF Platelet, osteoblast, endothelial cell, monocyte, macrophage Proliferation of connective tissue cells, monocyte/macrophage and smooth muscle cell
chemotaxis, Angiogenesis Osteoprogenitor migration, proliferation and differentiation TGF-β Platelet, osteoblast, BMSC, chondrocyte, endothelial cell, fibroblast, macrophage Immunosuppression, angiogenesis, stimulation of cell growth, differentiation
and ECM synthesis
Undifferentiated mesenchymal cell proliferation, osteoblast precursor recruiting; osteoblast and chondrocyte differentiation (but inhibition of terminal differentiation), bone matrix production, recruitment of osteoclast precursors
VEGF Osteoblast, platelet Angiogenesis Conversion of
cartilage into bone, osteoblast proliferation
14
Initiation of mineralization may be promoted by extracellular matrix vesicles in bone, as it is in calcifying cartilage and mineralizing tendon [53]. During this process, chondrocytes and osteoblasts synthesize matrix extracellular vesicles, which act as a protected microenvironment in which calcium and phosphate concentrations can increase sufficiently to precipitate crystal formation. Matrix extracellular vesicles have a nucleational core composed of proteins and a complex of acidic phospholipids, calcium, and inorganic phosphate, which is sufficient to precipitate hydroxyapatite crystals. As bone matures, hydroxyapatite crystals enlarge by crystal growth and aggregation and also reduce their level of impurities. By increasing local concentrations of calcium and/or phosphorus, bone matrix macromolecules may facilitate initial crystal nucleation. Dentin matrix protein 1 and bone sialoprotein are the main mineralization promoters. In addition, ALP also regulates the mineralization process by increasing local phosphorus concentrations, removing phosphate-containing inhibitors of hydroxyapatite crystal growth, or modifying phosphoproteins to control their ability to act as nucleators [21]. Vitamin D also indirectly stimulates the mineralization of unmineralized bone matrix. In fact, 1,25-dihydroxyvitamin D [1,25-(OH)2D] (which is produced by kidneys after absorption) and vitamin D (which is derived from precursors in skin) are responsible for maintaining serum calcium and phosphorus in adequate concentrations to allow the passive mineralization of unmineralized bone. Furthermore, serum 1,25-(OH)2D also promotes the differentiation of osteoblasts and stimulates osteoblast expression of bone-specific ALP, osteocalcin, osteonectin, OPG, and a variety of other cytokines [21].
15 1.1.5 Bone Formation
1.1.5.1 Intramembranous (Mesenchymal) Ossification
The direct conversion of mesenchymal tissue into bone is called intramembranous ossification, which is one of the two major modes of bone formation during the fetal development of the mammalian skeletal system. This process occurs mainly during the formation of the flat bones of the skull, but is also observed in the mandible, maxilla, and clavicles. In addition, intramembranous ossification is an essential process during the natural healing of bone fractures and the rudimentary formation of bones of the head. The steps in intramembranous ossification are the formation of an ossification center, calcification, formation of trabeculae and development of periosteum [5].
1.1.5.2 Intracartilaginous (Endochondral) Ossification
During endochondral ossification, cartilage tissue is formed by aggregated mesenchymal cells and this cartilage is later replaced by bone. Most bones in the body are ossified by this process, which is also responsible for mediating the vertical growth of long bones. The steps in endochondral ossification are the development of a cartilage model, growth of the cartilage model, development of the primary ossification center, development of the secondary ossification center, and the formation of articular cartilage and epiphyseal plate [5].
1.1.6 Clinical Need for Bone Regeneration
Bone does not function properly under disease states such as osteogenesis imperfecta, osteoarthritis, osteomyelitis, and osteoporosis. In addition to these diseases; traumatic injury, orthopedic surgeries and primary tumor resection may lead to bone defects or voids [54]. The large bone defects observed after these situations lack the template for an orchestrated regeneration and require surgical intervention [1]. Transplanting
16
autologous bone, in which the host bone is removed from another site (typically from the pelvis or iliac crest) and used to fill the defect, has been the gold standard for the treatment of bone defects. However, this method is limited by donor site morbidity, pain, paresthesia, prolonged hospitalization and rehabilitation, increased risk of deep infection, hematoma, inflammation, and restricted availability [55, 56]. The most commonly used alternative to bone autografts is the allografting of bone tissue from other humans (typically postmortem donations). Allografts may be provided from viable (alive) or sterilized non-viable sources, and have been approved by the FDA for many applications. However, allografts are also subject to immunological reactions and may possibly transmit infectious diseases [57, 58]. Patients requiring urgent bone repair or replacement may also consider a xenograft, which comes from nonhuman species [59]. Bone xenografts are now widely considered to be unsuitable for transplantation due to the risk of disease or virus transmission, infection, toxicity associated with sterilization, immunogenicity, and host rejection [60, 61].
1.1.7 General Principles in Bone Tissue Engineering
Because of the limitations of the current strategies for filling bone defects and subsequent repair, there is an expanding need for bone reconstruction that is paired with a growth of interest in the discipline of bone substitutes and tissue engineering [62]. The fundamental principle behind tissue engineering is the combination of engineering principles with the body’s natural biological response to tissue damage, and a range of multifunctional bioactive scaffolds have been developed through this approach. Ideal synthetic scaffolds should present a physiochemical biomimetic environment, biodegrade as native tissue integrates, and actively promote or prevent desirable and undesirable physiological responses, respectively [63, 64]. To address
17
these biomimetic requirements, successful bone reconstruction must simultaneously promote osteoproduction, osteoinduction, osteoconduction, mechanical stimulation, and vascularization [62].
1.1.8 Bone Tissue Regeneration Strategies
Promising bone tissue engineering strategies such as cell transplantation, acellular scaffolds, gene therapy, stem cell therapy, and growth factor delivery have been applied to encourage the growth of new bone [65-68]. The majority of bone tissue engineering processes involve a combination of these strategies. However, implantation of cellular or acellular scaffolds have emerged as the most promising approaches.
Mesenchymal stem cells (MSCs) are pluripotent cells that are capable of differentiation into a number of cell types. Differentiation of MSCs can be driven towards bone-forming cells under the influence of chemicals such as dexamethasone, ascorbic acid, and β-glycerol phosphate. In many studies, it has been shown that transplanted scaffolds seeded with MSCs enhance osteogenic capacity [69-71].
In order to support the rapid development of a transplant-ready cellular scaffold, different novel ex vivo culture techniques have been investigated to accelerate the cellular production of ECM. Growth factor delivery, bioreactor systems, and gene therapy are the main ex vivo culture techniques used in bone tissue engineering.
Growth factors such as PDGF, BMP, IGF and TGF-β have important roles in osteoinduction and osteoconduction [50]. In ex vivo conditions, the delivery of growth factors can be performed by simply adding them to the culture media or encapsulating them in a biodegradable scaffold. However, since growth factors have short half-lives
18
and high doses are required for their delivery, alternative technologies are required for enhancing MSC performance in in vivo bone scaffolds [72].
Similar to growth factor delivery, gene delivery approaches aim to encourage native MSCs to migrate into the scaffold, proliferate, differentiate, and begin ECM production by increasing the local concentration of osteoinductive and osteoconductive cues for surrounding cells in vivo. Gene therapy strategies have been extensively tested and proven in animal studies, and hold great potential for the future of bone tissue engineering [73].
Bioreactor systems have also been designed to enhance the in vitro performance of osteogenic cells before implantation. The dynamic and mechanical 3D environments found in in vivo conditions are simulated by these bioreactors, which also provide cells with all the necessary nutrients and biological cues to survive, proliferate, differentiate, and produce ECM while embedded in a scaffold matrix [74, 75]. However, bioreactor systems are limited by the fact that MSCs cultured ex vivo lose their phenotypic behavior (such as osteodifferentiation and bone forming capacity) once implanted in vivo. In addition, MSCs are found in low concentrations in bone marrow and exhibit a low capacity for proliferation, which further complicates ex vivo culturing efforts [70, 76-78].
Implantation of an acellular scaffold immediately after injury or bone removal is the second main tissue engineering approach. It is more critical in this strategy to design a scaffold that mimicks the native bone tissue and recruits local MSCs into its matrix. Such a scaffold should also support and promote osteodifferentiation and provide a biodegradable matrix for enhancing ECM production for MSCs, allowing the material
19
to eventually reintegrate into the surrounding native tissue [66, 79-81]. This strategy is more advantegous than other repair approaches in that acellular scaffolds are much easier to sterilize, have longer shelf-lives, and exhibit little to no potential for infection or immunogenicity.
Biomaterials for Bone Repair
Advances in material design have led to the replacement of bio-inert scaffolds in tissue engineering with bioactive matrices that readily integrate with biological molecules or cells and regenerate tissues [64, 82]. In the case of bone, materials should preferably be capable of osteoinduction (promoting the differentiation of progenitor cells into an osteoblastic lineage), osteoconduction (supporting bone growth and encouraging the ingrowth of surrounding bone), and osseointegration (integrating into the surrounding bone).
Polymers
Polymers can be natural or synthetic. Natural biodegradable polymers such as type-I collagen, fibrin, hyaluronic acid and chitosan are interesting candidates for tissue engineering and exhibit good biocompatibility and osteoconductive properties. However, they have several shortcomings including very low mechanical stability, immunogenicity, the potential risk of disease transmission and sourcing and handling issues.
Biodegradable synthetic polymers, such as polyanhydrides, polypropylene fumarate, polycaprolactones, polyphosphazenes, polylactide, polyglycolide, and associated copolymers (polylactide-co-glycolide) offer a versatile alternative to their natural counterparts [83-85]. These polymers can be generated using techniques such as salt
20
leaching [86], gas foaming [87], phase separation [88-90], supercritical fluid processing [91], microsphere sintering, and three-dimensional printing [92] to generate a range of three-dimensional scaffolds with different porosities and surface characteristics. Different polymers possess different physical attributes, mechanical properties, degradation times, and modes of degradation. These different properties can be more or less preferable depending on the intended application of the matrix. For example, surface-eroding polymers like polyanhydrides are more suitable to deliver loaded factors and therapeutic substances than polymers that undergo bulk degradation, such as polylactide-coglycolide and polycaprolactone [62]. Poly(lactic acid) (PLA), poly(glycolic acid) (PGA) and poly(lactic-coglycolide) (PLGA) and their copolymers are well-known aliphatic polymer types that are frequently used in the field of bone tissue engineering. Most commonly used subtypes of these polymers are the D-PLA PDLA and L-PLA (PLLA) forms of PLA, and blends of D, L-PLA (PDLLA), PLA, PGA and PLGA. These variants are especially popular in bone fixation devices, sutures, drug carriers and bioregeneration scaffolds. Moreover, high molecular weight aliphatic polyesters, poly(L-lactide), PLA, and PCL are also utilized for similar regeneration applications [93].
Hydrogels such as polyethylene glycol or alginate-based scaffolds can be delivered in a minimally invasive manner and gelled in situ (e.g. photocrosslinked or ionically) to provide a three-dimensional cellular microenvironment with high water content.
Chemical biofunctionalization and cell encapsulation and delivery are relatively straightforward for hydrogels [94, 95]. Many of their applications in bone have also been explored [96-98].
21 Ceramics
A ceramic is a material made from an inorganic, non-metallic material. Ceramics typically have crystalline structures and possess a high compressive strength and low ductility, which provides them with high resistance to deformation but also imparts them with a tendency to fracture under stress. Calcium phosphates, calcium sulfates, and bioactive glass are typical ceramic matrices used for bone regeneration. Calcium phosphates are especially suitable for use as matrices, because the inorganic component of bone is composed of the ceramic calcium hydroxyapatite. Calcium phosphate and bioactive glass are also considered to be biomimetic, since they stimulate the formation, precipitation, and deposition of calcium phosphate from
solutions, enhancing their bone-matrix interface strength [62].
Metals
Metallic scaffolds such as porous titanium or tantalum are the main class of biomaterials that are used in clinical settings. Porous metals exhibit a 3-dimensional interconnected pore structure, which is comparable to trabecular bone. In addition, titanium and tantalum are biocompatible, highly corrosion-resistant, durable and not biodegradable, with an elastic modulus very similar to that of the trabecular bone. Furthermore, they can be prepared in many different shapes and textures without affecting their biocompatibility. However, metals are naturally covered with an oxide layer that renders them highly bioinert and interferes with their integration to the surrounding tissue. Furthermore, titanium has higher stiffness compared to bone, which can cause problems associated with stress-shielding and subsequent implant loosening [62]. Nevertheless, metallic scaffolds are commonly employed to coat the