Ugur Dogrusoz1, Christian A. Duncan2, Carsten Gutwenger3, and Georg Sander4 1Bilkent University and Tom Sawyer Software
2Louisiana Tech University, Ruston, LA 71272, USA
3University of Dortmund, Germany
4
ILOG, 94253 Gentilly Cedex, France
Abstract. This report describes the 15thAnnual Graph Drawing Contest, held in conjunction with the 2008 Graph Drawing Symposium in Heraklion, Crete, Greece. The purpose of the contest is to monitor and challenge the current state of graph-drawing technology.
1
Introduction
This year’s Graph Drawing Contest had five distinct categories: four special graph cat-egories, and the Graph Drawing Challenge. The special graph categories provided four real world graphs from different application domains: a mystery graph, a graph from electric engineering, a graph from social sciences, and a biological network. The mys-tery graph had 71 nodes and 145 directed and labeled edges and represents a series of social or cultural events. The task was to determine which events are represented by this graph and to create a drawing of its logical structure. For the remaining categories, the task was to provide a visualization typical for the corresponding domain. The Graph Drawing Challenge, which took place during the conference, focused on minimizing the number of crossings of upward grid drawings of graphs with edge bends. We re-ceived 18 submissions: 7 for the four special graph categories, and 11 for the Graph Drawing Challenge. Unfortunately, we did not receive any submissions for the biolog-ical network, which represented the mTOR signalling pathways with 90 entities, 54 interactions and 85 inclusions.
2
Mystery Graph
Honoring this year’s conference location (Greece), the mystery graph represents the torch relay routes of all Olympic Summer and Winter Games. The nodes are countries, and the edges are labeled with the year of the games when the torch traveled from one country to the next. The data was collected from Wikipedia [5], but the order of the nodes and edges was randomized. All three teams that submitted a drawing found the correct solution.
I.G. Tollis and M. Patrignani (Eds.): GD 2008, LNCS 5417, pp. 453–458, 2009. c
Fig. 1. First place, Mystery Graph: Olympic Torch Relay Routes (original in color) Since the nodes represent countries, we received two submissions that depicted the graph on top of a geographic map. However, the judges felt that this did not illustrate the logical structure of the graph clear enough. The winning submission by Yifan Hu and Emden Gansner (Fig. 1) does not use geographic locations. Instead it places the ”Greece” node (the starting point of all torch relay routes) in the middle and groups the other country nodes around it. The different years of the routes are displayed by colors on the edges. The initial layout of this submission used the sfdp code in a developmental version of GraphViz[1]. It was then hand-tuned and fed through a spline routine.
3
Graph from Electrical Engineering
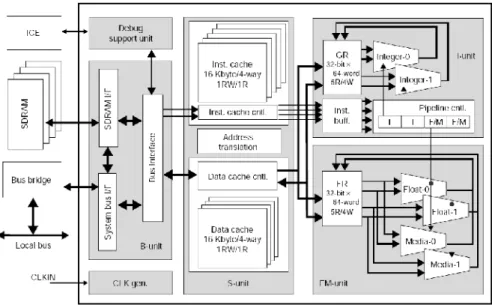
This electrical network represents the architecture of the FR500 VLIW processor. The graph data is inspired by a diagram published in [4]. The original diagram (Fig. 2) contains a mix of directed and undirected edges, but the contest graph is simplified (directions are removed, multi-edges are collapsed, an auxiliary node is introduced to detangle multi-edges). The resulting data consists of 35 deeply nested nodes and 48 undirected edges. The task was to produce a fully automatic drawing without manual tuning.
There were three submissions for the electric diagram. One submission was an energy-based compound straight-line drawing, and another submission used a 3D lay-out of the graph. The winning submission by Melanie Badent and Pietro Palladino used orthogonal edges with bends, which fits well for diagrams in the electrical application domain. The drawing (Fig. 3) was obtained by implementing a module
Orthogonal-GroupLayouterfor the freely available graph editor YEd [6]. This new module is
based on the topology-shape-metrics approach with three phases (planar embedding with the introduction of dummy nodes for crossings, calculating the edge shapes using bends, and finding the metrics for the shapes to obtain the final coordinates).
Fig. 2. FR500 VLIW processor, Original Diagram
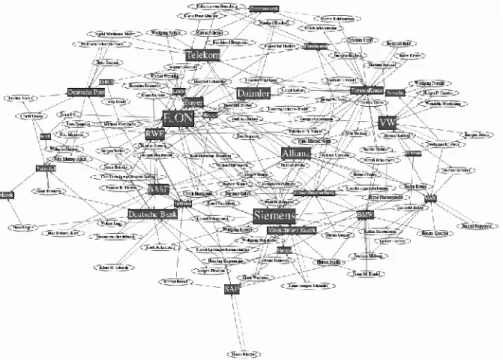
– The remaining nodes represent persons: the top union officers and the top managers in German business.
There are 3 kinds of directed edges:
– Edges from a person to a company: this person serves in the supervisory board of the company.
– Red edges from a company to a person: this person is employed by that company or employee union.
– Gray edges from a company to a person: this person was recently employed by that company.
The graph can be used to analyze the interest dependencies of companies. If a person is employed by a company and sits in the supervisory board of another company, the supervised company is partially controlled by the employing company. If a person was formerly employed, the situation is however less clear: in some cases, a former CEO
moved into the supervisory board simply to free the space for a new CEO but still kept strong ties to that company. In other cases, a former CEO parted completely from a company (e.g., got fired) and now acts on own interests.
The first prize was awarded to the only submission in this category by Yifan Hu and Emden Gansner (Fig. 4). They use a color coding on the nodes and edges. The company label size is proportional to the market capitalization of that company. The layout is obtained using the sfdp code of GraphViz without hand-tuning.
5
Graph Drawing Challenge
This year’s challenge dealt with minimizing the number of crossings of upward grid drawings of graphs with edge bends. This is a subproblem of the popular layered lay-out technique by Sugiyama e.a. [3] which is known to be NP-hard. It requires that all nodes be placed on grid positions, that nodes and edge bends don’t overlaps, and that all edge segments point strictly upwards. At the start of the one-hour on-site compe-tition, the contestants were given six nonplanar, acyclic, directed graphs with a legal upward layout that however had a huge number of crossings. The goal was to re-arrange the layout to reduce the number of crossings. Only the number of crossings was judged; other aesthetic criteria such as the number of edge bends or the area were ignored.
We partitioned the challenge into two subcategories: automated and manual. The seven manual teams solved the problems by hand using ILOG’s Simple Graph Editing Tool provided by the committee. They received graphs ranging in size from 19 nodes / 32 edges to 148 nodes / 200 edges. The four automated teams were allowed to use their own sophisticated software tools with specialized algorithms for the problem. They re-ceived graphs ranging in size from 24 nodes / 46 edges to 993 nodes / 1383 edges. Both subcategories were judged independently by summing up the scores of each graph. The score of a graph was determined by dividing the crossing number of the best submission by the crossing number of the current submission (hence, the best submission receives 1 point and the other submissions receive a fraction of 1).
The winner in the manual subcategory was the team of University Konstanz (Melanie Badent, Martin Mader, Christian Pich). They had the best manual result for 3 graphs and obtained an overall score of 4.6. The other manual teams obtained scores between 2 and 4.2. The winner in the automated subcategory was the team of TU Dortmund (Hoi-Ming Wong, Markus Chimani, Karsten Klein) using software based on a recently published algorithm [2]. They had the best automated result for all 6 graphs, hence obtaining the maximum possible score of 6 points.
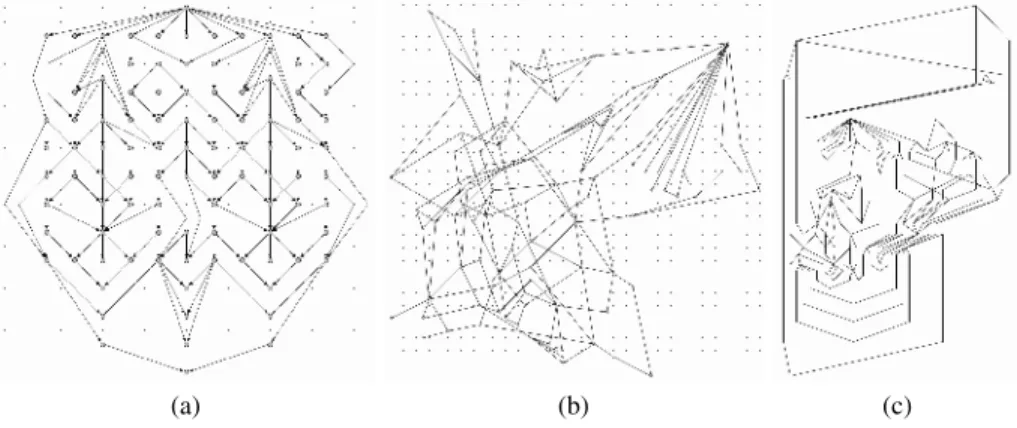
Some graphs used in both subcategories were constructed in a way so that the optimal crossing number was known. While some automated and manual teams reached the optimal crossing number for the smaller graphs, the optimal crossing number for larger graphs was neither reached by any manual nor by any automated team. However, the automated teams usually obtained better results than the teams that solved the challenge manually. Figure 5 shows the optimal result of a graph with 99 nodes/157 edges (4 crossings) and the corresponding best results of the manual teams (100 crossings) and of the automated teams (15 crossings).
(a) (b) (c)
Fig. 5. Challenge graph with 99 nodes / 157 edges: (a) the optimal solution: 4 crossings, (b) the best manually obtained result by team Konstanz: 100 crossings, (c) the best automated result by team Dortmund: 15 crossings
Acknowledgments
We thank Emek Demir of Memorial Sloan-Kettering Cancer Center, New York, for providing the data of the contest graph in the biological domain, and Lothar Krempel of Max Planck Institute for the Study of Societies, Germany, for the idea of the graph in the social sciences domain. Finally, we thank the generous sponsors of the symposium and all the contestants.
References
1. AT&T: Graphviz,http://www.graphviz.org
2. Chimani, M., Gutwenger, C., Mutzel, P., Wong, H.: Layer-free upward crossing minimization. In: McGeoch, C.C. (ed.) WEA 2008. LNCS, vol. 5038, pp. 55–68. Springer, Heidelberg (2008) 3. Sugiyama, K., Tagawa, S., Toda, M.: Methods for visual understanding of hierarchical
sys-tems. IEEE Trans. Sys. Man, and Cyb. SMC 11(2), 109–125 (1981)
4. Sukemura, T.: FR500 VLIW-architecture high-performance embedded microprocessor. FU-JITSU Sci. Tech. J. 36(1), 31–38 (2000)
5. Wikipedia: Olympic flame (accessed, March 2008),
http://en.wikipedia.org/wiki/Olympic Flame