THE EFFECT OF MARMARA EARTHQUAKE ON
FINANCIAL INSTITUTIONS
MARMARA DEPREMİNİN FİNANSAL KURUMLARIN PİYASA DEĞERLERİ ÜZERİNDEKİ ETKİSİ
Mehmet BOLAK, Ömür SÜER
Galatasaray University, Department of ManagementABSTRACT: This study aims to measure the effect of Marmara earthquake on the
stock returns of the firms quoted in ISE and operating in financial sector by the use of conventional econometric methodology of event studies. The results indicate that the occurrence of the earthquake has produced negative and significant abnormal returns. For each of the insurance firms studied, largely significant abnormal returns are observed just after the earthquake. The response of banks is negative but the significance level is less important.
Keywords: Earthquake ; Event study ; Insurance Firms ; Banks ; Turkey
ÖZET: Bu çalışmanın amacı, “olay çalışması” yöntemi kullanmak suretiyle,
İMKB’de işlem görmekte olan finansal sektör hisselerinin getirileri üzerinde, büyük Marmara depreminin yarattığı etkiyi ölçebilmektir. Sonuçlar, depremin bu hisseler üzerinde kayda değer büyüklükte negatif bir “artık getiri” oluşturduğuna işaret etmektedir. İnceleme kapsamındaki tüm sigorta sektörü hisselerinde yüksek anlamlılık düzeyinde negatif “artık getiriler” gözlenmiştir. Bankacılık sektörü hisselerinde de negatif “artık getiriler” gözlenmiş olmakla birlikte, anlamlılık düzeyleri daha düşük bulunmuştur.
Keywords: Deprem ; Olay çalışması ; Sigorta şirketleri ; Bankalar ; Türkiye
1. Introduction
Catastrophic events, like earthquakes, may create huge losses for the “exposed” firms not only in the real sector but also in the financial sector. The aim of this study is to examine the effect of 17 August 1999’s earthquake, which was a devastating event occurred in the north-west region of Turkey, on the stock returns of the firms quoted in ISE and operating in financial sector. More specifically, the sample includes the firms operating in the banking sector and in the insurance sector. We can expect two opposing results about the impact of the earthquake on the value of the insurance firms. As it is stated by Shelor et al. (1992), on one hand, the rapid depletion of surplus accounts fostered by catastrophic events may cause investors to discount insurance firm stock value. On the other hand, insurers may benefit from a catastrophic event because of subsequent increased consumer or institutional demand. About the impact of the earthquake on the stock prices of the firms operating in the banking sector, it is expected that it will be negative. The reason behind this supposition is as follows: The demand for cash will increase, which in turn will deplete the depository accounts of the banks.
This study examines only short-term impact in a 30-day event window by employing event study methodology. The general applicability of the event study
methodology has led to its wide use. In the fields of accounting and finance, event study methodology has been applied to various firm-specific and economy-wide events including mergers and acquisitions, earnings announcements, etc. Applications of event study methodology on the fields other than finance and accounting are also abundant. Among these fields, we can cite law and economics (Campbell et al., 1997).
The first part of this paper reviews previous literature about the impact of catastrophic events on stock market performance. Then, data and methodology used in the study are explained. Finally, empirical findings and conclusions are presented.
2. Literature Review
In capital markets, investors have access to several information about quoted firms, which generate expectations concerning risk and earnings. In efficient markets, stock prices should reflect quickly all of the relevant information about the firms. There may be many different information about the firms such as dividend and earnings announcements, mergers and acquisitions, etc. The impact of these types of information on common stock returns has been the subject of numerous articles (Ahanory and Swary, 1980; Asquith and Mullins, 1983; Charest, 1978; Odabaşı, 1998). On the other hand, the number of studies examining the effect of catastrophic events on stock returns is relatively limited. The catastrophic events, which have been so far utilized in the analyses are hurricanes, earthquakes, nuclear accidents and terrorist attacks.
The study of Hill and Schneeweis (1983) examines the effect on the stock returns of public utility firms of the Three Mile Island (TMI) nuclear accident. The sample used in this study is composed of 30 non-nuclear and 34 nuclear utilities selected from the electric utilities whose common stock are traded on the New York Stock Exchange for the period examined. The findings validate that, in the month of TMI, both the nuclear and non-nuclear firms experienced negative abnormal returns. The results indicate also that the negative returns were larger for firms using nuclear power. Another study, similar to that of Hill and Schneeweis (1983), is carried out by Fields and Janjigian (1989). This paper examines the reaction of U.S. public utilities’ stock prices to the Chernobyl nuclear power accident. Similar to the results of previous studies on TMI, the results of Fields and Janjigian’s (1989) study indicate that investors who held public utility stocks earned significant negative abnormal returns during the three day trading period following the announcement of the Chernobyl accident. Moreover, the losses of firms utilizing nuclear power were greater than those of the non-nuclear firms.
Another type of unanticipated catastrophic events considered by the researchers for evaluating its impact on stock prices is “fatal commercial airline crashes”. The results of the analysis of Barrett et al. (1987) indicate that the immediate negative reaction to fatal airline crashes is significant for only one full trading day after the event occurs.
Nevertheless, the catastrophic events, the most widely considered by the researchers for evaluating their impact on stock prices, are the earthquakes and the hurricanes. For instance, Shelor et al. (1990) examine the impact of the October 17, 1989 California earthquake on the stock value of firms in the real estate industry. The
findings of this study indicate that the earthquake bring important new information to the market since there is a statistically significant negative stock returns among the firms operating in the San Francisco area. On the other hand, real estate-related firms operating in other areas of California are unaffected by the earthquake. Two years later, in 1992, the same authors, Shelor et al. examine the impact of the October 17, 1989 California earthquake on the stock value of firms in the property-liability insurance sector. They claim, initially, two opposing hypotheses: (1) Insurers benefit from a catastrophic event because of subsequent increased demand (gaining from loss hypothesis); or, (2) The rapid reduction of surplus accounts fostered by catastrophic events causes investors to discount insurance firm stock values. The results of the study support the first hypothesis since the property-liability insurer stock values increased after the earthquake. In the same way, Yamori and Kobayashi (1999) examine the impact of the 1995 Hanshin-Awaji Earthquake on Japanese insurers’ value. The main finding of this study, which can be considered as the first attempt to empirically investigate a non-U.S. stock market reaction to a large earthquake, is the significant negative stock price reaction, which is in contradiction with the results for U.S. earthquakes.
Hurricanes, also, became the subject of numerous event studies aiming to evaluate their impact on stock values. For instance, Lamb (1995) analyzes the impact of Hurricane Andrew on the property-liability insurer stock values. This study categorizes the firms in the property-liability industry in terms of loss exposure and no loss exposure in order to determine if the market discriminated among insurers based on this risk. The results show that Hurricane Andrew produced a significant negative stock price reaction on property-liability insurers with direct premiums written in Florida or Louisiana. On the other hand, unexposed firms’ response to Hurricane Andrew was not significant. In other words, the results validate the hypothesis that the market efficiently interpreted the information generated by the hurricane and discriminated among property-liability insurers based on the existence and magnitude of insurance written. Lamb (1998) examined also the effects that Hurricanes Hugo and Andrew had on the stock returns of the property and casualty firms. There were 34 firms in the sample (17 exposed firms, 17 unexposed firms). The results indicate that Hurricane Hugo and Hurricane Andrew produced different market reactions on property and casualty firms. While the firms were unaffected by Hurricane Hugo, Hurricane Andrew generated a significant negative impact only on firms with premium business in Florida or Louisiana.
A relatively recent study is carried out by Carter and Simkins (2004) in order to investigate the stock-price reaction of airlines to the September 11th attacks. The findings indicate that there are significant negative abnormal returns for each of the airlines studied and smaller negative returns for airfreight firms. In other words, the market reaction was not the same for all airlines.
3. Data and Methodology
The sample is selected from those firms involved in the Turkish financial sector (banking and insurance) that were publicly traded in 1999. There are 20 firms in the sample, in total. Data files provided by Istanbul Stock Exchange are used for obtaining the daily stock returns. The unadjusted stock returns are, firstly, adjusted through the capital increases and dividend distributions.
In this study, the econometric methodology of event studies suggested by MacKinlay (1997) is employed. Thus far, the event study methodology has been applied to a variety of firm-specific and economy wide events such as mergers and acquisitions, earnings announcements, issues of new debt or equity, etc. (Campbell et al, 1997: 149). In this study, the event in question, 17 August 1999’s earthquake, is different than firm-specific events. The event window is 30 trading days following the event (26.08.1999 – 07.10.1999)1. Pre-event days are not included in the event
period since the event being considered is unexpected in nature. In order to calculate the normal return of the selected securities (prior to the calculation of abnormal returns), the market model is employed. This model assumes a stable linear relation between the market return and the security return. For any security i the market model is:
Rit = αi + βiRmt+εit (1)
E[εit]=0 var[εit] = σεi2
where Rit and Rmt are the period-t returns on security i and the market portfolio2, respectively, and εit is the zero mean disturbance term. αi, βi, and σεi2 are the parameters of the market model.
The parameters of the model are estimated by using an estimation window covering 250 days prior to the event. In other words, the expected daily return for each security is computed by observing the market behavior over a 250 trading days interval. Return observations begin 250 trading days before the earthquake and continue until the day before the earthquake (t= -250 to -1). The event period is not included in the estimation period to prevent the event from influencing the normal performance model parameter estimates.
The estimation procedure for the market model parameters includes ordinary least squares (OLS). For the ith firm in event time, the OLS estimators of the market
model parameters for an estimation window of observations are:
m i i i T T t m mt T T t m mt i it i
R
R
R
∧ ∧ ∧ ∧ = ∧ = ∧ ∧ ∧−
=
⎟
⎠
⎞
⎜
⎝
⎛
−
⎟
⎠
⎞
⎜
⎝
⎛
−
⎟
⎠
⎞
⎜
⎝
⎛
−
=
∑
∑
μ
β
μ
α
μ
μ
μ
β
1 0 1 0 2 (2)1 As the ISE was closed during 7 trading days due to the earthquake, the 26.08.1999 is considered as the
first day of the event window, namely as the event date. In other words, we define t=0 as the event date.
t=T1 (t=0) to t=T2 (t=29) represents the event window, and t=T0 (t=-250) to t=T1-1 (t=-1) constitutes the
estimation window. L1=T0 to T1 and L2=T1 to T2 are the length of the estimation window and the event
window respectively.
∑
∑
∑
= ∧ = ∧ = ∧ ∧ ∧ = = ⎟⎟ ⎟ ⎠ ⎞ ⎜⎜ ⎜ ⎝ ⎛ − − − = 1 0 1 0 1 0 1 1 2 1 2 1 1 2 1 T T t mt m T T t it i T T t mt i i it R L and R L where R R Lμ
μ
β
α
σ
ε (3)Rit and Rmt are the return in event period t for security i and the market respectively. Then, the measurement and analysis of abnormal returns are considered. The abnormal return can be interpreted as a measure of the impact of the event on the value of the firm over the event window. The abnormal return is the difference between observed and predicted returns and the cumulative abnormal return is the cumulative sum of the average abnormal returns. The sign, magnitude, and statistical significance of the abnormal returns indicate whether there is a market response to earthquake-related information.
For firm i and event date t the abnormal return is:
ARit = Rit - E(Rit⏐Xt) (4)
where ARit, Rit and E(Rit⏐Xt) are the abnormal, actual and normal returns respectively for time period t. Xt is the conditioning information for the normal return model. Or, more precisely, in case of using market model to measure the normal return, the sample abnormal return is:
mt i i it it
R
R
AR
=
−
α
∧−
β
∧ (5)After the calculation of abnormal returns, the testing framework for the abnormal returns has to be designed: (1) definition of the null hypothesis; (2) determination of the techniques for aggregating the individual firm abnormal returns. The formulation of the econometric design is followed by the presentation of the empirical results. Under the null hypothesis, that the event (earthquake, in our case) has no impact on the behavior of returns (mean or variance) the distributional properties of the abnormal returns can be used to draw inferences over any period within the event window. Under H0 the distribution of the sample abnormal return of a given
observation in the event window is:
where3 ⎥ ⎥ ⎥ ⎦ ⎤ ⎢ ⎢ ⎢ ⎣ ⎡ − + + = ∧ ∧ 2 2 1 2 2( ) 1 1 ( ) m m mt it R L AR i
σ
μ
σ
σ
ε (7)The next step involves the aggregation of abnormal return observations in order to draw overall inferences for the event of interest. The aggregation is carried out through time and across securities. After the aggregation through time for an individual security, the aggregation both across securities and through time is considered. We define CARi (t1, t2) as the cumulative abnormal return (CAR) from t1 to t2 where T1≤ t1≤ t2≤T2. The CAR from t1 to t2 is the sum of the included abnormal returns,
∑
==
2 1)
,
(
1 2 t t t it it
t
AR
CAR
(8)The distribution of the cumulative abnormal return under H0 is:
(
)
(
1 2)
2 2 1, ) 0, , (t t N t t CARi ≈σ
i (9) where, 2 1 2 2 1 2(
,
)
(
1
)
it
t
t
t
iσ
εσ
=
−
+
(10)Based on the cumulative abnormal returns, we can test the null hypothesis.
The next step involves the aggregation of the abnormal return observations for the event window and across observations of the event. In our case, since there is overlap in the event windows of the included securities, clustering is applied. For the application of the clustering approach, we constructed an equally-weighted portfolio from the securities constituting our sample4. Then, the procedure described above
for the individual security analysis is repeated for this portfolio. The abnormal return of the portfolio (denoted as p) for date t is calculated as follows:
mt p p pt pt
R
R
AR
=
−
α
∧−
β
∧ (11)In fact, due to the portfolio characteristics, this result is identical to the average of the abnormal returns of the securities:
3The second component
⎥ ⎥ ⎥ ⎦ ⎤ ⎢ ⎢ ⎢ ⎣ ⎡ − + ∧ ∧ 2 2 1 ) ( 1 1 m m mt R L σ
μ which is additional variance due to the sampling error
in αi and βi approaches zero as the length of the estimation window becomes large.
4 This portfolio construction process is repeated 3 times: firstly for the banks, then for the insurance firms, finally for the whole sample.
∑
= = N i it t AR N AR 1 1 (12) where N is the number of firms in the sample.The variance of the portfolio is calculated as follows:
⎥
⎥
⎥
⎦
⎤
⎢
⎢
⎢
⎣
⎡
−
+
+
=
∧ ∧ 2 2 1 2 2(
)
1
1
(
)
m m mt ptR
L
AR
pσ
μ
σ
σ
ε (13)and for large L1, the second component approaches to zero.
The aggregation of the average abnormal returns over the event window is carried out by aggregating the portfolio’s abnormal returns.
∑
= = 2 1 ) , (1 2 t t t pt p t t AR CAR (14)The distribution of the cumulative abnormal return of the portfolio, under H0 is:
(
)
(
2 1 2)
2 1,
)
0
,
,
(
t
t
N
t
t
CAR
p≈
σ
p (15) where, 2 1 2 2 1 2(
,
)
(
1
)
pt
t
t
t
pσ
εσ
=
−
+
(16)(
)
( )
1
,
0
)
)
1
((
,
2 1 2 1 2 2 1N
t
t
t
t
CAR
p p≈
+
−
=
εσ
θ
If the absolute value of θ is greater than 1.96, then the average abnormal return for that stock is significantly different from zero at the 5% level.
4. Empirical Results
The empirical results will lead to insights relating to understanding the sources and causes of the effects (or lack of effects) of the event under study, more specifically, the 17 August 1999’s earthquake. Table 1 presents the average daily and cumulative abnormal returns for the banking firms, insurance firms and the whole sample for the event window (30 trading days following the event date). A significant negative price response after the event date would provide evidence that the earthquake
produced unfavorable information that was manifested in depressed stock prices. On the other hand, a significant positive reaction would be interpreted as favorable information and no significant reaction would denote that the earthquake did not produce any new or important information that influenced stock prices.
Table 1. Market Response Measures for Banking Firms, Insurance Firms and All of Them Event Date Banks (n=15) Insurance Firms (n=5)
Banks + Insurance Firms (n=20)
ARp CARp θ value ARp CARp θ value ARp CARp θ value
0 -0.0310 -0.0310 -2.468** -0.1154 -0.1154 -5.605*** -0.0521 -0.0521 -4.344*** 1 0.0055 -0.0255 -1.436 0.0029 -0.1125 -3.865*** 0.0048 -0.0473 -2.787*** 2 0.0181 -0.0074 -0.340 -0.0037 -0.1163 -3.260*** 0.0127 -0.0346 -1.666* 3 -0.0005 -0.0079 -0.314 0.0270 -0.0892 -2.167** 0.0064 -0.0282 -1.176 4 0.0079 0.0000 0.002 0.0117 -0.0776 -1.684* 0.0089 -0.0194 -0.721 5 0.0105 0.0106 0.344 -0.0087 -0.0862 -1.710* 0.0057 -0.0136 -0.463 6 -0.0193 -0.0087 -0.261 -0.0127 -0.0990 -1.817* -0.0176 -0.0313 -0.985 7 -0.0103 -0.0190 -0.534 0.0021 -0.0969 -1.664* -0.0072 -0.0385 -1.134 8 -0.0064 -0.0254 -0.674 0.0273 -0.0696 -1.127 0.0020 -0.0365 -1.013 9 -0.0072 -0.0326 -0.821 -0.0135 -0.0831 -1.276 -0.0088 -0.0452 -1.192 10 -0.0088 -0.0414 -0.992 -0.0407 -0.1238 -1.813* -0.0167 -0.0620 -1.558 11 -0.0031 -0.0445 -1.022 0.0245 -0.0993 -1.393 0.0038 -0.0582 -1.401 12 0.0143 -0.0302 -0.667 -0.0033 -0.1027 -1.383 0.0099 -0.0483 -1.117 13 0.0103 -0.0200 -0.424 -0.0229 -0.1256 -1.630 0.0020 -0.0464 -1.033 14 0.0000 -0.0199 -0.409 0.0085 -0.1171 -1.469 0.0022 -0.0442 -0.952 15 -0.0014 -0.0213 -0.424 0.0172 -0.0999 -1.213 0.0032 -0.0410 -0.854 16 -0.0064 -0.0278 -0.536 0.0256 -0.0743 -0.875 0.0016 -0.0394 -0.797 17 0.0027 -0.0250 -0.470 -0.0116 -0.0859 -0.984 -0.0009 -0.0403 -0.791 18 0.0013 -0.0237 -0.433 0.0133 -0.0726 -0.809 0.0043 -0.0359 -0.687 19 0.0017 -0.0220 -0.392 -0.0137 -0.0863 -0.937 -0.0021 -0.0381 -0.710 20 -0.0029 -0.0249 -0.432 0.0144 -0.0719 -0.762 0.0015 -0.0366 -0.666 21 0.0010 -0.0239 -0.406 -0.0004 -0.0723 -0.749 0.0006 -0.0360 -0.640 22 0.0042 -0.0197 -0.327 -0.0002 -0.0725 -0.735 0.0031 -0.0329 -0.572 23 0.0031 -0.0165 -0.269 -0.0021 -0.0746 -0.740 0.0018 -0.0311 -0.529 24 0.0123 -0.0042 -0.067 0.0049 -0.0697 -0.677 0.0105 -0.0206 -0.343 25 0.0080 0.0037 0.058 0.0134 -0.0564 -0.537 0.0093 -0.0113 -0.184 26 0.0142 0.0179 0.275 0.0275 -0.0288 -0.269 0.0175 0.0062 0.100 27 0.0002 0.0182 0.273 0.0118 -0.0170 -0.156 0.0031 0.0094 0.148 28 -0.0059 0.0123 0.181 0.0159 -0.0011 -0.010 -0.0005 0.0089 0.138 29 0.0156 0.0278 0.404 0.0236 0.0225 0.199 0.0176 0.0265 0.403 (*): significant at the 0.1 level
(**):significant at the 0.05 level (***):significant at the 0.01 level t-values are calculated for CARs
This study provides evidence that the 17 August 1999’s earthquake had significantly negative impact not only on banking firms’ but also on insurance firms’ returns. This significant negative impact on stock returns is valid for the whole sample. The detailed examination of the results presented in Table 1 shows that while the significant negative response of insurance firms, in terms of CARs, continues during eight days, the significant negative response of banking firms to the earthquake keep on one trading day.
In the sample of banking firms, the most significant negative reaction to the earthquake belongs to Demirbank and Yaşarbank (abnormal returns are –0,0701 and
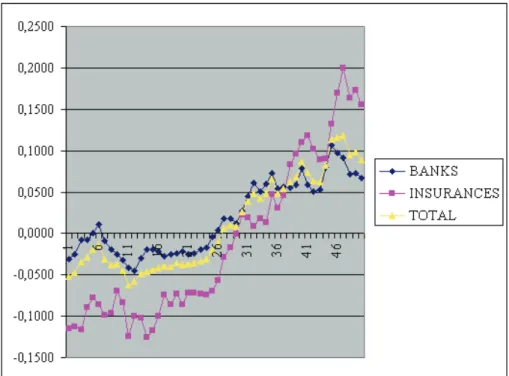
–0,0609 respectively). On the other hand, in the sample of insurance firms, a very significant negative response in the first trading day is valid for all of the firms. Figure 1 presents a comparison of the cumulative abnormal returns through the fifty days after the earthquake date for banking firms, insurance firms and the whole sample.
Figure 1. Cumulative Abnormal Returns
The trend of cumulative abnormal returns during fifty days following the earthquake date is quite interesting. Until twenty-ninth day, although both of the banking and insurance firms reacted negatively to the earthquake, the extent of the reaction is greater for the insurance firms. At the twenty-ninth day, the levels of CARs become equal for both of the sectors. Then the trend changes and the CARs turn out to be positive. Moreover, the size of the positive response is greater for the insurance firms compared to the banking firms. We can presume that the first response of insurance firms supports the following hypothesis of Shelor et al (1992): The rapid depletion of surplus accounts fostered by catastrophic events may cause investors to discount insurance firm stock value. On the other hand, the positive trend of CARs, which begins thirty days after the earthquake supports the hypothesis that insurers may benefit from a catastrophic event because of subsequent increased consumer or institutional demand.
It is worth to note that, in studies with a limited number of event observations, the empirical results can be heavily influenced by one or two firms. Knowledge of this is important for gauging the importance of the results.
5. Conclusion
The 17 August 1999’s earthquake, which had great impact especially on Gölcük, Adapazarı, İzmit, caused serious difficulties for many firms including financial institutions. On 26 August 1999, the first trading day after the earthquake, the stock market (ISE 100 index) had fallen down by -0.1038. In this paper, we have studied only the short-term reaction of financial institutions to the 17 August 1999’s earthquake and ignore potential longer-term effects on cash flows or risk premium effects. We have used the event study methodology in the empirical analysis. We find largely significant abnormal returns, just after the earthquake, for each of the insurance firms studied. The response of banks is negative but the significance level less important.
Overall, our results are important since they support psychological impact of the 17 August 1999’s earthquake in ISE. In terms of implications concerning the market efficiency, it is difficult to presume that ISE is efficient. Based on the results, we can state that, firstly, financial institutions’ stock prices reacted negatively to the “earthquake” but then, in one month, a recovery in the market prices is reestablished, by a considerable increase. The results highlight the fact that earthquake-induced disruptions pose risks that require management attention. This can be considered as a crucial information for the firms operating in Turkey and particularly in Istanbul, which is an earthquake prone region.
References
AHANORY, J., SWARY, I. (1980). Quarterly dividend and earnings announcements and stockholders’ returns: an empirical analysis. Journal of Finance, Vol. 35, No. 1, pp. 1-12.
ASQUITH, P., MULLINS, D.W.. (1983). The impact of initiating dividend payments on shareholders' wealth. Journal of Business, January, pp.77-96. BARRETT, W., HEUSON, A.J., KOLB, R.W., SCHROPP, G.H. (1987). The
adjustment of stock prices to completely unanticipated events. Financial Review, Vol. 22, pp. 345-354.
CAMPBELL, J.Y., LO, A.W., MACKINLAY, A.C. (1997). The econometrics of financial markets. New Jersey, Princeton University Press.
CARTER, D.A., SIMKINS, B.J. (2004). The market’s reaction to unexpected, catastrophic events: the case of airline stock returns and the September 11th attacks. The Quarterly Review of Economics and Finance, Vol. 44, No. 4, pp. 539-558.
CHAREST, G. (1978). Dividend information, stock returns and market efficiency. Journal of Financial Economics, Vol. 6, No. 2/3, pp.297-330.
FIELDS, A., JANJIGIAN, V. (1989). The effect of Chernobyl on electric-utility stock prices. Journal of Business Research, Vol. 18, pp.81-88.
HILL, J., SCHNEEWEIS, T. (1983). The effect of Three Mile Island on electric utility stock prices: a note. The Journal of Finance, Vol. 38, No. 4, pp.1285-1292.
LAMB, R.P. (1995). An exposure-based analysis of property-liability insurer stock values around Hurricane Andrew. Journal of Risk and Insurance, Vol. 62, pp. 111-123.
LAMB, R.P. (1998). An examination of market efficiency around hurricanes. Financial Review, Vol. 33, pp. 163-172.
MACKINLAY, A.C. (1997). Event studies in economics and finance. Journal of Economic Literature, Vol. 35 No. 1, pp. 13-39.
ODABAŞI, A. (1998). Security returns’ reactions to earnings announcements: a case study on the Istanbul Stock Exchange. Boğaziçi Journal: Review of Social, Economic and Administrative Studies, Vol. 12, No. 2, pp.3-19.
SHELOR, R.M., ANDERSON, D.C., CROSS, M.L. (1990). The impact of the California earthquake on real estate firms’ stock value. The Journal of Real Estate Research, Vol. 5, No. 3, pp.335-340.
SHELOR, R.M., ANDERSON, D.C., CROSS, M.L. (1992). Gaining from loss: property-liability insurer stock values in the aftermath of the 1989 California earthquake. Journal of Risk and Insurance, Vol. 59, No. 3, pp.476-488.
YAMORI, N., KOBAYASHI, T. (1999). Is it true that insurers benefit from a catastrophic event? Market reactions to the Hanshin-Awaji earthquake. Pacific Basin Working Paper Series, No:PB99-04. Federal Reserve Bank of San Francisco.