Chemical Concentration Map Building Through Bacterial Foraging
Optimization Based Search Algorithm by Mobile Robots
Mirbek Turduev, Murat Klrtay, Pedro Sousa, Veysel Gazi, and Lino Marques Ahstract-In this article we present implementation of Bac
terial Foraging Optimization algorithm inspired search by multiple robots in an unknown area in order to find the region with highest chemical gas concentration as well as to build the chemical gas concentration map. The searching and map building tasks are accomplished by using mobile robots equipped with smart transducers for gas sensing called "KheNose". Robots perform the search autonomously via bacte rial chemotactic behavior. Moreover, simultaneously the robots send their sensor readings of the chemical concentration and their position data to a remote computer (a base station), where the data is combined, interpolated, and filtered to form an real time map of the chemical gas concentration in the environment.
I. INTRODUCTION
In the recent years interest in using nature inspired op timization algorithms such as Particle Swarm Optimization (PSO), Ant Colony Optimization (ACO), Genetic Algorithms (GA), and Bacterial Foraging Optimization in engineering problems has increased. Since the introduction of the Bacte rial Foraging Optimization algorithm (BFO) by Kevin M. Passino in [1], it has been implemented successfully on various applications such as pollution mapping [2], job shop scheduling problems [3], and path planning optimization for mobile robots [4] to mention a few.
Mobile robot olfaction and odor source localization has been considered in a number of studies [5], [6]. Most of the related studies assume an experiment setup and source localization by a single robot with predetermined naviga tion algorithm for exploring the environment. In [6] odor classification and gas distribution are combined for source localization and gas distribution map building. Also multiple odor sources are used and the resulting gas distribution map is combined with laser range finder and sensor data. In another work Gaussian weighted functions and concentration grid maps are used as techniques to map chemical gas
This work was supported by the Scientific and Technological Research Council of Turkey (TUBiTAK) under grant no 106El22 and by the European Commission under the GUARDIANS Project (FP6 contract No. 045269).
M. Turduev and V. Gazi are with the Dept. of Electrical and Electronics Engineering, TOBB University of Economics and Tech nology, SogiitOzii Cad. No: 43, 06560 Ankara, Turkey. (email:
{mturduev, vgazi }@etu. edu. tr).
M. Klrtay is with Dept. of Computer Technology and Information Systems, Bilkent University, East Campus, 06800 Ankara, Turkey. (email:
[email protected]).
This work was performed while M. Klrtay was a visiting intern in the Swarm Systems Research Laboratory at TOBB University of Economics and Technology.p. Sousa and L. Marques are with Dept. of Electrical and Computer Engi neering, Institute of Systems and Robotics, University of Coimbra, 3030-290 Coimbra, Portugal. (email:
{pvsousa.lino}@isr.uc.pt).
concentration of an unknown environment [7]. Other related works on odor source localization include studies utilizing swarming algorithms [8], [5]. These approaches perform well in static environments. However, most of these applications have difficulties to in locating multiple odor sources in a dynamic environment.
In this article we adapt and use the Bacterial Foraging Optimization algorithm developed in [1] to the chemical concentration map building problem. Bacterial Foraging Op timization is inspired by the chemotactic behavior of the E.coli bacterium in an environment with nutrients. It consist of subsequent tumbles and runs the duration of which are adjusted based on the concentration of the nutrients in the environment and on average results in motion in the direction of increasing nutrient concentration [1]. More information on the behavior of the E.coli can be found [9], [10], [11]. Researchers also have proposed hybrids of the Bacterial Foraging Optimization algorithm. For example, in [12] in order to enhance the performance of the Bacterial Foraging Optimization algorithm Tang and his colleagues inspired by the attraction between particles in the Particle Swarm Optimization algorithm augment the BFO algorithm with cell-to-cell attraction. There are also related works on using bacterial chemotactic behavior in robotic applications. In [13] Dhariwal and his colleagues use bacterium chemotactic behavior for monitoring a gas contaminated environment using mobile robots. They develop a technique which is based on biased random walk for detection and seeking gradient inducing source phenomena. They also implement their algorithm using small robots in a phototaxis experiment. Moreover, they claim that the algorithm is scalable to a large number of robots. Similarly in [2] Oyekan et aI. present a controller for determining a pollution source using a bacteria inspired algorithm. The developed controller is a combination of bacterial chemotactic behavior and flocking behavior. The controller allows to direct a flock of agents to a pollution source and to control the spread of the agents by changing the parameters of the source detection controller. However, according to the authors the controller might fail in a high turbulent environment.
In an earlier article [14], we had developed a decentralized and asynchronous version of the PSO algorithm and imple mented it for the chemical concentration map building prob lem in a real environment with ethanol gas and Khepera III robots. This article constitutes a continuation of the work in [14]. Especially, we use the same experimental setup for the implementations. Furthermore, we modify the Bacterial Foraging Optimization algorithm in [1] in order to better
suit to the application under consideration. In particular, in the BFO algorithm in [1] the bacteria updates are based on discrete dynamics and they can jump from their position to a different location. In contrast, in the implementations here the robots have continuous dynamics and they have to traverse all the path between their current position to their next desired location. Within this perspective the BFO algorithm serves as a high-level path planning and way point generation algorithm for the robots. Moreover, since the robots continue to take measurements during their motion between two subsequent way-point they use this information in the next iteration of the BFO algorithm. In fact, at the next iteration the robots compare their current measurement (at that particular way-point) to the average of the measurements during the traversal of the path between the previous and the current way-points. In addition, we also specify various re orientation restrictions based on the relative values of these measurements. The results are compared with the earlier results in [14].
Note that, there are also important differences between this work and works in [5], [6], [8], [2], [13]. First of all, in this article the robots operate in a real chemical (ethanol gas) environment. With that purpose the robots use an onboard chemical sensing hardware. However previous implementation such as those in [2] and [13] used a photo sensor systems. Moreover, in addition to determining the areas of high concentration of the environment here the robots perform real-time gas concentration map building. The obtained chemical gas concentration map is visualized in real-time on a remote computer (base station).
II. PROBLEM DEFINITION
Autonomous mobile robots can be used in various en vironments including areas which contain dangerous sub stances for living beings. Using multiple cooperating robots in parallel can further increase performance in missions like search and rescue, exploration, coverage, mapping, etc. In this article we consider the problem of building by multiple robots the chemical concentration map of an enclosed envi ronment contaminated with a chemical substance. Moreover, it is required that the robots determine the regions with high chemical concentrations. These regions are expected to appear in the vicinity of the chemical leaks polluting the environment. Furthermore, it is required that the chemical concentration map is built and visualized in real-time on a remote computer. Such applications can occur in, for example, large warehouse under fire [14] where burning of certain chemicals might be really dangerous since certain levels of some chemicals might lead to explosion. Moreover, the composition of the chemical might give an idea of what are the burning materials. All this information can be collected by the robots without endangering the lives of firefighters and critical decisions might be taken (i.e., such as whether to go in or not) based on the information obtained by the robots.
Note that the same problem was considered in [14]. How ever, there a ditlerent algorithm -namely a decentralized and
asynchronous version of the PSO algorithm- was applied in order to achieve the objectives. In this article we implement a modified version of the Bacterial Foraging Optimization algorithm. In particular, we use it as a high-level path planning for the robots, while low-level control is achieved using potential functions.
III. EXPERIMENTAL SETUP
A. Environment and Robots
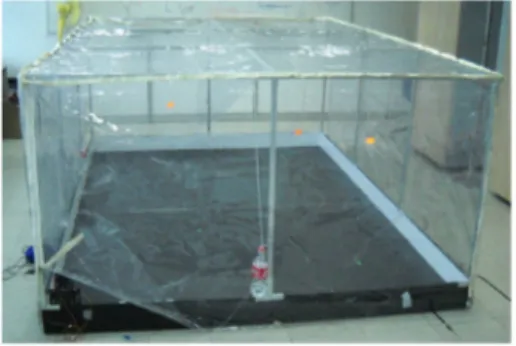
In this section we provide a short description of the experimental setup which is used in the implementations. Note that the same experimental setup was also used in [14]. Therefore, the description here follows along the same lines as the description in [14]. The experiments are performed with KheperalII mobile robots equipped with the "KheNose" sensing system [15] and TGS2620 alcohol sensors manufac tured by Figaro. This type of chemical sensors show decreas ing resistance in the presence of reducing volatile chemicals in the surrounding air. They are often used in mobile robotic systems, because they are inexpensive, highly sensitive, and relatively unatlected by changing environmental conditions such as room temperature and humidity. They are interfaced to the KheperaIII robots through the "KheNose" interface board as shown in Figure 2(b) and described in more detail in the next subsection. The setup consists of experimental arena with no obstacles (shown in Figure 1) and
3.40m
x2.40m
x1.35m
in dimensions. Moreover, the experimental arena is covered by atransparent vinyl cover.
It constitutes a small scale representation of a large building (such as a warehouse) filled with a contaminating chemical gas. Ethanol, which isFig. 1. Enclosed experimental setup.
a volatile and colorless liquid, is used as chemical gas. For that purpose we use an air bubbler system composed of two bottles half filled with ethanol, an air pump, and plastic tubes to inject the evaporated alcohol into the arena. Odor sources are located approximately 60 cm above the ground at the ceiling of the covered area and inject the gas downward. The pressure of the air pump can be adjusted manually between
150mbar - 550mbar.
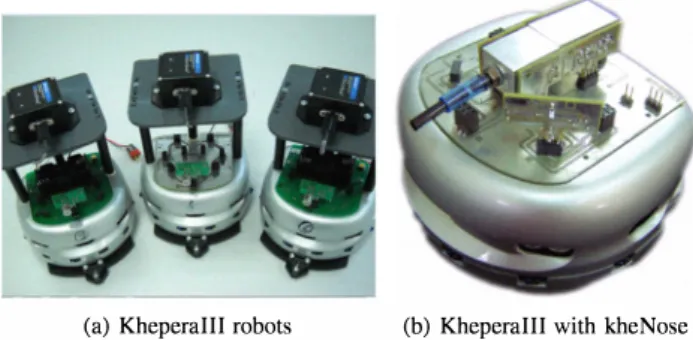
In order to provide gas circulation the front right corner of the covered arena is opened to let air flow inside it. For this implementation KheperaIII robots shown on Figure 2(a) are used. They are equipped with Intel PXA255 processor working at 400 MHz. Movements of the robots are provided by 2 brushless DC servo motors. Robots(a) KheperaIII robots (b) KheperaIII with kheNose Fig. 2. KheperaIII robots equipped with kheNose sensing system and 3DM GX2 Microstrain IMO.
have 11 infrared sensors and 5 ultrasound sensors. The 9 of infrared sensors are located at the periphery of the robot and 2 of them are located underneath it close to it's front. Each motor is controlled by its own PID controller implemented on a PIC 18F4431 microcontroller and this microcontroller which is also used for measuring the odometry information of the robot. In order to determine/measure sensor readings a DSPIC30F50 11 microcontroller working at 60 MHz is used and the sensors communicate with the microcontroller via the
J2C
bus. The motor control blocks also act as slave devices on theJ2C
bus while communicating with the master DSPIC30F5011. For robot odometry correction we used 3DM-GX2 IMUs (Inertial Measurement Units) which are manufactured by MicroStrain, shown on top of the robots in Figure 2(a). The 3DM-GX2 IMU sensor is a high-performance gyro enhanced orientation sensor which utilizes miniature MEMS sensor technology. It combines a triaxial accelerometer, triaxial gyro, triaxial magnetometer, temperature sensors, and an on-board processor running a sophisticated sensor fusion algorithm. The 3DM-GX2 offers a range of output data quantities from fully calibrated inertial measurements (acceleration, angular rate, and magnetic field or relative angle and relative velocity vectors) to computed orientation estimates (pitch and roll or rotation matrix). The IMU is used for improving odometry localization reliability. Orientation errors are dominant in odometry localization system errors. Reduced error rate in orientation is inverse proportional to localization consistency. The IMU devices are integrated to the Khepera III robots to reduce the error rate in robot orientation. Thresholding method is used to integrate the data from the IMUs to the odometry data. Basically, when the change in robot orientation is larger than a predefined treshold, the IMU data is used for calculating the turn rate and therefore for localization, otherwise the odometry data is used for localization.B. Chemical Sensors and KheNose
KheNose is a modular olfactory sensing system for Khep era III mobile robots. This device is composed by a main board, with robot interfacing and processing capabilities, and an array of gas sensing nostrils, a temperature and humidity
sensor, and up to three small thermal anemometer boards. 1
Each sensing board contains a Transducer Electronic Data Sheet (TEDS) stored in an EEPROM memory, providing plug-and-play capabilities to the system [15]. The TEDS contains relevant information about the transducers, namely their type, target gases, range and calibration data. The main board contains a Microchip dsPIC33F controller which ac quires all the analog and digital information from the sensors, processes that data and sends it to the Khepera III KoreBot extension board through an
J2C
interface. The whole system architecture is inspired by IEEE 1451.4 standard for smart sensors. The system can operate as an odor compass, being able to measure airflow intensity and direction while it classifies the detected odors [16]. The odor classification is achieved by means of a feedforward neural network. This classification can be done using the steady-state response of the gas sensor array or, for faster classification, using the coefficients of the discrete wavelet transform of the sensor array transient response [17].1) Calibration of multiple olfactory systems: The conduc tance
G
of tin oxide gas sensors varies with the concentrationC
of a target reducing gas accordingly with following relationship [18](1) where GI is the conductance for a small concentration
CI
of the reducing gas, PR =C ICI
is the relative concentrationof the gas, and n is a constant dependent from the gas and
from the sensor.
In multiple robot olfactory experiments it is fundamental to have the sensing systems calibrated against the same standard values, so the measurements can be merged in a single concentration map. In the current experiments, the response from a single metal oxide gas sensor per KheNose was employed, so the following fast calibration method was implemented:
1) All the employed systems were placed in an enclosed environment where fixed amounts of a target gas (ethanol vapor) could be inserted.
2) The conductance in clean air was registered as
Gair.
3) A small volume of ethanol vapor was inserted intothe calibration space and, after stabilization of the sensors, the conductance corresponding to the existing atmosphere concentration
CI
was registered as GI. 4) The same volume of ethanol was inserted into the calibration space and the conductance G2 corresponding to the concentration
C2
=2C I
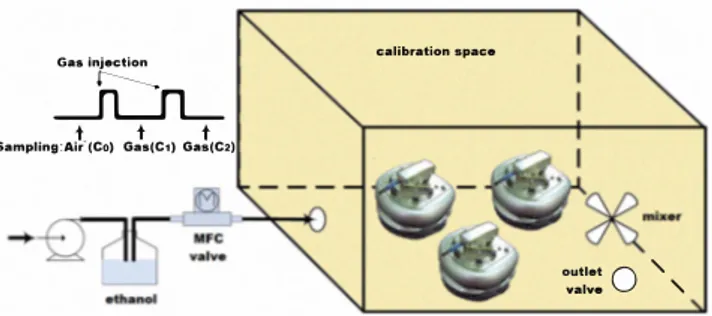
was registered.Fixed amounts of ethanol vapour can be inserted into the calibration space using a large syringe or a Mass Flow Controller, as shown in figure 3. In that figure the robots are inside an acrylic glass calibration box, containing a fan mixer to homogenise the atmosphere.
After the previous calibration procedure, the constant
n of each sensor could be determined. In operation, for 1 In the current work, only the information provided by a Figaro TGS2620 metal oxide gas sensor was employed.
Ga. injection
Jl::rL
t t tcalibration space
Sampling:Air"(Co) Gas(C1) G •• (C2)
-+
Fig. 3. Calibration setup.
outlet 0 "
valv. "
concentrations above
G1,
equation (1) was employed and for concentrations below that value, a linear interpolation between the output to clean air and the output toG1
was employed.C. Potential Functions and Robot Control
In order to navigate and avoid robot to robot collisions artificial potential functions are used for low-level control of the robots. With this objective in order to move the robots to their next way-points we use quadratic attractive potential functions and require the robots to move along their negative gradients. Also, in order to avoid collisions between the robots we use repulsive potential function which is activated when the distances between robots become smaller than a predefined constant value d. The repulsive potential forces are calculated using the readings of the infrared sensors. In addition, because of the noise in the measurements of the infrared sensors, we augment the potential functions based collision avoidance with a priority based robot to robot collision avoidance. In other words, when two robots get in a close collision distance the robot with smaller ID waits until the robot with higher ID avoids the collision and continues on its path.
The robots used in this paper are unicycle agents moving in
]R2
with the dynamicsXi(t)
iJi(t)
Bi(t)
Vi(t) COS(Bi(t)),
Vi(t) sin(BJt)),
Wi(t)
(2)where
Pi (t)
=[
Xi (t), Yi (t)]
is the position vector andBi (t)
is the steering angle of agent
i
at timet.
Its control inputs are the linear speedVi (t)
and the angular speedWi (t).
The implementation operates as follows: robots start the search from a corner of the experimental area with the constant 2.5 cm/sec speed. Their first way-points are assigned intentionally far away from each other whereas the second way points are assigned randomly. The objective of this step is to spread the robots and cover the area as much as possible at start for better mapping of the gas concentration and better performance of the Bacterial Foraging Optimization algorithm. The robots communicate with the base station (a remote computer) using the TCP/IP protocol over a wireless ad-hoc network to share their acquired information of gas concentration and position. After the two initial steps the
robots start a Bacterial Foraging Optimization based search as higher level path planning and determine their next way points using the algorithm by exploiting their measure ments/knowledge. The robots move from their current way points to the next way-points while avoiding obstacles by means of potential functions. This algorithm is expected to achieve convergence of the robots into the regions with highest chemical concentration. Moreover, on the remote PC (i.e, the "Base Station") data are gathered from the robots and a real-time
3D
map of the chemical concentration is obtained. Matlab is used as the main processing and visualization tool in the base station during the search. After the search is concluded we also use a trial version of the Golden Surfer9 software to visualize the final concentration map.IV. BACTERIAL FORAGING OPTIMIZATION A LGORITHM
A. General Specifications of BFO Algorithm
In this section we briefly describe the original Bacterial Foraging Optimization algorithm proposed in [1]. BFO is one of the nature inspired algorithms which tends to imitate basic foraging features of bacteria. In that, bacterial motile behav iors, namely taxes, is triggered by the varying concentration of either nutrients or noxious substances in the environment. Bacteria movements can be categorized into two main motile behaviors which are tumbling and swimming (or running) which are achieved based on the clockwise or counterclock wise rotation of the flagella. Chemical substances in the environment enable bacteria to decide whether to swim or to tumble. The motion of bacteria can be described in terms of run intervals during which the cell swims approximately in straight line alternated with tumbles, when the organism undergoes a random reorientation.
Inspired from this behavior in the Bacterial Foraging Op timization algorithm the chemotactic behavior of the bacteria is represented by two activities which are namely a tumble and a swim. During the
jth
chemotactic step, the position displacement of theith
bacterium can be represented as [1]Bi(j + 1,
r, I)
=Bi(j,
r, l)
+
G(i)¢(j)
(3)where
G(i)
>0,
i
=1,
... , N is basic chemotactic stepsize that defines the length of steps during runs;
Bi (j,
r, I)
indicates the position of theith
bacterium atjth
chemotactic step in therth
reproductive loop of thelth
elimination and dispersion event and¢(j)
is a unit length random direction in thejth
chemotactic step which is generated within the range[0, 27r]
[12]. In other words,G(i)
is the size of the step taken in random biased direction specified by a tumble in each chemotactic step. The bacterium compares the fitness value at the positionBJj + 1,
r, I)
and the fitness value at the positionBi (j,
r, I)
and makes a decision of the next chemotactic step. If the cost value at the positionBi(j+1,
r, I)
is better than the cost value at the positionBi(j,
r, I),
then the bacterium does not perform a tumble and swimsG(i)
step in previously (i.e, the direction determined at the previous tumble) chosen direction¢
(j)
. The bacterium continues its swims in the same direction as long as the new measuredvalues are better than the old values or until a predefined maximum number Ns of swim steps is reached. In contrast, if the cost value at the position
8i
(j+ 1, r,
I)
is worse than the cost value at the position8i
(j,r,
I)
then the bacterium will perform a tumble and a new random unit direction cP(j) is generated.Execution of Ne chemotactic steps, leads the BFO algo rithm to a reproduction step. In this step the algorithm sorts all bacteria according to their own accumulated cost, which depends on the values of the function being optimized (i.e., the fitness) at the positions which the bacteria has visited so far, to distinguish healthy bacteria which are the first half of the population size. Then, bacteria which are located in first half reproduce (i.e. make their own copy) and the bacteria in the second half are eliminated to protect the initial population size.
In nature, external dynamics, unpredictable environmental changes and animals, may apply irresistible force to bacteria colony to move from one place to another. To simulate this event on a bacteria colony, Passino proposed elimination dispersal events Ned in the BFO algorithm which should be repeatedly executed after a certain number of reproduction steps to reach a global optimimum. More information about the BFO algorithm can be found in [I]. Information about the behavior of the E.coli bacteria can be found in [9], [10], [11 ].
B. Implementation of BFO Algorithm on Multi-Robot Search In this section we describe the modified BFO algorithm implemented on the robots. It is little bit different from the BFO algorithm developed in [1] and briefly described above. In particular, we do not employ reproduction steps or elimination dispersal events. Still, the motion of the robots is based on a bacteria foraging type of behavior. In other words, the robots try to imitate bacterial chemotactic behaviors and calculate their way-points based on the BFO algorithm. At each chemotactic step while moving from their current way points to their next way points the robots continuously sense the chemical gas concentration and calculate the average along the path. At their next way-points they compare their readings with the average of the concentration in the traversed path. Based on the sensed information it can exhibit three different behaviors based on cases discussed below.
First, the algorithm takes the absolute difference between the current concentration value
S( curri)
and the calculated average valueS(previ).
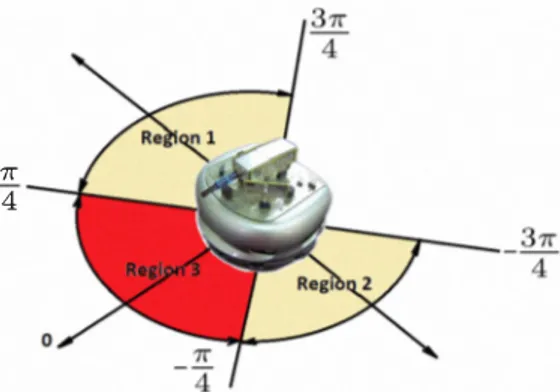
If the obtained value is less than the predefined constant TresholdValue=20, then the robots will change orientation in a random direction whithin the regions 1, 2, and 3 in Figure 4 between -3;
and 3;
radians. This behavior occurs when the environment is homogeneous and there is no significant change in the concentration between chemotactic steps (way-points).In contrast, if the absolute difference between
S( curri)
andS(previ)
is greater than the TresholdValue the algorithm compares the values ofS(curri)
andS(previ)
and if the sensor reading in the current stepS(curri)
is greater than the average obtained during the current stepS(previ),
then the7r 4
Fig. 4. Illustration of tumble and swim.
robot will choose its orientation in a random direction only in region 3 shown in Figure 4 between
- �
and�
and increases randomly its swimming length between 0. 2 and 0.3 in the selected direction similar to the behavior of a bacterium in a nutrient substance. In contrast, if the value ofS(curri)
is less than or equal to the value ofS(previ)
the robot will choose an orientation in random direction in either region 1(�,
3;
) or region 2 (-�
,-3;
) then reduce randomly its swimming length between O. 15 and 0.2 in selected direction.The algorithm can be briefly described by the pseudocode given in Table I, where
Pi
represents the position of theith
agent,S( curri)
refers to sensor reading in current position of theith
robot andS(previ)
is the average of sensor reading between the starting and the ending points of the current chemotactic step. Throughout the chemotactic steps, each robot sends continuously its own sensor readings to the base station. The experiment is continued until50
chemotactic steps are reached. The motion between two chemotactic stepsTABLE I
PSEUDOCODE OF THE ALGORITHM Initialize the variables
Assign the first way points intentionally far Swim (first way-point)
Assign the second way-point randomly Swim (second way-point)
while (Chemotactic steps Ne is not reached) do if (abs(S(curri)-S(previ)) < TresholdValuel) then
Tumble in all Regions ( 1, 2, 3) rand( _ 3
;
, 3;
)Set swim length to 0.1 meters Compute the next way-point Swim (next way-point) else
if (S(curri) > S(previ)) then Tumble in Region 3 rand(
-� , � )
Set swim length to rand(0.2,0.3) meters Compute the next way -pointSwim (next way-point) else
Tumble in Region I or in Region 2 (randomly chosen) Set swim length to rand(0.lS,0.2) meters
Compute the next way-point Swim (next way-point) end if
end if end while
with the simple pseudocode shown in Table II.
TABLE II
PSEUDOCODE OF THE SWIM FUNCTION swim(way-point)
while (Agent has not arrived to its way point) do Move toward the assigned way-point Read concentration data from the environment Send data to base station
if (Collision distance to other robots) then Apply priority based collision avoidance end if
end while
V. EXPERIMENTAL RESULTS
In this section we present the results obtained in the implementation considered. Three Khepera III robots are used in the experiments. Initially they are located in a corner of the experimental area as if they have entered the area from the same entry point such as a door or a gate. After beginning of the experiment the robots move to their predetermined destination points which are intentionally assigned far away from each other in order to cover the experimental area as much as possible. This step results in achieving better chemical concentration map. After execution of this step, the second destination points of the robots are randomly generated. They send their position and "KheNose" sensor data gathered from the environment to the remote computer (base station) through the TCP/IP protocol over a wireless ad-hoc network during the search. The data received by the base station is combined, interpolated, and filtered to form a real-time map of the gas concentration. We used gaussian filter with a
[5, 5]
mask in Matlab for real-time processing and visualization of the obtained maps. Furthermore for visualizing the final maps using the trial version of Golden Surfer9 we used both krigging estimation and a gaussian filter with a[5, 5]
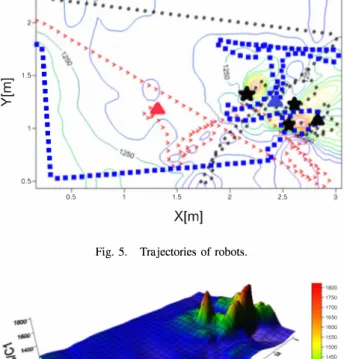
mask which results better extrapolated results. The map (created by Matlab) is visualized in real time as a three dimensional plot to be viewed by the operator. We performed experiments with several different gas source locations in the environment three of which are presented here. For the first case presented in Figures 5 and 6 three sources are placed in the environment at the locations(2.2, 1.3), (2.6, 1.25),
and(2.55, 1).
Figure 5 shows the trajectories of the robots which are superimposed on the contour plot of the extracted final environmental map for an example run. The bold stars in the figure represent the source locations in the environment. The paths of different robots are represented with different type of curves. Colored triangle figures in the contour map are used to indicate the final positions of the robots. As can be seen from the figure at the time when the experiment was terminated two of the robots had already converged to the area near the chemical sources which is basically the region with high gas concentration. The
3D
plot of the obtained final (i.e., at the time the experiment was terminated) ethanol concentration in the environment is shown in Figure 6 which, given the source locations, is in accordance with1.5
E
� 0.5 • • • • • • • • • • • • • 0.5 1.5 2.5 X[m] Fig. 5. Trajectories of robots.Fig. 6. 3D representation of chemical concentration.
0.5 1.5 2.5
X[m] Fig. 7. Trajectories of robots.
,,'" "'" "'" 16'" "'" "'" "'" ,,'" ,,'" "'" "'"
the expectations. The plots presented in Figures 7 and 8 show the results for another run in which there are three gas sources in the environment located at
(2.4, 1.7), (2.45, 1.3),
and(2.3, 1.15).
For this experiment the configuration of the source locations is little bit ditlerent (although not much). For this experiment again the map obtained at the instant the experiment was terminated and shown in Figure 8 makes intuitive sense and two of the robots converge to the region where the sources are located. To better test the performance of the algorithm we performed also experiments in which theFig. 8. 3D representation of chemical concentration.
0.5 1.5 2.5
X[m]
Fig. 9. Trajectories of robots.
Fig. 10. 3D representation of chemical concentration.
"00 1JOO ''''' 1100 1000 900 800
containing gas sources were located relatively far from each other at
(1.2, 0.8), (2.4, 0.55),
and(2.5, 1.7)
and the results for an example run are shown in Figures 9 and 10. As can be seen from Figure 9 for this experiment two of the robots converged to the vicinity of one of the sources while the third robot converged to the vicinity of another source. The obtained concentration map in Figure 10 is once more in accordance with our intuitive expectations. The duration of the experiment takes around 12-15 minutes. Although above we presented the plots obtained at the end of the experiment, as mentioned above, the map was built in real-time as theexperiment was running. In particular, as the experiment was running and the data gathered by the base station the map was periodically refreshed as the data was collected.
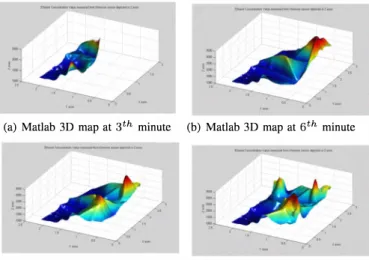
Figure 11 shows the 3D plots obtained in real time using Matlab obtained for the third experiment presented above (in Figures 9 and 10). In particular, the plots are real-time maps based on the data collected until the 3 'th, 6'th, 9'th, and 122th minutes are shown in the figure. Since for these plots extrapolation is not performed the maps are partial maps which are built as the time progresses and more senor data is obtained from the robots. Figures 12 and 13 show
(a) Matlab 3D map at 3th minute (b) Matlab 3D map at 6th minute
(c) Matlab 3D map at 9th minute (d) Matlab 3D map at 12th minute Fig. J 1. 3D maps obtained using Matlab in real-time.
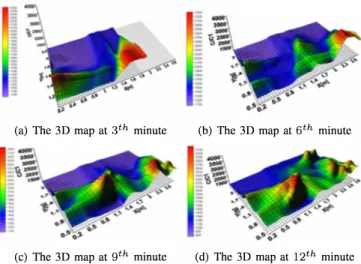
the corresponding intermediate maps obtained using the Surfer9 software. Figure 12 presents the 3D maps, whereas Figure 13 presents the corresponding contour plots of the obtained ethanol concentration. This experiment lasted for about 13 minutes. As one can see from the figures as the exploration progresses and the data gathered by robots from various points of the environment increases the quality of the obtained maps is improved as well.
We would like to mention here that we used three robots in the experiments due to the lack of resources (we had only three "KheNose" interfaces available). It might be possible to obtain better results with larger number of robots. However, one should also note that the experiment arena is also not very large and the performance is also related to the size of the area to be explored.
In an earlier article we had approached the same problem using decentralized asynchronous Particle Swarm Optimiza tion [14]. In the decentralized asynchronous PSO algorithm the agents share their best sensor readings (personal best) with their neighbors resulting in cooperation between agents whereas in the Bacterial Foraging Optimization algorithm used in this article the agents search on their own without information exchange or cooperation. Therefore, when PSO inspired search is used usually the robots gather around the same point in the space which is usually a local maxi mum of the gas concentration (see [14] for more details). Whereas, here the agents can end the search at different
(a) The 3D map at 3th minute (b) The 3D map at 6th minute
(c) The 3D map at 9th minute (d) The 3D map at 12th minute Fig. 12. Intermediate 3D maps obtained using Golden Surfer 9. 22
'.2
0.2 0.4 0.6 0.8 1 1.2 1.4 1.6 1.8 X[m]
(a) The contour map at 3th minute (b) The contour map at 6th minute
1.1 ___ 0.8 ---D.5·D
�
.2�D.fJ
. 5 GD';;
.• 2,.�, ,'"C4 . -',,,:!.7---':2---:-2.'"'"3 -'2"' .• --:'2.9' XlmJ ,.
, D .• D.5l,--,-l.J:.,.-...J...,.-,,"������ 0.2 0.5 0.8 1.1 1.4 1.7 2 2.3 2.6 2.9 Xlm)(c) The contour map at 9th minute (d) The contour map at 12th minute Fig. 13. Intermediate contour maps obtained using Golden Surfer 9.
points in the space. This, however, might be useful in some applications since multiple maxima (possibly leak sources) can be determined. In fact, as one can see from the results in Figure 9 the robots were able to locate two of the gas sources. Experiments show that in both the Asynchronous Decentralized version of PSO in [14] and the BFO algorithm considered here the agents are able to extract a concentration map of the environment. Moreover, the maps seem realistic since the peaks occur in the vicinity of the chemical sources. The results obtained are promising and show that the BFO algorithm can be a viable alternative for gas concentration mapping and possibly source localization.
VI. CONCLUDING REMARKS
In this study chemical concentration map building using Bacterial chemotactic behavior inspired search is performed by mobile robots. The implementation is realized in a laboratory setting with Khepera III robots equipped with
"KheNose" chemical sensing system with Figaro alcohol sensors and real ethanol gas. They are able to build a three dimensional map of the chemical gas concentration and to move to areas with relatively high concentration. It is observed that the results are comparable to those obtained earlier using decentralized asynchronous PSO algorithm. To further improve the performance of the algorithm a cooperation between the robots can also be incorporated in future implementations.
REFERENCES
[I] K. M. Passino, "Biomimicry of bacterial foraging for distributed optimization and control," IEEE Control Systems Magazine, vol. 22, no. 3, pp. 52-67, June 2002.
[2] J. Oyekan, H. Hu, and D. Gu, "Exploiting bacteria swarms for pollution mapping," in IEEE International Conference on Robotics and Biomimetics, Guilin, China, December 2009, pp. 39-44. [3] C. Wu, N. Zhang, J. Yang, and Y. Liang, "Improved bacterial foraging
algorithms and their applications to job shop sheduling problems," Adaptive and Natural Computing Algorithms, vol. 4431, pp. 562-569, July 2007.
[4] C. A. Sierakowsk and L. dos S. Coelho, "Path planning optimization for mobile robots based on bacteria colony approach," Applied Soft Computing Technologies: T he Challenge of Complexity, vol. 34, pp. 187-198, August 2006.
[5] A. T. Hayes, A. Martinoli, and R. M. Goodman, "Distributed odor source localization," IEEE Sensor Journal, vol. 2, no. 3, pp. 260-271, June 2002.
[6] A. Loutfi, S. Goradeschim, A. J. Lilienthal, and 1. Gonzales, "Gas distribution mapping of multiple odour sources using a mobile robot," Robotica, vol. 27, pp. 311-319, March 2009.
[7] T. D. A. Lilienthal, "Building gas concentration gridmaps with mobile robot," Robotic and Autonomous Systems, vol. 48, no. I, pp. 3-16, May 2004.
[8] A. T. Hayes, A. Martinoli, and R. M. Goodman, "Swarm robotic odor localization," in IEEE International Conference on Intelligent Robots and Systems (IROS2001 ), Maui, USA, November 2001, pp. 1073-1078.
[9] H. Berg, E. Coli in Motion. New York: Springer-Verlag, 2004. [10] T. Kima, S. H. Jungb, and K. Cho, "Investigations into the design
principles in the chemotactic behavior of escherichia coli," Biosystems, vol. 91, no. I, pp. 171-182, January 2008.
[11] M. Eisenbach and S. R. Caplan, "Bacterial chemotaxis: Unsolved mystery of the flagellar switch," Current Biology, vol. 8, no. 13, pp. 444-446, June 1998.
[12] W. J. Tang, Q. H. Wu, and J. R. Saunders, "Bacterial foraging algo rithm for dynamic environments," in IEEE Congress on Evolutionary Computation, BC, Canada, July 2006, pp. 1324-1330.
[13] A. Dhariwal, G. S. Sukhatme, and A. A. Requicha, "Bacterium inspired robots for environmental monitoring," in IEEE International Conference on Robotics and Automation (ICRA2004), New Orleans, Louisiana, USA, April 2004, pp. 1436-1443.
[14] M. Turduev, Y. Atas, P. Sousa, V. Gazi, and L. Marques, "Co operative chemical concentration map building using decentralized asynchronous particle swarm optimization based search algorithm by mobile robots;' in IEEEIRSJ International Conference on Intelligent Robots and Systems (IROS2010), Taipei, Taiwan, 2010, accepted for publication.
[15] J. Pascoal, P. Sousa, and L. Marques, "Khenose - a smart transducer for gas sensing," in 1 1 th International Conference on Climbing and Walking Robots and the Support Technologies for Mobile Machines (CIAWAR2008), Coimbra, Portugal, 2008.
[16] L. Marques, N. Almeida, and A. T. de Almeida, "Olfactory sensory system for odour-plume tracking and localization," in IEEE Interna tional Conference on Sensors, Toronto, Canada, 2003.
[17] N. Almeida, L. Marques, and A. T. de Almeida, "Fast identification of gas mixtures through the processing of transient responses of an electronic nose," in EuroSensors, Guimaraes, Portugal, 2003. [18] N. Barsan and A. Tomescu, "Calibration procedure for sn02-based gas