EFFECTS OF AUDITORY ATTENTION ON
LANGUAGE REPRESENTATION ACROSS
THE HUMAN BRAIN
a dissertation submitted to
the graduate school of engineering and science
of bilkent university
in partial fulfillment of the requirements for
the degree of
doctor of philosophy
in
electrical and electronics engineering
By
¨
Ozg¨
ur Yılmaz
September 2019
EFFECTS OF AUDITORY ATTENTION ON LANGUAGE REPRE-SENTATION ACROSS THE HUMAN BRAIN
By ¨Ozg¨ur Yılmaz September 2019
We certify that we have read this dissertation and that in our opinion it is fully adequate, in scope and in quality, as a dissertation for the degree of Doctor of Philosophy.
Tolga C¸ ukur(Advisor)
Emine ¨Ulk¨u Sarıta¸s C¸ ukur
Emre Akba¸s
H¨useyin Boyacı
H¨useyin Cem Boz¸sahin
Approved for the Graduate School of Engineering and Science:
ABSTRACT
EFFECTS OF AUDITORY ATTENTION ON
LANGUAGE REPRESENTATION ACROSS THE
HUMAN BRAIN
¨
Ozg¨ur Yılmaz
Ph.D. in Electrical and Electronics Engineering Advisor: Tolga C¸ ukur
September 2019
Humans can effortlessly identify target auditory objects during natural listening and shift their focus between different targets. Unique allocation of brain re-sources would be inefficient for semantic search task. Here, we hypothesize that auditory attention shifts tuning of cortical voxels toward target category and that attention expands the representation of target words while compressing the rep-resentation of behaviorally irrelevant words across cortex. To test, we designed an fMRI experiment with a semantic search task. Subjects listened to natural stories twice while searching for words that are semantically related to either ‘hu-mans’ or ‘places’. Fit voxelwise models for two attention tasks were compared to identify semantic tuning shifts in single voxels. Results indicate that atten-tion shifts semantic tuning of single voxels broadly across cortex and attenatten-tion warps language representation in favor of target words across cortex. We also introduced a novel feature regularization in voxelwise modeling for a naturalistic movie experiment. Feature regularization simply enforces similar model weights over semantically related stimulus features. We tested the proposed method on an fMRI experiment with naturalistic movies. Results suggest that the pro-posed method offer improved sensitivity in modeling of single voxels. Moreover, we proposed a novel method to improve the sensitivity of phase-sensitive fat-water separation in balanced steady-state free precession (bSSFP) acquisitions. In bSSFP applications using phased-array coils, reconstructed images suffer a lot from spatial sensitivity variations within individual coils. To improve, we first performed region-growing phase correction in individual coil images, then used a linear combination of phase-corrected images. Tests on SSFP angiograms of the thigh, lower leg, and foot suggest that the proposed method enhances fat–water separation in phased-array acquisitions with improved phase estimates.
Keywords: Computational Neuroscience, fMRI, Voxelwise Modeling, Tuning Shift, SSFP, Fat-Water Separation.
¨
OZET
˙IS¸˙ITSEL D˙IKKAT˙IN D˙IL˙IN BEY˙IN ¨
UZER˙INDEK˙I
G ¨
OSTER˙IM˙INE ETK˙ILER˙I
¨
Ozg¨ur Yılmaz
Elektrik ve Elektronik M¨uhendisli˘gi, Doktora Tez Danı¸smanı: Tolga C¸ ukur
Eyl¨ul 2019
˙Insanlar do˘gal dinleme sırasında kolaylıkla i¸sitsel hedefleri saptayabilmekte ve farklı hedeflere odaklarını kaydırabilmektedir. Beyin kaynaklarının sabit b¨ol¨u¸s¨um¨u durumunda i¸sitsel arama performansı zorla¸sırdı. Biz, hipotezimizde i¸sitsel dikkatin kortikal voksellerin uyumlamasını hedef kategoriye kaydırdı˘gını ve hedef kelimelerin korteksteki g¨osterimini geni¸sletti˘gini ileri s¨urmekteyiz. Hipotez-imizi denemek i¸cin, anlamsal dikkat g¨orevi i¸ceren bir fMRI deneyi dizayn et-tik. Denekler do˘gal hikayeleri bir kez ‘insanlar’ ile ilgili kelimelere bir kez de ‘mekanlar’ ile ilgili kelimelere dikkatlerini vererek dinledi. Sonu¸c olarak dikkatin korteks genelinde voksellerin anlamsal uyumlamasını kaydırdı˘gını ve dilin g¨osterimini hedef kelimeler lehine yamulttu˘gunu g¨ozlemledik. Buna ilaveten voksel tabanlı modellemeye yeni bir ¨oznitelik d¨uzenlile¸stirme ekledik. ¨Oznitelik d¨uzenlile¸stirme anlambilimsel olarak benzer uyartı ¨ozniteliklerinin benzer model a˘gırlıkları almasını zorlar. Sonu¸clar bu y¨ontemin tekil voksellerin modellen-mesinde geli¸smi¸s hassasiyet sundu˘gunu g¨osterdi. Bunlara ilaveten, denge-lenmi¸s kararlı-hal serbest devinim (bSSFP) kazanımlarında faza duyarlı ya˘g-su ayrımını geli¸stirecek yeni bir y¨ontem sunduk. Faz kaydırmalı bobin dizisi i¸ceren bSSFP uygulamalarında, geri¸catılmı¸s g¨or¨unt¨uler bireysel bobinlerdeki uzamsal hassasiyet de˘gi¸skenliklerinden k¨ot¨u etkilenmektedir. Y¨ontemimizde, ¨once ayrı ayrı bobin g¨or¨unt¨ulerinde b¨olge-b¨uy¨utme faz d¨uzeltme yaptık, sonra do˘grusal d¨uzeltilmi¸s g¨or¨unt¨ulerin optimal do˘grusal kombinasyonunu elde ettik. Uyluk, alt bacak ve ayak SSFP anjiyogramlarında yaptı˘gımız testlere g¨ore ¨onerdi˘gimiz y¨ontem faz-kaydırmalı kazanımlarda ya˘g-su ayrımı geli¸smi¸s faz tahminleriyle iy-ile¸stirmektedir.
Anahtar s¨ozc¨ukler : Hesaplamalı Sinirbilim, fMRI, Voksel Tabanlı Modelleme, Uyumlama Kayması, SSFP, Ya˘g-Su Ayrımı.
Acknowledgement
Firstly, I would like to express my sincere gratitude to my advisor Prof. Tolga C¸ ukur for the continuous support of my study, for his endless patience, motiva-tion, and immense knowledge. His personal and academic guidance helped me in all the time of research and writing of this dissertation. I could not have imagined having a better advisor and mentor for my study.
Besides my advisor, I am thankful to the rest of my thesis committee, Prof. Emine ¨Ulk¨u Sarıta¸s C¸ ukur, and Prof. Tolga Esat ¨Ozkurt for their invaluable comments and encouragement. I want to also thank my jury members, Prof. H¨useyin Boyacı, Prof. H¨useyin Cem Boz¸sahin, and Prof. Emre Akba¸s for all the insightful comments and suggestions they provide me to finalize my dissertation.
I would like to thank the following funding agencies for supporting the work in this dissertation: the Military Electronics Industries through ASELSAN PhD Scholarship, the Scientific and Technological Research Council of Turkey through TUBITAK BIDEB-2211, and the BAGEP Award of the Science Academy.
I want to thank my friends Kamil Nar, Sami Bolat, Alican Y¨uksel, Toygan Kılı¸c, Alper ¨Ozaslan, Efe Ilıcak, Murat Kocao˘glu, H¨useyin ˙Inan, Ergin Din¸c, Koray Ertan, ¨Omer Arol, Emin C¸ elik, and Salman Dar for all the memorable moments we lived together. I will always appreciate their support and gen-uine friendship. Special thanks to my dearest K¨ubra for her invaluable support throughout preparing my thesis presentation and my life in general.
I would like to thank my psychological counselors S¸ule Atasoy and S¸afak Atay for their various contributions to my life. I am particularly grateful to Muhittin S¸iro for his unconditional support during my elementary education.
Last but not the least, I want to thank my beloved family: my mother Yıldız Yılmaz, my father Zeynel Yılmaz, my sister G¨uliz Yılmaz, and my uncle Sinan Yapku for their endless support throughout my entire life.
Contents
1 Background 1
2 Category-based Attention in Natural Speech Warps Semantic
Maps in the Human Cortex 4
2.1 Introduction . . . 4 2.2 Methods . . . 8 2.2.1 MRI Protocols . . . 8 2.2.2 Subjects . . . 8 2.2.3 Experimental Procedure . . . 8 2.2.4 ROI Abbreviations . . . 9 2.2.5 Functional Localizers . . . 10 2.2.6 Data Pre-processing . . . 11
2.2.7 Head Motion and Physiological Regressors . . . 12
2.2.8 Semantic Model Construction . . . 12
2.2.9 Voxelwise Model Estimation and Validation . . . 13
2.2.10 Construction of the Semantic Space . . . 14
2.2.11 Tuning Shift Index . . . 15
2.2.12 Control Analysis in the Absence of Target Stimuli . . . 16
2.2.13 Behavioral Analysis . . . 17
2.2.14 Significance of Attentional Modulations . . . 17
2.2.15 Construction of Control Models . . . 18
2.2.16 Cortical Flat Maps . . . 18
2.3 Results . . . 19
CONTENTS vii
2.3.2 Attention Shifts Semantic Tuning towards the Target
Cat-egory . . . 23
2.3.3 Attention Shifts Semantic Tuning in the Absence of Targets 26 2.3.4 Attention Warps Semantic Representation . . . 26
2.3.5 Discussion . . . 27
3 Informed Feature Regularization in Voxelwise Modeling for Nat-uralistic fMRI Experiments 38 3.1 Introduction . . . 38 3.2 Methods . . . 41 3.2.1 MRI Protocols . . . 41 3.2.2 Subjects . . . 42 3.2.3 Experimental Procedure . . . 42 3.2.4 ROI Abbreviations . . . 42 3.2.5 Functional Localizers . . . 43 3.2.6 Data Pre-processing . . . 44
3.2.7 Cortical Flat Maps . . . 44
3.2.8 Category Model . . . 45
3.2.9 Voxelwise Model Estimation and Validation . . . 45
3.2.10 Parameter Optimization . . . 47
3.2.11 JI-VM Model Estimation and Validation . . . 49
3.2.12 Pseudo-code for JI-VM Implementation . . . 50
3.2.13 FI-VM Model Estimation and Validation . . . 52
3.2.14 SI-VM Model Estimation and Validation . . . 52
3.2.15 Pseudo-code for SI-VM Implementation . . . 52
3.2.16 Feature Coherence Analysis . . . 53
3.2.17 Spatial Coherence Analysis . . . 54
3.2.18 Noise Ceiling . . . 55
3.3 Results . . . 55
3.3.1 Prediction Scores of VM Methods . . . 55
3.3.2 Selectivity for Model Features . . . 56
3.3.3 Feature Coherence and Spatial Coherence of Model Weights 58 3.4 Discussion . . . 61
CONTENTS viii
4 Enhanced Phase-Sensitive SSFP Reconstruction for Fat-Water
Separation in Phased-Array Acquisitions 70
4.1 Introduction . . . 70
4.2 Methods . . . 72
4.2.1 Dual-Acquisition PS-SSFP Reconstruction . . . 72
4.2.2 PS-SSFP for Phased-Array Acquisitions . . . 73
4.2.3 Alternative PS-SSFP Reconstructions . . . 76 4.2.4 Experiments . . . 78 4.3 Results . . . 82 4.4 Discussion . . . 84 5 Conclusion 89 A Supplementary Figures-1 107 B Supplementary Figures-2 122
List of Figures
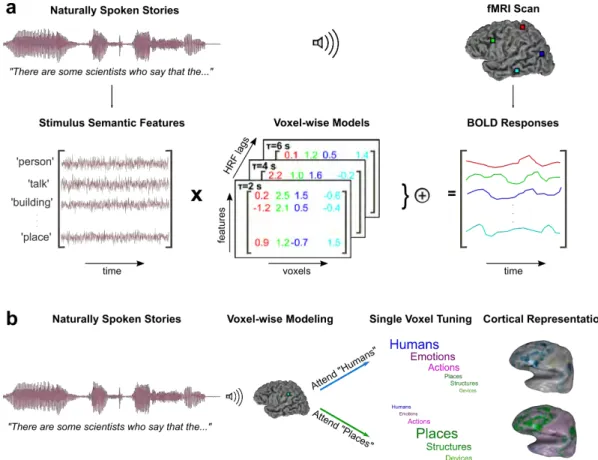
2.1 Attention warps semantic representation of words in fa-vor of attended categories. The tuning-shift hypothesis pre-dicts that attention warps semantic representation in favor target categories. During passive listening, words are represented in a continuous semantic space where semantically related words ap-pear in nearby locations. Attention to a specific word category expands the representation of words that are semantically similar to the attended category, while compressing the representation of words semantically dissimilar to the attended category. . . 6 2.2 Natural semantic search in spoken narratives. (a) During
the semantic search experiment, five subjects listened to three nat-urally spoken stories while attending to words that belonged to either one of two target categories: humans or places. Whole-brain BOLD responses were acquired. To estimate semantic tun-ing in stun-ingle voxels, we fit voxelwise models that optimally predict measured BOLD responses in terms of the semantic features of the story stimuli. To account for hemodynamic delays, a finite impulse response filter was used for each semantic feature. The voxelwise tuning vectors were then averaged across different time delays. The resulting semantic tuning vectors describe how words in the story stimulus evoke BOLD responses. (b) Semantic tuning was estimated separately for each attention task. Tuning changes in single voxels are a unique, diagnostic aspect of the tuning-shift hypothesis. To test this hypothesis, we measured changes in voxel tuning between the two attention tasks. . . 7
LIST OF FIGURES x
2.3 Attentional tuning changes for a representative voxel in intraparietal sulcus. Semantic tuning vectors of a well-modeled voxel within IPS, in subject S1, for the two attention tasks. To sim-plify visualization, only a subset of words that are either neutral, semantically related to humans, or semantically related to places are shown. The color and location of the words reflect their coordi-nates in the semantic space, e.g., red-magenta words are related to the humans category whereas blue-purple words are related to the places category (see 2.2.10). The size of each word represents the magnitude of the evoked BOLD response. This voxel has a predic-tion score of 0.401 and exhibits significant attenpredic-tional modulapredic-tion (t test, q(FDR) < 0.05). The voxel is strongly tuned for words related to the target category in both tasks, and weaker tuning is observed for behaviorally irrelevant words. . . 20 2.4 Caption next page. . . 31
LIST OF FIGURES xi
2.4 Attentional modulation of semantic tuning across cortex. (a) Distribution of semantic tuning during passive listening (sub-ject S1, left hemisphere). The boundaries of functional ROIs are shown with white lines (See 2.2.4 for ROI abbreviations). Major anatomical landmarks and sulci are marked with gray lines. A three-dimensional semantic space was derived by principal com-ponent analysis on voxelwise tuning vectors measured during the passive listening task. Semantic tuning vectors were then projected onto the first three principal components, which were assigned to red, green and blue color channels. Yellow/green voxels are more selectively tuned for human-related words, whereas blue/purple voxels are more selectively tuned for place-related words. Regions of signal dropout, motor areas and insignificant voxels are shown in gray. (b) Distribution of semantic tuning during search for hu-mans. While attending to humans, many voxels in posterior areas that are tuned to places under passive listening (e.g., Cingulate Sulcus, IPS) shift their tuning away from places. Voxels that are not tuned for humans under passive listening (e.g., in Precentral Sulcus, Frontal Gyrus, and FEF) shift their tuning toward humans. (c) Distribution of semantic tuning during search for places. While attending to places, many voxels in posterior areas that are tuned to humans under passive listening (e.g., Cingulate Sulcus) shift their tuning away from humans, and voxels that are not tuned for places under passive listening (e.g., in Frontal Gyrus, and Precen-tral Sulcus) shift their tuning toward places. These results indicate that many cortical voxels shift their semantic tuning toward target word categories. . . 32 2.5 Caption next page. . . 33
LIST OF FIGURES xii
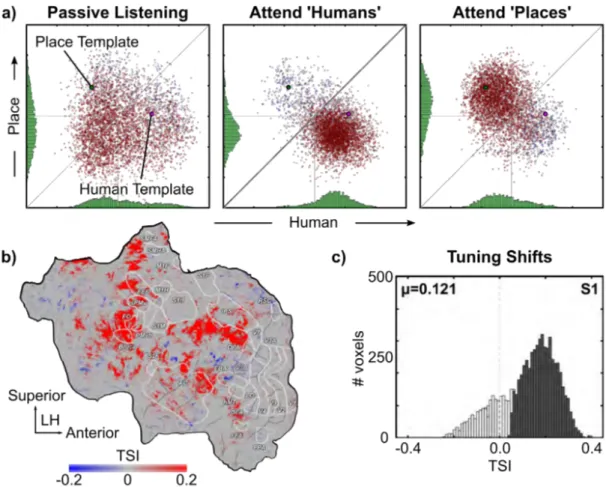
2.5 Attention shifts tuning of single voxels. (a) To assess at-tentional changes in tuning of single voxels, we projected tuning vectors onto the first two dimensions of a semantic space. The se-mantic space was derived via principal component analysis (PCA) of voxelwise tuning vectors measured in a separate passive listen-ing task. Only well-modeled voxels are shown (which exhibit sig-nificant attentional modulation and have prediction score greater than 1 s.d. above the mean). Each voxel is represented with a dot whose color indicates the tuning-shift index (TSI; see color bar in (b)). The projections of idealized human and place tem-plates onto the semantic space are shown with two large dots. The marginal distributions of selectivity for humans and places are dis-played with histograms in green. Many well-modeled voxels shift their tuning toward the target categories (Wilcoxon signed-rank test, q(FDR) < 0.05). (b) Voxelwise TSIs were projected onto the cortical flat map of the left hemisphere for subject S1. Vox-els in many brain areas implicated in attention control including frontal operculum (FO), frontal eye fields (FEF), and intraparietal sulcus (IPS), in language comprehension including Broca’s area (Broca), Wernicke’s area (WER), supramarginal gyrus (SupMG), and inferior frontal gyrus (IFG) shift their tuning toward the target category. In contrast, voxels in posterior cingulate cortex (PCC) and angular gyrus (AngG) which partly overlap with the default mode network shift their tuning away from the target. This result suggests that the default mode network areas play a role in dis-tractor suppression and error monitoring during semantic search tasks. (c) Histogram of the TSIs for well-modeled voxels (8401 vox-els). Significantly positive TSIs are represented by dark gray bars and significantly negative TSIs are represented by light gray bars (Wilcoxon signed-rank test, q(FDR) < 0.05). The average TSI value is significantly greater than 0 (Wilcoxon signed-rank test, P < 0.05). These results indicate that attention shifts tuning of most well-modeled voxels toward the target. . . 34
LIST OF FIGURES xiii
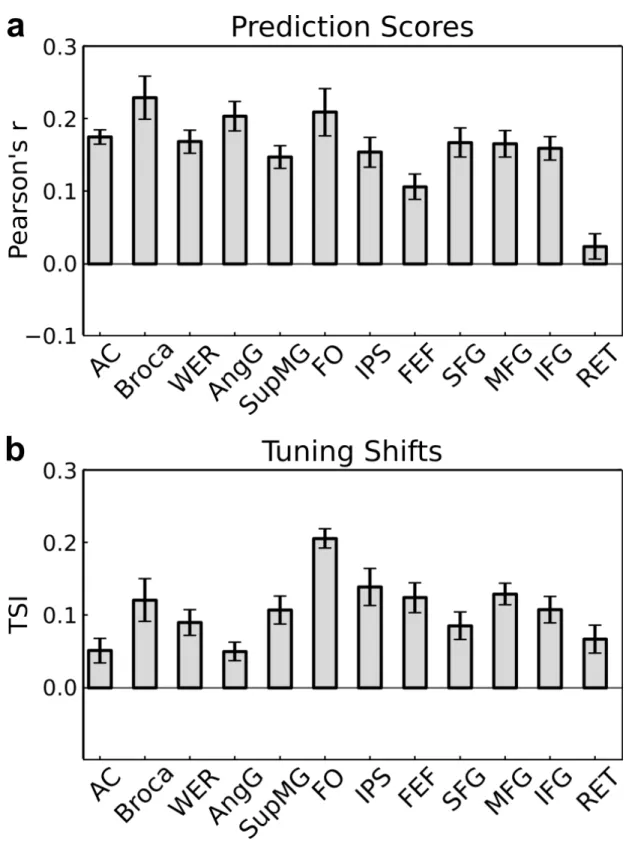
2.6 Caption next page. . . 35 2.6 Tuning shifts in functional ROIs. (a) Prediction scores are
re-ported in functional ROIs as mean ± s.e.m. across subjects. The average prediction score is 18.65 ± 1.75% in language comprehen-sion areas (Broca, SupMG, AngG, WER), and 15.72 ± 2.50% in attention control areas (FO, FEF) (See 2.2.4 for ROI abbrevia-tions). (b) Tuning shift indices are reported as mean ± s.e.m. across subjects. Only significantly predicted voxels are consid-ered (t test, q(FDR) < 0.05) Attention causes varying levels of semantic tuning shifts in different functional ROIs. TSI is small in early auditory areas (AC), but larger in brain areas that corre-spond to later stages of language processing (WER and SupMG). The largest TSI values are seen in frontal areas that take part in language comprehension (Broca) and attention control (FO, FEF, IPS). This result implies that attentional tuning shifts become pro-gressively stronger toward later stages of language processing and attention control. . . 36
LIST OF FIGURES xiv
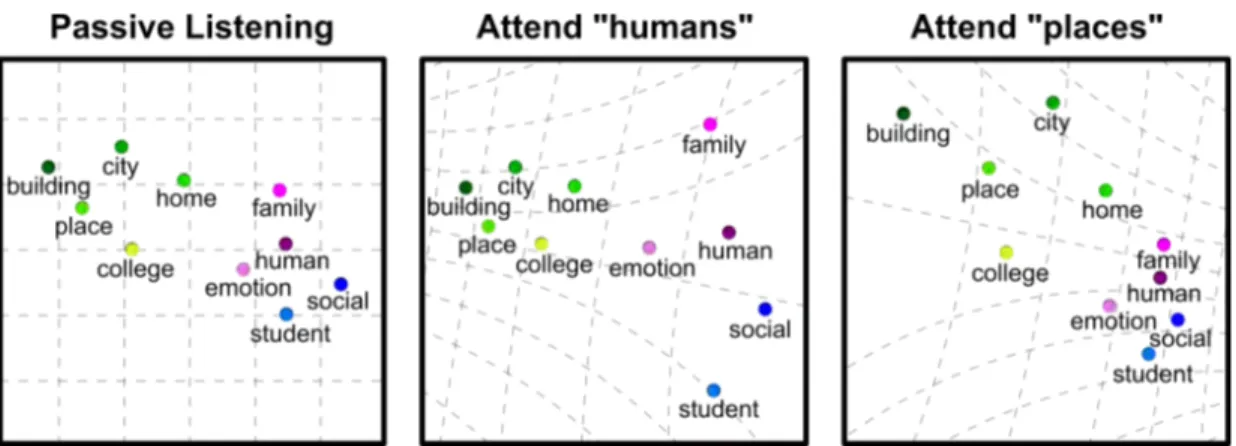
2.7 Topology of the semantic space under passive listening and search tasks. The tuning-shift hypothesis predicts that attention to a specific word category expands the semantic representation of target words while compressing the representation of the non-target words. To test this prediction, we estimated the topology of the semantic space independently under passive listening and the two attention tasks. PCA was performed separately on vox-elwise semantic tuning vectors estimated during each task. The coefficients of a set of basic words in the first two PCs were used to visualize the topology of the semantic space. During attention tasks, words that are semantically related to the target category expand their representation, and words dissimilar to the target cat-egory are compressed. To quantify the degree of attentional warp in the semantic space, we computed a semantic warping index (see Methods). A warping index greater than 1 indicates that target words are more broadly spread in the semantic space compared to non-target words. A warping index less than 1 indicates that target words are more compactly spread in the semantic space compared to non-target words. We find that the semantic warping index is significantly greater than 1 consistently across subjects (Wilcoxon signed-rank test, P < 0.05). These findings indicate that tuning shifts in cortex warp semantic representation in favor of attended words while compressing the representation of irrelevant words. . 37
LIST OF FIGURES xv
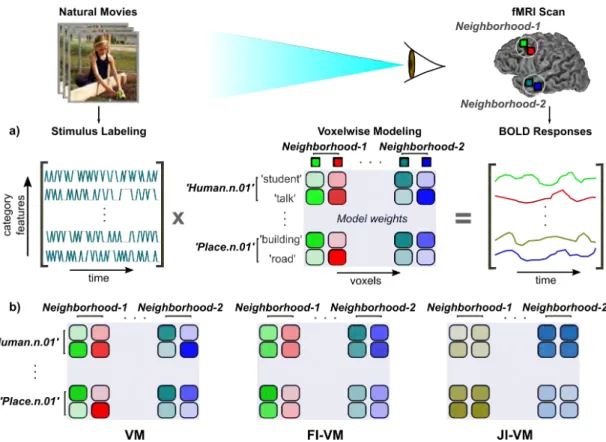
3.1 Natural movie experiment and model fitting. (a) Whole-brain BOLD responses were acquired while subjects viewed nat-ural movies. To estimate functional selectivity in single voxels, we fit voxelwise models that optimally predict measured BOLD responses in terms of the category features present in the movie stimuli [1]. The resulting models describe how each of 1705 object and action categories in the movie stimulus evoke BOLD responses. (b) Classical VM ignores potential correlations in stimulus features and correlations among neighboring voxels. FI-VM takes into ac-count correlation among model features to increase accuracy in predicting single voxel selectivity. The resulting models have creased feature coherence. JI-VM further incorporates shared in-formation between neighboring voxels. The resulting voxelwise models have both increased feature and spatial coherence. . . 40
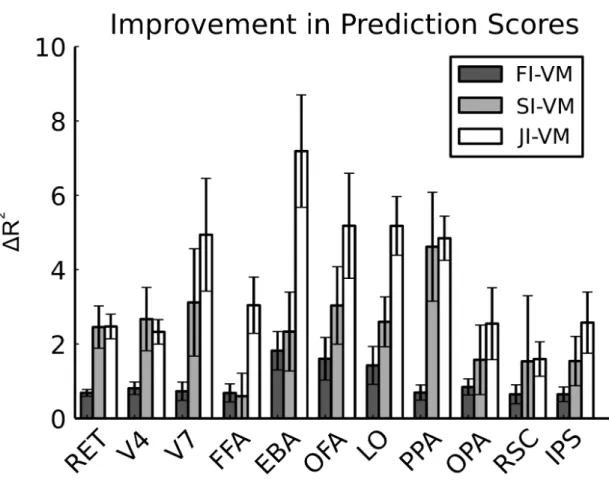
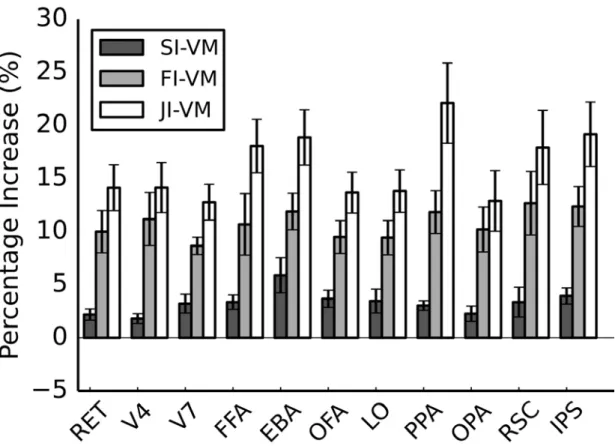
3.2 Improvement in prediction performance over VM by
FI-VM, SI-FI-VM, and JI-VM. The improvement in prediction per-formances for the three methods (FI- , SI- , JI-VM) over VM are shown for several well-known functional ROIs. Bar graphs display improvement in prediction scores (∆R2, mean ± s.d. across
sub-jects, see 3.2.9 for the definition of prediction scores). Each of the three methods significantly improves prediction scores in all ROIs (P < 0.05, Bootstrap test). For FI-VM, improvement in prediction score is higher in category-selective areas than in early visual areas (1.09 ± 0.19 vs 0.74 ± 0.10). For SI-VM, improvement is substan-tial in category-selective areas (2.75 ± 0.55) and in early visual areas (2.43 ± 0.50). JI-VM yields significantly higher prediction scores than all competing methods in all ROIs except V4 and RSC (P < 0.05, Bootstrap test). Improvement in prediction score is higher in category-selective areas than early visual areas (4.57 ± 0.56 vs 3.25 ± 0.59). These results imply that spatial and fea-ture regularization improve model performance particularly across category-selective areas. . . 57
LIST OF FIGURES xvi
3.3 Cortical distribution of optimal L2-norm regularization parameter. The L2-regularization parameters over model
fea-tures in four methods (VM, FI-VM, SI-VM, JI-VM) are visual-ized on the right hemisphere of subject S1. VM strictly penalizes model weights broadly across cortex. High regularization param-eters reduce sensitivity in measuring voxelwise functional selectiv-ity. Here, we incorporate additional regularization terms across features and across voxel neighborhoods. As such, the proposed method should limit unnecessary penalization of model weights by L2-regularization. As a result, compared to VM, FI-VM applies
less weight regularization particularly in category-selective areas, early visual areas, and frontal gyrus. Overall, JI-VM enforces the lowest weight penalization among the competing methods consis-tently across cortex. These results imply that both spatial and fea-ture regularization alleviate the need for L2-regularization, thereby
increasing sensitivity in measuring voxelwise functional selectivity. 59 3.4 Caption next page. . . 64
LIST OF FIGURES xvii
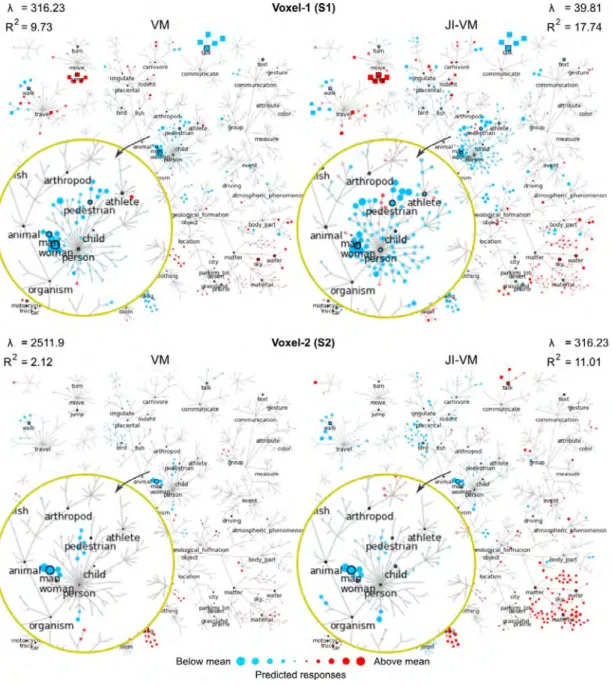
3.4 Functional selectivity in a single voxel. Functional selectiv-ity of two well-modeled voxels in EBA are visualized for several object and action categories organized under the WordNet hier-archy. Each node represents the estimated response of the voxel to the labeled object or action category. Red nodes correspond to categories that evoke above-mean responses and blue nodes corre-spond to categories that evoke below-mean responses. Sizes of the nodes indicate the magnitude of the evoked responses. In the proposed approach, we incorporate feature and spatial reg-ularization that limit unnecessary penalization of model weights by L2-regularization (λ = 316.23 vs. λ = 39.81 for voxel-1 and
λ = 2511.9 vs λ = 39.81 for voxel-2), while improving prediction scores (R2 = 9.73 vs. R2 = 17.74 for voxel-1 and R2 = 2.12 vs.
R2 = 11.01 for voxel-2). As a result, in VM, the model weights
are relatively suppressed compared to JI-VM. Furthermore, fea-ture regularization enforces assignment of more similar weights to correlated categories in voxelwise models. For example, in voxel-1, model weights of the subordinate categories of ‘person.n.01’ (e.g., man, woman, child...) are closer to each other in JI-VM compared to VM. Taken together, these results imply increased sensitivity in capturing functional selectivity. . . 65
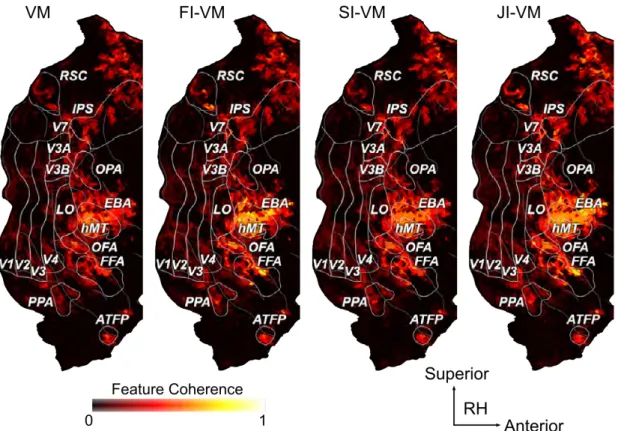
3.5 Feature coherence for VM, FI-VM, SI-VM, and JI-VM.
Feature coherence for subject S1 is shown on the posterior part of the right hemisphere. VM ignores potential feature correla-tions in the stimulus so it has reduced sensitivity to coherence in stimulus features. Informed feature regularization enforces similar model weights for correlated model features. Therefore, feature coherence of FI-VM and JI-VM is higher than that of VM and SI-VM across many cortical regions including category-selective areas, early visual areas, RSC, IPS, and ATFP. These results in-dicate that informed feature regularization better captures feature coherence broadly across visual cortex. . . 66
LIST OF FIGURES xviii
3.6 Feature coherence across functional ROIs. Bar graphs dis-play increases in feature coherence by three methods (SI-VM, FI-VM, JI-VM) over VM (mean ± std across subjects). Feature co-herence of FI-VM and JI-VM models is significantly higher than that of VM in all functional ROIs (P < 0.05, Bootstrap test). The average increase in category-selective areas is 10.84 ± 0.91% for FI-VM and 17.29 ± 1.42% for JI-VM, whereas the average in-crease in early visual areas is 9.94 ± 1.05% for FI-VM and 13.67 ± 1.13% for JI-VM. In contrast, SI-VM that lacks feature regulariza-tion has relatively limited increase in feature coherence across all ROIs. These results suggest that informed feature regularization increases functional coherence in cortical representations particu-larly in high-level visual areas. . . 67 3.7 Spatial coherence for VM, FI-VM, SI-VM and JI-VM.
Spa-tial coherence for subject S1 is shown on the posterior part of the right hemisphere. VM ignores correlations among voxel neighbor-hoods so it has reduced sensitivity to spatial coherence in cortical representations. Spatial regularization enforces increased spatial coherence among cortical representations within voxel neighbor-hoods. Although, FI-VM and VM have relatively similar spatial coherence values, SI-VM and JI-VM yields higher spatial coher-ence consistently across many cortical regions including category-selective areas, early visual areas (V1-V4), IPS, RSC and ATFP. These results suggest that spatial regularization better captures spatial coherence broadly across visual cortex. . . 68
LIST OF FIGURES xix
3.8 Spatial coherence across functional ROIs. Bar graphs display increases in spatial coherence by three methods (FI-VM, SI-VM, JI-VM) over VM (mean ± std across subjects). Spatial regulariza-tion enforces increased spatial coherence among cortical represen-tations of neighboring voxels. SI-VM and JI-VM have significantly higher spatial coherence than VM in all functional ROIs (P < 0.05, Bootstrap test). The average increase in category-selective areas is 19.78 ± 1.45% for SI-VM and 9.37 ± 1.40% for JI-VM, whereas the average increase in early visual areas is 21.99 ± 1.41% for SI-VM and 8.06 ± 1.75% for JI-SI-VM. Meanwhile, FI-SI-VM that lacks spatial regularization does not yield any improvement in spatial coherence. These results indicate that spatial regularization in-creases spatial coherence among cortical representations of voxel neighborhoods. . . 69
LIST OF FIGURES xx
4.1 Balanced Steady-State Free Precession. (a) Transverse mag-netization profiles of ∆φ = π (dotted line) and ∆φ = 0 (dashed line) phase-cycled bSSFP sequences were simulated along with their complex-sum (CS, solid line). The simulations assumed 90◦ flip angle, TR/TE = 4.6/2.3 msec and T1/T2 = 1200/250 msec
at 1.5T. Magnitude (top row) and phase (bottom row) profiles are shown separately, and the locations of fat and water resonances are marked with arrows. Fat and water signals are π-radians out of phase for ∆φ = π but large field inhomogeneity may cause water or fat resonances to leak into neighboring bands. CS maintains the π-radians fat–water phase difference while reducing sensitiv-ity to field inhomogenesensitiv-ity. (b) To detect this phase difference, PS-SSFP uses a correction step to remove phase variations from additional sources including coil sensitivity. To illustrate the ef-fects of coil sensitivity, in-phase bSSFP images (TR/TE = 9.2/4.6 msec at 1.5T) were acquired using a quadrature extremity coil and an 8-channel phased-array coil (three representative channels are shown). Histograms of voxel magnitude (top row) and polar histograms of voxel phase (bottom row) are visualized. Because individual channels in the phased-array coil have compact spatial coverage, voxel magnitudes accumulate around lower intensities compared to the quadrature-coil image. The narrow sensitivity profiles also cause the voxel phases to be more broadly spread in phased-array images. . . 75
LIST OF FIGURES xxi
4.2 The proposed method. (a) The initial step of the proposed reconstruction is to identify fat-voxel seeds near the peak of each coil’s sensitivity profile. To do this, sensitivity maps are first esti-mated from the central portion of k -space data for each coil (bot-tom row). These maps are then multiplied with the corresponding bSSFP images (top row), and for each coil the voxel that max-imizes the product is selected as the starting seed (marked with blue crosses). (b) Following coilwise seed selection, region-growing phase correction (RG-PC) is applied to individual-coil images (Si)
in order to remove slowly varying phase components. The phase-corrected coil images (Sipc) are then linearly combined, where im-ages are weighted by the magnitude of respective coil sensitivities (|Ci|). Phase-sensitive fat–water separation is finally performed
based on the magnitude and phase of the combined image (Scmb). 77
4.3 Dual-acquisition bSSFP images in the lower extremities. The foot (a) and the lower leg (b), collected using an 8-channel phased-array coil. Unseparated complex-sum images are shown for bSSFP, whereas water images are shown for PSms (multiseed,
individual coil) and the proposed method. Note that PSmswas
per-formed individually on each coil, and seed selection was identical across the two methods (starting seeds marked with blue crosses). In both a and b, the top row shows magnitude images and the middle row shows phase images (see colorbar) obtained from an individual coil. Meanwhile, the bottom row shows the final image combined across coils. Relatively large variations are observed in phase images away from the sensitivity peak of the coils: in poste-rior regions of the foot image and supeposte-rior–anteposte-rior regions of the lower leg (marked with dashed ellipses). While these variations cause fat–water misclassification in individual-coil and combined PSmsimages (marked with arrows), the proposed method produces
LIST OF FIGURES xxii
4.4 In vivo thigh images combined across 8 channels of a
phased-array coil. First row: The unseparated bSSFP im-age shown as a reference. Second row: A coronal slice from fat images reconstructed using PSss, PSms, PScc, and the proposed
method. Third row: A coronal slice from water images recon-structed using PSss, PSms, PScc, and the proposed method. Fourth
row: Maximum-intensity projections (MIPs) across water images. Residual fat signals are seen in multiple regions of regular PS-SSFP reconstructions (marked with arrows). In contrast, the proposed method maintains reliable fat–water separation across the imaging volume. . . 81 4.5 In vivo lower leg images combined across 8 channels of
a phased-array coil. First row: The unseparated bSSFP im-age shown as a reference. Second row: A coronal slice from wa-ter images reconstructed using PSss, PSms, PScc, and the proposed
method. Third row: MIPs across water images. Fat–water misclas-sification is seen broadly across regular PS-SSFP reconstructions (marked with arrows). Meanwhile, the proposed method achieves improved fat–water separation across the entire imaging volume. 83
4.6 Unseparated bSSFP images, fat/water images
structed using IDEAL, and fat/water images recon-structed using the proposed method. First row: A sagittal slice from in vivo thigh images. Second row: A sagittal slice from in vivo lower leg images. Third row: A sagittal slice from in vivo foot images. . . 85
LIST OF FIGURES xxiii
A.1 Cortical flat maps of prediction score and TSI for sub-ject S1. (a) To assess the functionality of semantic model, the prediction scores were visualized on cortical flat map for subject S1. Prediction scores were calculated as Pearson’s correlation co-efficient between the predicted and measured BOLD responses. Regions of fMRI signal dropout are shown with black patches and the boundaries of regions-of-interest (white), gyri (black) and sulci (black) are indicated by lines. Yellow voxels have higher predic-tion scores compared to black voxels as shown in color bar. Results indicate that many voxels in brain areas, including lateral tempo-ral cortex (LTC), venttempo-ral tempotempo-ral cortex (VTC), latetempo-ral parietal cortex (LPC), medial parietal cortex (MPC), medial prefrontal tex, superior prefrontal cortex (SPFC), and inferior prefrontal cor-tex (IPFC) are accurately predicted by the semantic model. (b) Cortical distribution of TSIs were visualized on the cortical flat map. Poorly modeled voxels are masked by means of their predic-tion score, and attenpredic-tional modulapredic-tion significance (see Methods), so that well-modeled and significantly attention-modulated voxels become more visible. Results indicate that voxels of similar TSI values are distributed as small clusters or stripes mainly across re-gions that take place in attention control and language processing. 108
LIST OF FIGURES xxiv
A.2 Cortical flat maps of prediction score and TSI for sub-ject S2. (a) To assess the functionality of semantic model, the prediction scores were visualized on cortical flat map for subject S2. Prediction scores were calculated as Pearson’s correlation co-efficient between the predicted and measured BOLD responses. Regions of fMRI signal dropout are shown with black patches and the boundaries of regions-of-interest (white), gyri (black) and sulci (black) are indicated by lines. Yellow voxels have higher predic-tion scores compared to black voxels as shown in color bar. Results indicate that many voxels in brain areas, including lateral tempo-ral cortex (LTC), venttempo-ral tempotempo-ral cortex (VTC), latetempo-ral parietal cortex (LPC), medial parietal cortex (MPC), medial prefrontal tex, superior prefrontal cortex (SPFC), and inferior prefrontal cor-tex (IPFC) were accurately predicted by the semantic model. (b) Cortical distribution of TSIs were visualized on the cortical flat map. Poorly modeled voxels are masked by means of their predic-tion score, and attenpredic-tional modulapredic-tion significance (see Methods), so that well-modeled and significantly attention-modulated voxels become more visible. Results indicate that voxels of similar TSI values are distributed as small clusters or stripes mainly across re-gions that take place in attention control and language processing. 109
LIST OF FIGURES xxv
A.3 Cortical flat maps of prediction score and TSI for subject S3. (a) To assess the functionality of semantic model, the predic-tion scores were visualized on cortical flat map for subject S3. Pre-diction scores were calculated as Pearson’s correlation coefficient between the predicted and measured BOLD responses. Regions of fMRI signal dropout are shown with black patches and the bound-aries of regions-of-interest (white), gyri (black) and sulci (black) are indicated by lines. Yellow voxels have higher prediction scores compared to black voxels as shown in color bar. Results indicate that many voxels in brain areas, including lateral temporal cor-tex (LTC), ventral temporal corcor-tex (VTC), lateral parietal corcor-tex (LPC), medial parietal cortex (MPC), medial prefrontal cortex, superior prefrontal cortex (SPFC), and inferior prefrontal cortex (IPFC) were accurately predicted by the semantic model. (b) dis-tribution of TSIs were visualized on the cortical flat map. Poorly modeled voxels are masked by means of their prediction score, and attentional modulation significance (see Methods), so that well-modeled and significantly attention-modulated voxels become more visible. Results indicate that voxels of similar TSI values are distributed as small clusters or stripes mainly across regions that take place in attention control and language processing. . . 110
LIST OF FIGURES xxvi
A.4 Cortical flat maps of prediction score and TSI for sub-ject S4. (a) To assess the functionality of semantic model, the prediction scores were visualized on cortical flat map for subject S4. Prediction scores were calculated as Pearson’s correlation co-efficient between the predicted and measured BOLD responses. Regions of fMRI signal dropout are shown with black patches and the boundaries of regions-of-interest (white), gyri (black) and sulci (black) are indicated by lines. Yellow voxels have higher predic-tion scores compared to black voxels as shown in color bar. Results indicate that many voxels in brain areas, including lateral tempo-ral cortex (LTC), venttempo-ral tempotempo-ral cortex (VTC), latetempo-ral parietal cortex (LPC), medial parietal cortex (MPC), medial prefrontal tex, superior prefrontal cortex (SPFC), and inferior prefrontal cor-tex (IPFC) were accurately predicted by the semantic model. (b) Cortical distribution of TSIs were visualized on the cortical flat map. Poorly modeled voxels are masked by means of their predic-tion score, and attenpredic-tional modulapredic-tion significance (see Methods), so that well-modeled and significantly attention-modulated voxels become more visible. Results indicate that voxels of similar TSI values are distributed as small clusters or stripes mainly across re-gions that take place in attention control and language processing. 111
LIST OF FIGURES xxvii
A.5 Cortical flat maps of prediction score and TSI for sub-ject S5. (a) To assess the functionality of semantic model, the prediction scores were visualized on cortical flat map for subject S5. Prediction scores were calculated as Pearson’s correlation co-efficient between the predicted and measured BOLD responses. Regions of fMRI signal dropout are shown with black patches and the boundaries of regions-of-interest (white), gyri (black) and sulci (black) are indicated by lines. Yellow voxels have higher predic-tion scores compared to black voxels as shown in color bar. Results indicate that many voxels in brain areas, including lateral tempo-ral cortex (LTC), venttempo-ral tempotempo-ral cortex (VTC), latetempo-ral parietal cortex (LPC), medial parietal cortex (MPC), medial prefrontal tex, superior prefrontal cortex (SPFC), and inferior prefrontal cor-tex (IPFC) were accurately predicted by the semantic model. (b) Cortical distribution of TSIs were visualized on the cortical flat map. Poorly modeled voxels are masked by means of their predic-tion score, and attenpredic-tional modulapredic-tion significance (see Methods), so that well-modeled and significantly attention-modulated voxels become more visible. Results indicate that voxels of similar TSI values are distributed as small clusters or stripes mainly across re-gions that take place in attention control and language processing. 112 A.6 Prediction scores in functional ROIs. Prediction scores are
reported as mean ± s.d. across subjects for the semantic model and the two control models, namely the spectrogram and phoneme models. In all functional ROIs, the average prediction score of the semantic model is significantly higher than that of the control mod-els (P < 0.05, bootstrap test). Control modmod-els have relatively high prediction performances only in auditory cortex (AC). In high-level auditory and attention areas, the control models exhibit much poorer prediction performances than the semantic model. . . 113
LIST OF FIGURES xxviii
A.7 Cortical flat maps of semantic tuning for subject S1. Dis-tributions of semantic tuning are shown for passive listening and the two attention tasks. Each voxel’s tuning vector was projected onto the three semantic dimensions, and RGB colors are assigned to each voxel according to these projections. Insignificant voxels are shown in gray. Yellow/green voxels are tuned to humans while blue voxels are tuned to places and locations. Results indicate that many cortical voxels shift their semantic tuning toward the attended word category. . . 114 A.8 Cortical flat maps of semantic tuning for subject S2.
Dis-tributions of semantic tuning are shown for passive listening and the two attention tasks. Each voxel’s tuning vector was projected onto the three semantic dimensions, and RGB colors are assigned to each voxel according to these projections. Insignificant voxels are shown in gray. Yellow/green voxels are tuned to humans while blue voxels are tuned to places and locations. Results indicate that many cortical voxels shift their semantic tuning toward the attended word category. . . 115 A.9 Cortical flat maps of semantic tuning for subject S3.
Dis-tributions of semantic tuning are shown for passive listening and the two attention tasks. Each voxel’s tuning vector was projected onto the three semantic dimensions, and RGB colors are assigned to each voxel according to these projections. Insignificant voxels are shown in gray. Yellow/green voxels are tuned to humans while blue voxels are tuned to places and locations. Results indicate that many cortical voxels shift their semantic tuning toward the attended word category. . . 116
LIST OF FIGURES xxix
A.10 Cortical flat maps of semantic tuning for subject S4. Dis-tributions of semantic tuning are shown for passive listening and the two attention tasks. Each voxel’s tuning vector was projected onto the three semantic dimensions, and RGB colors are assigned to each voxel according to these projections. Insignificant voxels are shown in gray. Yellow/green voxels are tuned to humans while blue voxels are tuned to places and locations. Results indicate that many cortical voxels shift their semantic tuning toward the attended word category. . . 117 A.11 Cortical flat maps of semantic tuning for subject S5.
Dis-tributions of semantic tuning are shown for passive listening and the two attention tasks. Each voxel’s tuning vector was projected onto the three semantic dimensions, and RGB colors are assigned to each voxel according to these projections. Insignificant voxels are shown in gray. Yellow/green voxels are tuned to humans while blue voxels are tuned to places and locations. Results indicate that many cortical voxels shift their semantic tuning toward the attended word category. . . 118 A.12 Caption next page. . . 119
LIST OF FIGURES xxx
A.12 TSI histograms across cortical voxels. (a) Main analysis. TSI distributions are shown for the cortical voxels (except motor ar-eas) of subjects S1-S5. Only well-modeled (prediction score greater than 1 s.d. above the mean) and significantly attention-modulated (t test, q(F DR) < 0.05) voxels are shown (7882-9014, depend-ing on subject). Significantly positive TSIs (Wilcoxon signed-rank test, q(F DR) < 0.05) are represented by dark gray bars and signif-icantly negative TSIs (Wilcoxon signed-rank test, q(F DR) < 0.05) are represented by light gray bars. Average TSI value is signifi-cantly greater than 0 in all subjects (Wilcoxon signed-rank test, P < 0.001). These results indicate that attention shifts tuning of most well-modeled and attention-modulated cortical voxels toward the attended category. (b) Control analysis. To ensure that voxels shift their tuning towards attended categories even when targets are absent from the stimuli, a control analysis was done. Model fitting and TSI analyses were done using only those segments of the story stimuli that did not contain any words semantically re-lated to humans or places. We then performed the TSI analyses on the fit models similarly to the main analysis. The TSI distri-butions in the absence of target stimuli are shown for the cortical voxels (except motor areas) of subjects S1-S5. Same voxel selection procedure is implemented as in (a). Average TSI value is signif-icantly greater than 0 in all subjects (Wilcoxon signed-rank test, P < 0.001). These results indicate that most well-modeled voxels shift their tuning toward the target category even when the target is not present in the stimuli. . . 120
LIST OF FIGURES xxxi
A.13 Distributions of tuning shifts across functional ROIs. (a) Main analysis. Average TSIs of functional ROIs are shown for sub-jects S1-S5 (mean ± s.e.m. across voxels). Results indicate that, attention causes different levels of semantic tuning shifts across functional ROIs. Areas that take place in attention control (FO, IPS, FEF), and language processing (Broca, WER) have high TSI for all subjects. (b) Control analysis. TSIs in functional ROIs are shown for subjects S1-S5 in the absence of targets in the stimuli (mean ± s.e.m. across voxels). Results indicate that even when no target is present in the stimuli, functional ROIs have TSI char-acteristics similar to main analysis. . . 121 B.1 Prediction scores of VM across functional ROIs. The
pre-diction performance of VM is shown for several well-known func-tional ROIs. Bar graphs display improvement in prediction scores (R2, mean ± std across subjects). VM has significantly positive
prediction scores in all ROIs (P < 0.05, Wilcoxon signed rank test). The average prediction score is 33.32 ± 2.98 in category-selective areas and 10.37 ± 1.54 in early visual areas. . . 122
LIST OF FIGURES xxxii
B.2 Cortical distribution of optimal L2-norm regularization parameter for Subject S1. The L2-regularization parameters
over model features in three methods (VM, FI-VM, JI-VM) are vi-sualized on flat maps. VM strictly penalizes model weights broadly across cortex. High regularization parameters reduce sensitiv-ity in measuring voxelwise functional selectivsensitiv-ity. Here, we incor-porate additional regularization terms across features and across voxel neighborhoods. As such, the proposed method should limit unnecessary penalization of model weights by L2-regularization.
As a result, FI-VM applies less weight regularization particularly in category-selective areas, early visual areas, and frontal gyrus. Overall, JI-VM enforces the lowest weight penalization among the competing methods consistently across cortex. These results im-ply that both spatial and feature regularization alleviate the need for L2-regularization, thereby increasing sensitivity in measuring
voxelwise functional selectivity. . . 123 B.3 Cortical distribution of optimal L2-norm regularization
parameter for Subject S2. The L2-regularization parameters
over model features in three methods (VM, FI-VM, JI-VM) are vi-sualized on flat maps. VM strictly penalizes model weights broadly across cortex. High regularization parameters reduce sensitiv-ity in measuring voxelwise functional selectivsensitiv-ity. Here, we incor-porate additional regularization terms across features and across voxel neighborhoods. As such, the proposed method should limit unnecessary penalization of model weights by L2-regularization.
As a result, FI-VM applies less weight regularization particularly in category-selective areas, early visual areas, and frontal gyrus. Overall, JI-VM enforces the lowest weight penalization among the competing methods consistently across cortex. These results im-ply that both spatial and feature regularization alleviate the need for L2-regularization, thereby increasing sensitivity in measuring
LIST OF FIGURES xxxiii
B.4 Cortical distribution of optimal L2-norm regularization parameter for Subject S3. The L2-regularization parameters
over model features in three methods (VM, FI-VM, JI-VM) are vi-sualized on flat maps. VM strictly penalizes model weights broadly across cortex. High regularization parameters reduce sensitiv-ity in measuring voxelwise functional selectivsensitiv-ity. Here, we incor-porate additional regularization terms across features and across voxel neighborhoods. As such, the proposed method should limit unnecessary penalization of model weights by L2-regularization.
As a result, FI-VM applies less weight regularization particularly in category-selective areas, early visual areas, and frontal gyrus. Overall, JI-VM enforces the lowest weight penalization among the competing methods consistently across cortex. These results im-ply that both spatial and feature regularization alleviate the need for L2-regularization, thereby increasing sensitivity in measuring
voxelwise functional selectivity. . . 125 B.5 Cortical distribution of optimal L2-norm regularization
parameter for Subject S4. The L2-regularization parameters
over model features in three methods (VM, FI-VM, JI-VM) are vi-sualized on flat maps. VM strictly penalizes model weights broadly across cortex. High regularization parameters reduce sensitiv-ity in measuring voxelwise functional selectivsensitiv-ity. Here, we incor-porate additional regularization terms across features and across voxel neighborhoods. As such, the proposed method should limit unnecessary penalization of model weights by L2-regularization.
As a result, FI-VM applies less weight regularization particularly in category-selective areas, early visual areas, and frontal gyrus. Overall, JI-VM enforces the lowest weight penalization among the competing methods consistently across cortex. These results im-ply that both spatial and feature regularization alleviate the need for L2-regularization, thereby increasing sensitivity in measuring
LIST OF FIGURES xxxiv
B.6 Cortical distribution of optimal L2-norm regularization parameter for Subject S5. The L2-regularization parameters
over model features in three methods (VM, FI-VM, JI-VM) are vi-sualized on flat maps. VM strictly penalizes model weights broadly across cortex. High regularization parameters reduce sensitiv-ity in measuring voxelwise functional selectivsensitiv-ity. Here, we incor-porate additional regularization terms across features and across voxel neighborhoods. As such, the proposed method should limit unnecessary penalization of model weights by L2-regularization.
As a result, FI-VM applies less weight regularization particularly in category-selective areas, early visual areas, and frontal gyrus. Overall, JI-VM enforces the lowest weight penalization among the competing methods consistently across cortex. These results im-ply that both spatial and feature regularization alleviate the need for L2-regularization, thereby increasing sensitivity in measuring
voxelwise functional selectivity. . . 127 B.7 Feature coherence in VM, FI-VM, and JI-VM for
Sub-ject S1. Feature coherence is shown on flat maps. VM ignores potential feature correlations in the stimulus so it has reduced sen-sitivity to coherence in stimulus features. The informed feature regularization enforces similar model weights for correlated model features. Therefore, feature coherence of FI-VM and JI-VM are higher than that of VM across many cortical regions including category-selective areas, early visual areas, RSC, IPS, and ATFP. These results suggest that informed feature regularization improves feature coherence broadly across visual cortex. . . 128
LIST OF FIGURES xxxv
B.8 Feature coherence in VM, FI-VM, and JI-VM for Sub-ject S2. Feature coherence is shown on flat maps. VM ignores potential feature correlations in the stimulus so it has reduced sen-sitivity to coherence in stimulus features. The informed feature regularization enforces similar model weights for correlated model features. Therefore, feature coherence of FI-VM and JI-VM are higher than that of VM across many cortical regions including category-selective areas, early visual areas, RSC, IPS, and ATFP. These results suggest that informed feature regularization improves feature coherence broadly across visual cortex. . . 129 B.9 Feature coherence in VM, FI-VM, and JI-VM for
Sub-ject S3. Feature coherence is shown on flat maps. VM ignores potential feature correlations in the stimulus so it has reduced sen-sitivity to coherence in stimulus features. The informed feature regularization enforces similar model weights for correlated model features. Therefore, feature coherence of FI-VM and JI-VM are higher than that of VM across many cortical regions including category-selective areas, early visual areas, RSC, IPS, and ATFP. These results suggest that informed feature regularization improves feature coherence broadly across visual cortex. . . 130 B.10 Feature coherence in VM, FI-VM, and JI-VM for
Sub-ject S4. Feature coherence is shown on flat maps. VM ignores potential feature correlations in the stimulus so it has reduced sen-sitivity to coherence in stimulus features. The informed feature regularization enforces similar model weights for correlated model features. Therefore, feature coherence of FI-VM and JI-VM are higher than that of VM across many cortical regions including category-selective areas, early visual areas, RSC, IPS, and ATFP. These results suggest that informed feature regularization improves feature coherence broadly across visual cortex. . . 131
LIST OF FIGURES xxxvi
B.11 Feature coherence in VM, FI-VM, and JI-VM for Sub-ject S5. Feature coherence is shown on flat maps. VM ignores potential feature correlations in the stimulus so it has reduced sen-sitivity to coherence in stimulus features. The informed feature regularization enforces similar model weights for correlated model features. Therefore, feature coherence of FI-VM and JI-VM are higher than that of VM across many cortical regions including category-selective areas, early visual areas, RSC, IPS, and ATFP. These results suggest that informed feature regularization improves feature coherence broadly across visual cortex. . . 132 B.12 Spatial coherence in VM, FI-VM, and JI-VM for Subject
S1. Spatial coherence is shown on flat maps. VM ignores cor-relations among voxel neighborhoods so it has reduced sensitivity to spatial coherence in cortical representations. Spatial regular-ization enforces increased spatial coherence among cortical rep-resentations within voxel neighborhoods. Although, FI-VM and VM have relatively similar spatial coherence values, JI-VM consis-tently yields higher spatial coherence across many cortical regions including category-selective areas, early visual areas (V1-V4), IPS, RSC and ATFP. These results suggest that spatial regularization improves spatial coherence broadly across visual cortex. . . 133 B.13 Spatial coherence in VM, FI-VM, and JI-VM for Subject
S2. Spatial coherence is shown on flat maps. VM ignores cor-relations among voxel neighborhoods so it has reduced sensitivity to spatial coherence in cortical representations. Spatial regular-ization enforces increased spatial coherence among cortical rep-resentations within voxel neighborhoods. Although, FI-VM and VM have relatively similar spatial coherence values, JI-VM consis-tently yields higher spatial coherence across many cortical regions including category-selective areas, early visual areas (V1-V4), IPS, RSC and ATFP. These results suggest that spatial regularization improves spatial coherence broadly across visual cortex. . . 134
LIST OF FIGURES xxxvii
B.14 Spatial coherence in VM, FI-VM, and JI-VM for Subject S3. Spatial coherence is shown on flat maps. VM ignores cor-relations among voxel neighborhoods so it has reduced sensitivity to spatial coherence in cortical representations. Spatial regular-ization enforces increased spatial coherence among cortical rep-resentations within voxel neighborhoods. Although, FI-VM and VM have relatively similar spatial coherence values, JI-VM consis-tently yields higher spatial coherence across many cortical regions including category-selective areas, early visual areas (V1-V4), IPS, RSC and ATFP. These results suggest that spatial regularization improves spatial coherence broadly across visual cortex. . . 135 B.15 Spatial coherence in VM, FI-VM, and JI-VM for Subject
S4. Spatial coherence is shown on flat maps. VM ignores cor-relations among voxel neighborhoods so it has reduced sensitivity to spatial coherence in cortical representations. Spatial regular-ization enforces increased spatial coherence among cortical rep-resentations within voxel neighborhoods. Although, FI-VM and VM have relatively similar spatial coherence values, JI-VM consis-tently yields higher spatial coherence across many cortical regions including category-selective areas, early visual areas (V1-V4), IPS, RSC and ATFP. These results suggest that spatial regularization improves spatial coherence broadly across visual cortex. . . 136 B.16 Spatial coherence in VM, FI-VM, and JI-VM for Subject
S5. Spatial coherence is shown on flat maps. VM ignores cor-relations among voxel neighborhoods so it has reduced sensitivity to spatial coherence in cortical representations. Spatial regular-ization enforces increased spatial coherence among cortical rep-resentations within voxel neighborhoods. Although, FI-VM and VM have relatively similar spatial coherence values, JI-VM consis-tently yields higher spatial coherence across many cortical regions including category-selective areas, early visual areas (V1-V4), IPS, RSC and ATFP. These results suggest that spatial regularization improves spatial coherence broadly across visual cortex. . . 137
List of Tables
Chapter 1
Background
Magnetic resonance imaging (MRI) is used to obtain images of biological tissues by means of strong magnetic fields. By modifying the pulse sequence of the scanner various tissue types can be distinguished such as blood vessels, bone, fat, gray and white matter in brain [2]. Apart from structural imaging, recently, functional neuroimaging studies are used to characterize the cortical activation associated to various mental tasks. Specifically, in functional Magnetic Resonance Imaging (fMRI) studies, temporal change in blood oxygenation is measured with a high spatial resolution. Blood oxygenation inside neural populations is strongly linked to the neural activities. Thus, scientists utilize fMRI to understand the functional characteristics of the human brain.
Many fMRI studies were conducted to localize specific cortical regions that are thought to represent low-level (retinotopic areas [3, 4], tonotopically organized auditory areas [5, 6, 7]) or high-level visual/auditory information (visual category areas [8, 9, 10, 11, 12, 13], auditory semantic areas [14, 15, 16]). In those studies, mostly, voxelwise modeling techniques were exploited to understand how stimulus features elicit Blood-oxygen-level-dependent (BOLD) responses across cortical voxels. Natural scene statistics or word statistics in text corpora were also used along with voxelwise modeling techniques to localize cortical regions that seem to represent visual or auditory information in case of naturally presented stimuli
[17, 18, 19, 20]. These studies indicated either specific cortical regions for each of various visual/auditory categories or a more continuous semantic space that represents stimulus information continuously across cortex. Specifically, in Huth et al. 2016, it is reported that the human brain represents thousands of word categories in a continuous semantic space mapped broadly across cerebral cortex. In this thesis, chapter 2 mainly focuses on the effects of auditory attention on the language representation across cortex. For this purpose, we designed a functional magnetic resonance imaging (fMRI) experiment with a natural audi-tory semantic search task. Subjects listened to a diverse collection of naturally spoken stories. They were instructed to listen to each story twice while searching for words that are semantically related to either ‘humans’ (e.g., student, guy, parent, everyone) or ‘places’ (e.g., school, bar, north, lake). Whole-brain blood-oxygen-level-dependent (BOLD) responses were recorded via fMRI while subjects performed the search tasks. We used a powerful voxelwise semantic model that estimates BOLD responses in terms of the semantic features of the story stimuli. Later, we measured semantic tuning in single voxels of each subject by comparing the fit models under two attention conditions. Results indicate that auditory at-tention shifts semantic tuning toward the target category broadly across cortex. Another finding is that attention warps language representation across cortex in favor of target words, while compressing the representation of semantically irrelevant words.
Chapter 3 focuses on a novel voxelwise modeling approach for naturalistic fMRI experiments. In this approach, we introduced an informed feature regularization that takes into account correlations among model features. The informed feature regularization simply enforces similarity of model weights between features that are semantically related to each other for each voxel. In the proposed method, we further implemented an improved spatial regularization across voxelwise models that considers cortical distances among voxels instead of Euclidean. We evaluated performance of the proposed method on an fMRI dataset gathered from a natural-istic movie experiment. Results suggest that the proposed method offer improved sensitivity in modeling of single voxels in naturalistic fMRI experiments together with increased feature coherence and spatial coherence of voxelwise models.
Apart from these studies, in chapter 4, we propose a novel method to improve the sensitivity of phase-sensitive fat-water separation in balanced steady-state free precession (bSSFP) acquisitions. bSSFP sequences typically generate higher levels of signal from fat when compared to water tissues. Separation of these two signals is critical for many clinical applications [21, 22, 23, 24]. However, in ap-plications using phased-array coils, reconstructed images suffer a lot from spatial sensitivity variations within individual coils. To improve these reconstructions, in our proposed method, we first perform region-growing phase correction in in-dividual coil images via unsupervised selection of a fat-voxel seed near the peak of each coil’s sensitivity profile. We then use an optimal linear combination of phase-corrected images to segregate fat and water signals. The proposed method was demonstrated on noncontrast-enhanced SSFP angiograms of the thigh, lower leg, and foot. Results indicate that the proposed method enhances fat–water separation in phased-array acquisitions by producing improved phase estimates across the imaging volume. Note that this chapter is based on a paper published in 2015 [25].
Chapter 2
Category-based Attention in
Natural Speech Warps Semantic
Maps in the Human Cortex
2.1
Introduction
Humans can effortlessly identify target auditory objects during natural listening and shift their focus between different targets [26]. Auditory attention is thought to mediate this remarkable ability by enhancing representations of auditory infor-mation in the brain. Many distinct types of auditory inforinfor-mation from low-level tonal features to high-level semantic features are thought to be represented hierar-chically across a network of regions including primary auditory cortex, temporal cortex, parietal cortex and prefrontal cortex [5, 6, 7, 27, 28, 29, 30, 31]. Pre-vious studies using low-level spatial or tonal attention tasks reported response baseline or gain changes in primary auditory cortex [32, 33, 34] and parietal cor-tex [35, 36, 37]. High-level attention tasks were also reported to cause similar baseline or gain changes in temporal gyrus, frontal gyrus, and prefrontal cortex [38, 39, 40]. While baseline or gain modulations can elevate target responses above background signals, they cannot fully account for the dynamic nature of
real-world search [41].
Theoretical and physiological accounts suggest attentional contribution from a dynamic matched filter mechanism that warps representations at the population level particularly towards later stages of processing [41, 42, 43, 44]. A matched filter can expand the representation of attended features while compressing the representation of unattended ones across neocortex [1]. In accordance with these accounts, recent neurophysiology [45, 46, 47] and neuroimaging [48, 49, 50, 51, 52] studies have reported shifts in spectro-temporal receptive fields within primary auditory cortex during low-level spatial and tonal attention tasks. However, little is known about whether high-level auditory attention operates through a similar matched filter mechanism to warp auditory semantic representations and how these representational warps are distributed across cortex.
Providing evidence for the matched-filter hypothesis, in previous studies from The Gallant Lab, the authors found that semantic information about thousands of visual object categories is represented in smooth gradients across cortex, and that category-based visual search in natural movies causes voxelwise tuning shifts that warp semantic representations in favor of attended categories [1, 53]. They also found that during passive listening of natural stories, the human brain represents thousands of word categories in a continuous semantic space mapped broadly across cerebral cortex [20]. Thus, it is likely that high-level auditory semantic search for word categories in natural stories also induces broad voxelwise tuning shifts that warp semantic representations in favor of attended categories (Fig. 2.1).
To examine modulations in auditory semantic representation with improved sensitivity, we designed a natural auditory semantic search task (Fig. 2.2). Sub-jects listened to a diverse collection of naturally spoken stories that contained 1463 distinct words. They were instructed to listen to each story twice while searching for words that are semantically related to either ‘humans’ (e.g., student, guy, parent, everyone) or ‘places’ (e.g., school, city, north, lake) in alternating order across scans (see 2.2.3). Whole-brain blood-oxygen-level-dependent (BOLD) re-sponses were recorded via functional magnetic resonance imaging (fMRI) from
five human subjects while they performed the search tasks (see 2.2.3).
To measure semantic tuning in single voxels in each subject, we used a pow-erful voxelwise semantic model that estimates BOLD responses in terms of the semantic features of the story stimuli [54]. The semantic features were identified by constructing a word embedding space based on word co-occurrence statistics in a large corpus of text. Each word in the stories was projected onto this em-bedding space. Regularized linear regression was used to fit voxelwise models that optimally predict the measured BOLD responses in terms of the semantic features. Two separate semantic models were obtained based on data collected during search for humans and during search for places. Model weights obtained under different attention tasks were compared to identify semantic tuning shifts in single voxels.
Figure 2.1: Attention warps semantic representation of words in favor of attended categories. The tuning-shift hypothesis predicts that attention warps semantic representation in favor target categories. During passive listen-ing, words are represented in a continuous semantic space where semantically related words appear in nearby locations. Attention to a specific word category expands the representation of words that are semantically similar to the attended category, while compressing the representation of words semantically dissimilar to the attended category.
Figure 2.2: Natural semantic search in spoken narratives. (a) During the semantic search experiment, five subjects listened to three naturally spoken sto-ries while attending to words that belonged to either one of two target categosto-ries: humans or places. Whole-brain BOLD responses were acquired. To estimate semantic tuning in single voxels, we fit voxelwise models that optimally predict measured BOLD responses in terms of the semantic features of the story stimuli. To account for hemodynamic delays, a finite impulse response filter was used for each semantic feature. The voxelwise tuning vectors were then averaged across different time delays. The resulting semantic tuning vectors describe how words in the story stimulus evoke BOLD responses. (b) Semantic tuning was estimated separately for each attention task. Tuning changes in single voxels are a unique, diagnostic aspect of the tuning-shift hypothesis. To test this hypothesis, we mea-sured changes in voxel tuning between the two attention tasks.
2.2
Methods
2.2.1
MRI Protocols
MRI data were previously collected by researchers from The Gallant Lab in a 3T Siemens Tim Trio scanner at the University of California, Berkeley using a 32-channel head coil. Data from the passive listening experiment were used in a previous study [20] (see 2.2.3). Gradient EPI sequence was used with repetition time = 2.00 s, echo time = 33 ms, flip angle = 70◦, voxel size = 2.24×2.24×4.13 mm3, slice thickness = 3.5 mm with 18% slice gap, field of view = 224×224 mm2 and 32 axial slices to cover the entire cortex. Anatomical data were collected using T1-weighted multi-echo MP-RAGE sequence with voxel size = 1×1×1 mm3 and
field of view = 25×212×256 mm3.
2.2.2
Subjects
Functional data were collected from five healthy adult volunteers (one female, four males). All subjects had normal hearing. The experimental protocol was approved by the Protection of Human Subjects Committee at the University of California, Berkeley and written informed consent was obtained from all subjects.
2.2.3
Experimental Procedure
In the passive listening experiment, subjects were instructed to listen to naturally spoken stories without engaging in any other task. The stimuli for passive listen-ing experiment consisted of ten stories selected from The Moth Radio Hour which covers a wide range of topics: ‘Alternate Ithaca Tom’ by Tom Weiser; ‘Targeted’ by Jen Lee; ‘My Avatar and Me’ by Laura Albert; ‘My Unhurried Legacy’ by Kyp Malone; ‘Ode to Stepfather’ by Ethan Hawke; ‘Under the Influence’ by Jeffery Rudell; ‘How to Draw a Nekkid Man’ by Tricia Rose Burt; ‘My First Day at the
Yankees’ by Matt McGough; ‘Naked’ by Catherine Burns; and ‘Life Flight’ by Kimberly Reed. In each story, a speaker tells a memoir to a live audience. Passive listening data were collected in two separate 2-hour scanning sessions performed on different days.
In the attention experiment, subjects were instructed to listen to each story twice and search for words that are semantically related to humans (e.g., student, guy, parent, everyone) in one run and related to places (e.g., school, city, north, lake) in the other run. The stimuli for the attention experiment included three stories from The Moth Radio Hour (‘From Boyhood to Fatherhood’ by Jonathan Ames, ‘My First Day at the Yankees’ by Matt McGough, and ‘Naked’ Cather-ine Burns). Attention data were collected in a single scan session consisting of six runs. The target category was fixed in each run. The attention tasks were alternated in consecutive runs. To ensure continuous vigilance, subjects were cued to depress a button whenever they hear a target word. All stimuli were played at 44.1 kHz using Sensimetrics S14 in-ear piezoelectric headphones. Fre-quency response was flattened using hardware parametric equalizer and volume was normalized to have peak loudness of -1 dB relative to maximum.
2.2.4
ROI Abbreviations
Regions of interest used in our study are: Auditory cortex (AC), Broca’s area (Broca), Wernicke’s area (WER), angular gyrus (AngG), supramarginal gyrus (SupMG), frontal operculum (FO), intraparietal sulcus (IPS), frontal eye fields (FEF), superior/middle/inferior frontal gyri (SFG, MFG, IFG), retinotopic area (RET, consisting of V1, V2, V3, V4, LO, V3A, and V3B), fusiform face area (FFA), occipital face area (OFA), inferior frontal sulcus face patch (IFSFP), ex-trastriate body area (EBA), parahippocampal place area (PPA), retrosplenial cortex (RSC), occipital place area (OPA), supplementary eye fields (SEF), pri-mary motor and somatosensory areas (S1F, M1F, S1H, M1H, S1M, and M1M), supplementary motor hand and foot areas (SMHA, SMFA).