ELSEVIER International Journal of Forecasting 12 (1996) 9-24
Effects of task format on probabilistic forecasting of stock
prices
Dilek Onkal*, G/ilnur Murado~lu
Faculty of Business Administration, Bilkent University, 06533 Ankara, Turkey
Abstract
This study aims to explore the differences in various dimensions of forecasting accuracy that may result from the task format used to elicit the probabilistic forecasts. In particular, we examine the effects of using multiple-interval and dichotomous formats on the performance of portfolio managers' probabilistic forecasts of stock prices. Probabilistic forecasts of these experts are compared with those provided by semi-experts comprised of other banking professionals trained in portfolio management, as well as with forecasts provided by a novice group. The results suggest that the task format used to elicit the probabilistic forecasts has a differential impact on the performance of experts, semi-experts, and novices. The implications of these findings for financial forecasting are discussed and directions for future research are given.
Keywords: Subjective probability; Probability forecasting; Judgmental forecasting; Stock-price forecasting; Task format
I. Introduction
The critical role of judgment in forecasting, especially in economic and financial forecasting, is emphasized unequivocally by research findings (Batchelor and Dua, 1990; Bunn and Wright, 1991; Flores et al., 1992; Goodwin and Wright, 1991; McNees, 1990; Phillips, 1987; Turner, 1990; Wolfe and Flores, 1990; Wright and Ayton, 1987; Zarnowitz and Lambros, 1987). The ques- tion remains as to how to structure and integrate such expert judgment into financial decision- making processes. The use of subjective prob- abilities as ways of reflecting the uncertainty inherent in financial forecasting situations (as
* Corresponding author.
well as the forecaster's internal state of uncer- tainty) provides one promising answer. Prob- ability forecasts supply efficient channels of com- munication between the providers and users of financial information, since they offer quantita- tive measures of such uncertainty.
In stock-price forecasting, subjective prob- ability distributions were first used by Bartos (1969) and Stael von Holstein (1972). In both studies, uniform distributions outperformed the forecasters' distributions. In later studies (Yates et al., 1991; Onkal and Murado~lu, 1994), prob- abilistic forecasts of stock prices were again found to display low levels of accuracy. Further- more, historical forecasters (relying on relative frequencies) were found to outperform the prob- abilistic forecasts given by the participants. Yates 0169-2070/96/$15.00 (~) 1996 Elsevier Science B.V. All rights reserved
10 D. Onkal, G. Murado~lu / International Journal of Forecasting 12 (1996) 9-24
et al. (1991) attributed this observed difficulty in stock-price forecasting in part to the efficiency of the market. In an efficient market, stock prices (which are known to everyone operating in the market) represent all the available information. Therefore, it is not possible to systematically make better forecasts of future prices, leading to consistently abnormal profits (Fama, 1991).
Yates et al. (1991) also identified the presence of an 'inverse-expertise effect' in forecasting performance. This effect was defined as the existence of a negative relationship between forecasting accuracy and expertise. Replicating their study, Onkal and Murado~lu (1994) changed the environmental set-up to an emerg- ing and inefficient stock market. However, the inverse-expertise effect persisted.
There were two main limitations of this re- search. First, both studies only used multiple- interval task formats. It may be argued that the choice of task formats could directly influence various aspects of probability judgment accuracy (Ronis and Yates, 1987), therefore requiring detailed investigation. Second, both studies used students as forecasters. Yates et al. (1991) iden- tified graduate students as experts, while Onkal and Murado~lu (1994) defined experts as stu- dents who have made previous stock investment decisions.
The purpose of this study was to explore the effects of using different task formats (i.e. mul- tiple-interval and dichotomous formats) on the performance of portfolio managers' probabilistic forecasts of stock prices. Obtaining differential performances under different task formats would have important policy implications for training, evaluation, and user satisfaction in financial forecasting settings. The particular task formats used in this study were selected on the basis of the needs and expectations of the users of such financial forecasts.
Probability forecasts given by portfolio mana- gers (i.e. the 'expert' group) were also compared with those provided by a 'semi-expert' group comprised of other banking professionals trained in portfolio management, as well as a 'novice' group. The design allows us to explore the inverse-expertise effect across different task for-
mats and to generalize the research to non-
student subjects. Following Onkal and
Murado~lu (1994), forecasting is studied in a developing economy setting of an inefficient emerging security market so as to deter mis- interpretations of forecast accuracy via market efficiency assumptions (i.e. so as to avoid argu- ments relating the difficulty in forecasting stock prices to the notion of efficient markets where consistently better abnormal profits are not at- tainable).
2. The setting: An emerging securities market
Financial markets in Turkey were highly in- efficient and strictly regulated until 1980. At- tempts to liberalize the country in general and financial markets in particular started at the beginning of the 1980s with the introduction of a liberalization package encouraged by the World Bank and the International Monetary Fund. Establishment of the legal framework and reg- ulatory agencies for the stock market were completed in 1982, but it was only in 1986 that the Istanbul Securities Exchange (ISE), the only stock exchange in Turkey, was established. Dur- ing the first two years of its operations, the employees of the stock exchange could hold stock portfolios without notification and there was no legislation against insider trading until 1990. During February 1992, when this study was conducted, 143 stocks were traded at ISE and the average daily volume of trade was US$55 million. There were 162 intermediaries and brokerage houses, 60 of which were affiliated with companies traded in the exchange.
The relatively few stocks and the low volume of trade in ISE compared with exchanges in developed countries decreases the complexity of the decision parameters and of the forecasting task. Also, the market is inefficient in the weak and semi-strong forms. That is, the stock prices are found to be forecastable based on past price performance (Murado~lu and Unal, 1994), and based on macroeconomic variables (Murado~lu and Onkal, 1992). Owing to market size and institutional inefficiencies, professional portfolio
D. Onkal, G. Murado~lu / International Journal of Forecasting 12 (1996) 9-24 11
managers can be assumed to have access to private information.
3. Procedure
Participants in the study were reached at two locations on the same date. The first group (referred to as 'experts') was composed of port- folio managers. This group consisted of 13 ex- perts working for a bank-affiliated brokerage house. All the experts had licenses as brokers and their job descriptions included management of four investment funds and the provision of investment advice to customers with investments above US$50,000. The second group (referred to as 'semi-experts') was composed of experts work- ing for the banking sector as internal auditors and managers. They were participating in a company-paid 40-hour workshop on portfolio management. Of this group, two internal au- ditors and seven managers were willing to par- ticipate in the experiment after the completion of the workshop.
To enhance the generalizability of the findings, the experiment was also replicated with a sample of 64 students from the Faculty of Business Administration at Bilkent University. This sam- ple was used as the 'novice' group.
Following the basic procedure of Yates et al. (1991), the task involved preparing probability forecasts regarding the closing stock prices of 32 companies listed on the Istanbul Stock Ex- change. The companies with the highest volume of trade during the preceding 52-week period were selected to minimize task complexity. This selection was made to ensure that the relevant stock prices could easily be followed by all participants.
The choice of task formats employed in this study was based on interviews with potential users of financial forecasts. In response to the needs and expectations of users, multiple inter- val and dichotomous task structures were select- ed as alternative formats that forecasters could utilize to express their true judgments. Accord- ingly, subjects were asked to make forecasts regarding the weekly price changes for each of
the 32 stocks using (1) a multiple interval format, and (2) a dichotomous format. Forecasts were made regarding the percentage change between the previous Friday's closing stock price and the closing stock price that would be realized the current Friday. In the multiple-interval format, subjects provided these forecasts in the form of subjective probabilities conveying their degree of belief in the actual price change falling into the designated percentage change categories. Spe- cifically, subjects were asked to complete a response form (Fig. 1) for each stock.
The range of stock price changes in the re- sponse form were prepared by considering the average weekly changes in the composite stock index of ISE during the previous 52-week period. For the previous 52 weeks, weekly price changes were 3% on average with a maximum increase of 8% and a maximum decrease of 5%. The first 5% increase range (Interval 5) con- tained the average weekly increase during the previous year, the second (Interval 6) contained the maximum weekly increase observed in the previous 52-week period. Intervals 7 and 8 were designed for stocks whose volatility is higher than average. Intervals 1-4 were chosen as symmetric to Intervals 5-8.
Forecasts with the dichotomous format in- volved stating whether the forecaster believed the closing stock price for the current Friday would (a) increase, or (b) decrease or stay the same in comparison with the previous Friday's closing stock price. Subjects were then requested to convey their degree of belief with a subjective probability for the forecasted direction of price change. Specifically, subjects were asked to complete a response form (Fig. 2) for each stock. At the beginning of the experiment, particip-
W E E K L Y P R I C E C H A N G E I N T E R V A L P R O B A B I L I T Y ( i n p e r c e n t a g e s . F P l d a v t o F r i d a y ) ( 8 ) I N C R E A S E 1 5 % o r m o r e _ _ % ( 7 ) I N C R E A S E 1 0 % - u p t o 1 5 % _ _ % ( 6 ) I N C R E A S E 5 % - u p t o 1 0 % _ _ % ( 5 ) I N C R E A S E u p t o 5 % _ _ % (4) D E C R E A S E 0 % - u p t o 5 % - - % ( 3 ) D E C R E A S E 5 % - u p t o 1 0 % - - % ( 2 ) D E C R E A S E 1 0 % - u p t o 1 5 % - - % ( I ) D E C R E A S E 1 5 % o r m o r e _ _ % Fig. 1. Form 1. I00
12 D. Onkal, G. Murado~lu / International Journal of Forecasting 12 (1996) 9-24 When compared to the p r e v i o u s FrldaY'a closing price, this
F r i d a y ' s c l o s i n g p r i c e will A. I n c r e a s e
B. Stay the same o r d e c r e a s e
Your forecast (A o r R] :
P r o b a b i l i t y t h a t y o u r f o r e c a s t w i l l
i n d e e d o c c u r
(i.e., p r o b a b i l i t y that the weekly price change will a c t u a l l y fall in the d i r e c t i o n
yOU p r e d i c t e d ) ¢R[CTWK~3/ 50% AND IOOX) :
Fig. 2. Form 2.
ants were given detailed definitions of 'subjective probability' and 'probability forecasting tasks'. Examples were discussed and the design of the study was described. Participants were also in- formed about the research goals. The findings of previous research regarding the inverse-expertise effect were not discussed with the subjects so as not to influence their motivation.
Participants were told that certain scores of probability forecasting performance would be computed from their individual forecasts. They were informed that, owing to the computational characteristics of these scores (i.e. proper scoring rules), each subject could earn the best potential score by expressing his/her true opinion without hedging or bluffing. Subjects were also told that their performance would be reported on a per- sonal basis and no information about their direct or implied individual performances would be given to their managers or co-workers.
Each participant was presented with a folder that contained background forms and response sheets for the 32 companies in question. Back- ground forms contained information on the name of the company, its industry, its net profits as of the end of the third quarter of 1991, earnings per share, and price-earnings ratio as of the last day of the preceding week. The folders also provided the weekly closing stock prices (i.e. the closing stock prices for each Friday) of the preceding 3 months (12 weeks) in tabular form as well as the weekly closing prices for the last 52 weeks in graphic form.
Response sheets were comprised of the two formats illustrated previously for each company (i.e. one being the response form containing the previously-illustrated multiple interval format and the second being the response form con-
taining the previously-illustrated dichotomous format). Both response sheets also contained instructions about the forecasting task.
Participants were allowed to take the back- ground folders home. They were given the experimental material on Friday afternoon and were requested to submit the completed re- sponse sheets by Monday 9 a.m. before the opening of the session at the stock exhange. They were also permitted to utilize any infor- mation source they would like in making their forecasts, excluding the other participants of the study. This was facilitated by the fact that the forecasts were made over the weekend when the expert and semi-expert groups would not meet at their natural job settings.
4. Findings
Performance measures used to evaluate the various aspects of forecasting accuracy of multip- le-interval forecasts were the mean probability score for multiple events, calibration score, scat- ter score, mean slope, forecast profile variance, and the skill score. The mean probability score provides an index of overall forecasting accura- cy. Calibration indexes the forecaster's ability to match the probability forecasts with the realized relative frequencies. Scatter gives a measure of excessive variability in the forecasts. The mean slope reflects the forecaster's ability to discrimi- nate between occasions when the actual price change will and will not fall into the specified intervals. The forecast profile variance compares the forecaster's probability profile with a flat profile that shows no variability across intervals (as would be given by a uniform forecaster). Finally, the skill score conveys the total effect of those mean probability score components that are mainly under the forecaster's control, hence reflecting the global forecasting skill. (For details of these components, see Appendix A.)
Pairwise comparisons of performances of ex- perts, semi-experts, and novices were made on each of the performance measures via M a n n - Whitney U tests. The performances of these groups were also compared with those of the
D. Onkal, G. Murado~lu / International Journal of Forecasting 12 (1996) 9-24 13
uniform and historical forecasters using sign tests. The uniform forecaster gives equal prob- abilities to all intervals, and hence provides a no-knowledge performance standard. A limited- knowledge performance standard is given by a historical forecaster who relies exclusively on past values. We employed two distinct definitions for historical forecasters. According to the first definition (H1), a historical forecaster is one who assigns probabilities to intervals that are equiva- lent to the last week's realized relative frequen- cies (which are constant for all the stocks, as in Yates et al., 1991). According to the second definition (H2), a historical forecaster is one who gives probabilistic forecasts for each stock that are equal to the last week's realized outcome vector (with a probability of 1.0 for the realized interval and 0 for the remaining intervals) for that stock. The first definition enables compari- sons of the forecasters' performances with a
market-wide historically-based distribution;
whereas the second definition permits compari- sons of forecasters' performances with stock-spe- cific historically-based distributions.
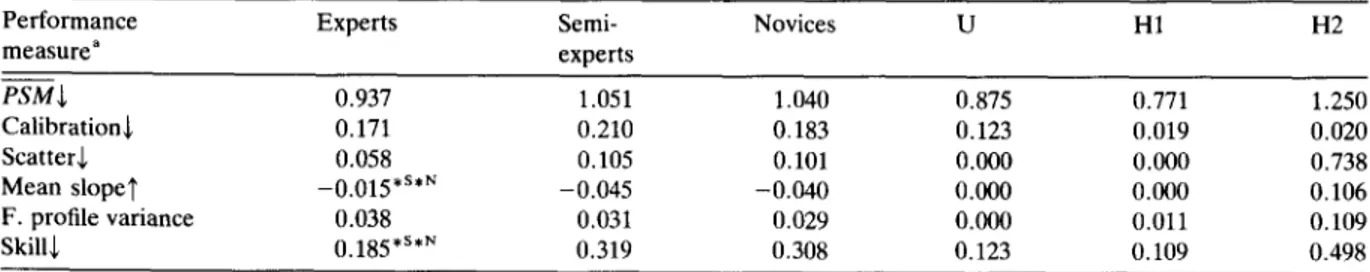
Table 1 displays the median values of the performance measures for the multiple-interval forecasts of experts, semi-experts, novices, the uniform forecaster, and the two historical fore- casters. Experts showed pronounced differences in slope and skill scores (p =0.024 and p = 0.026, respectively, for comparisons with semi-
experts; p =0.023 and p =0.021, respectively, for comparisons with novices). No significant differences were found between semi-experts and novices on any of the measures. Kruskal- Wallis tests also indicated that the only signifi- cant differences among the three groups were found for the slope (p = 0.006) and the skill (p = 0.012) components. The better mean slopes of experts (in comparison with both semi-experts and novices) indicate that experts were better in discriminating between instances when the actual price change would and would not fall into the specified intervals. The better skill scores of the experts demonstrate that the overall effect of
those PSM components under the forecasters'
control was more pronounced for the experts when compared with both the semi-expert and the novice groups.
The experts' performances, however, were not found to surpass the uniform forecaster. Only
38.5% of experts attained P S M scores better
(i.e. lower) than the P S M of the uniform fore-
caster, representing no significant differences ( p > 0 . 1 0 ) . It is worth noting here that the performance of the uniform forecaster depends on the number of categories that are used in the multiple-interval format.
Using last week's market-wide relative fre- quencies as forecasts for the current week, the first historical forecaster (H1) performed better than the experts on all measures (p = 0.0001 for
Table 1
Median values for various performance measures for multiple-interval forecasts of experts, semi-experts, and novices, with corresponding measures for the uniform forecaster (U), a historical forecaster using market-wide relative frequencies (H1), and a historical forecaster using stock-specific outcomes (H2)
Performance Experts Semi- Novices U H1 H2
measure a experts PSM + O. 937 1.051 1.040 0.875 0.771 1.250 Calibration+ 0.171 0.210 0.183 0.123 0.019 0.020 ScatterS, 0.058 0.105 0.101 0.000 0.000 0.738 Mean slope1' -0.015 *s*~ -0.045 -0.040 0.1300 0.000 0.106 F. profile variance 0.038 0.031 0.029 0.000 0.011 0.109 Skills 0.185*s*N 0.319 0.308 0.123 0.109 0.498
" +: Smaller values better; 'r: larger values better.
No direction given for F. profile variance since it compares forecaster's probability profile with a uniform profile. s Better than semi-experts.
N Better than novices. * p <0.05.
14 D. Onkalo G. Murado~lu / International Journal of Forecasting 12 (1996) 9-24
PSM, scatter and skill; p = 0.002 for calibration;
p = 0.046 for mean slope). Using last week's realized (stock-specific) outcome vectors for each stock, the second historical forecaster (H2) per- formed generally worse than the experts. In fact,
92.3% of experts attained better PSM scores
than H2 (p = 0.002). The superior performance of experts was mainly due to the better scatter (100% obtained better scores than H2; p - - 0.0001), and skill scores (92.3% obtained better scores than H2; p = 0.002). These findings can perhaps be interpreted with an argument for H2 providing a stock-specific performance threshold for experts, who are expected to forecast stock prices on the basis of the properties of individual stocks rather than market movements (as is the case with H1). It may be argued that the experts' forecasts incorporate rational expectations (i.e. expectations about the future stock prices) whereas the historically-based forecasts are built on the past performances of stock prices which represent adaptive expectations. These findings may also be related to the definition of H2 as a short-sighted stock-specific historical forecaster, who only considers the individual performance of stocks of the previous week. It may be argued that, depending on market conditions, a more realistic stock-specific performance standard would have a longer memory horizon. Such a
performance standard would primarily be
concerned with the formation of adaptive ex- pectations, an area definitely worth pursuing as an extension of current research.
In order to be able to compare multiple-inter- val forecasts with dichotomous forecasts, multip- le-interval forecasts were sign-aggregated (i.e. dichotomized) by the researchers. That is, the probabilities assigned to Intervals 5-8 on the multiple-interval format were summed and used as the probability assigned to the stock price increasing. Likewise, probabilities assigned to Intervals 1-4 on the multiple-interval format were summed and used as the probability as- signed to the stock price decreasing or staying the same. The resulting sign-aggregated forecasts were then comparable with dichotomous fore- casts.
Performance measures used to evaluate vari-
ous dimensions of forecasting accuracy of dich- otomous and sign-aggregated forecasts were the mean probability score (P-S), scatter, slope, calibration, and bias scores (for details on these measures, see Appendix B). If the outcome index is defined in terms of stock price increases,
PS gives a measure of overall accuracy, and
scatter presents the excessive variability in fore- casts. Slope provides an indication of the fore- caster's success in separating cases where the stock price will and will not increase. Calibration (referred to as 'price-increase calibration') mea- sures the extent to which the probabilistic fore- casts match the relative frequencies of occur- rence of stock price increase. Bias (referred to as 'over/underforecasting') gives an indication of the tendency to judge the stock price increase as being more likely (overforecasting) or less likely (underforecasting) than it really is. Positive bias scores reflect overforecasting (i.e. the mean probability assigned exceeding the relative fre- quency of price increase), and negative bias scores reflect underforecasting (i.e. relative fre- quency of price increase exceeding the mean probability assigned).
The outcome index may also be defined in terms of the correctness of the forecaster's pre-
dicted outcome. In this case, PS and scatter have
similar interpretations, while slope gives an indi- cation of the forecaster's ability to distinguish when (s)he is correct from when (s)he is incor- rect. Calibration (referred to as 'predicted-out- come calibration') provides an index of how closely the probabilistic forecasts match the proportions correct. Bias (referred to as 'over/ underconfidence') reflects the forecaster's ten- dency to judge the actual occurrence of the predicted outcome as being more likely (over- confidence) or less likely (underconfidence) than it really is. Positive bias scores reflect overconfi- dence (i.e. the mean probability assigned exceed- ing overall proportion correct), and negative bias scores reflect underconfidence (i.e. overall pro- portion correct exceeding the mean probability assigned).
The perf__ormance measures that are reported
include PS, scatter, slope, price-increase cali-
D. Onkal, G. Murado~lu / International Journal of Forecasting 12 (1996) 9-24 15
come calibration, and over/underconfidence. Scatter and slope scores were only given for the first outcome-index definition, since both defini- tions yield similar results and the first definition may be viewed as providing a direct comparison
with the multiple-interval case. Naturally, PS
scores were identical under the two definitions. Performances of experts, semi-experts, and novices were compared pairwise using Mann- Whitney U tests for each of the performance measures. Wilcoxon signed-ranks tests were used to compare the performances of the dichotomous and the sign-aggregated forecasts for each of the groups. Sign tests were employed to compare the performances of these groups with the uniform and the two historical forecasters.
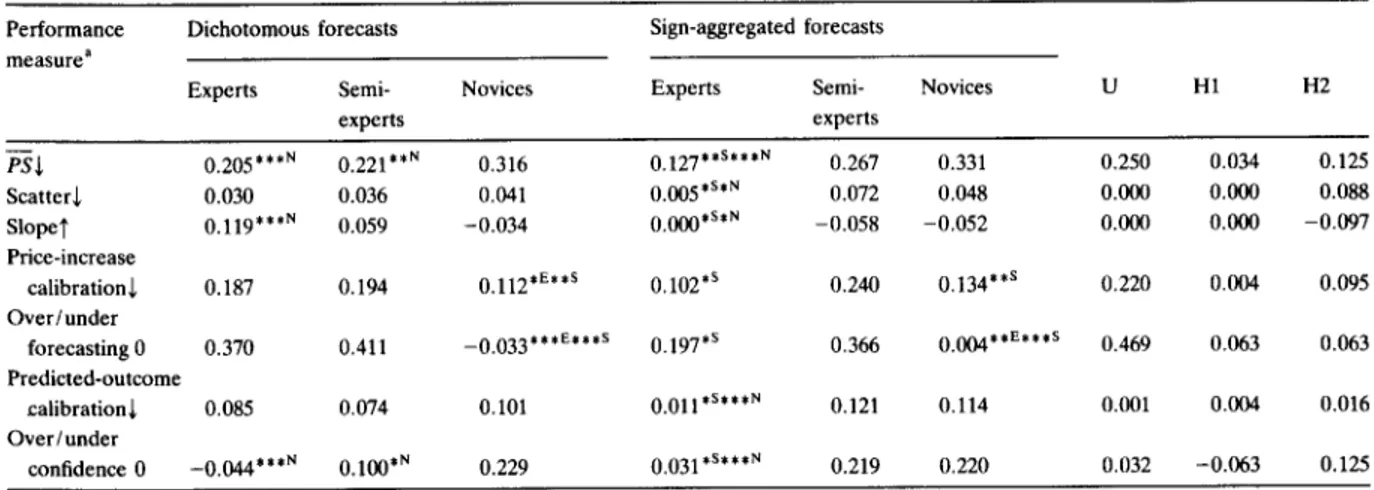
Table 2 displays the median values of the performance measures for the dichotomous and the sign-aggregated forecasts of experts, semi- experts, and novices. It can be observed from this exhibit that dichotomous forecasts given by experts and semi-experts were essentially the same. However, b__oth experts and semi-experts
attained better PS and over/underconfidence
scores than novices (p = 0.0001 and p = 0.006 for
PS comparisons of novices with experts and
semi-experts, respectively; p =0.0001 and p = 0.048 for over/underconfidence comparisons of novices with experts and semi-experts, respec- tively). Also, experts' discrimination was better than novices, as displayed via slope scores (p = 0.0001). For price-increase calibration and over/ underforecasting, novices outperformed both the experts and the semi-experts (p = 0.014 and p = 0.005 for price-increase calibration comparisons of novices with experts and semi-experts, respec- tively; p = 0.0000 for over/underconfidence comparisons of novices with both the experts and the semi-experts).
An analysis of the sign-aggregated forecasts showed that, when the probability forecasts provided using multiple-interval format were condensed into dichotomous format, experts generally outperformed both the semi-experts and the novices. In particular, when compared with semi-experts, experts showed a superior overall accuracy (as indexed by the mean prob- ability score; p = 0.007), accompanied by lower
T a b l e 2
M e d i a n v a l u e s f o r v a r i o u s p e r f o r m a n c e m e a s u r e s f o r d i c h o t o m o u s a n d s i g n - a g g r e g a t e d f o r e c a s t s o f e x p e r t s , s e m i - e x p e r t s , a n d n o v i c e s , a n d c o r r e s p o n d i n g m e a s u r e s f o r t h e u n i f o r m f o r e c a s t e r ( U ) , a h i s t o r i c a l f o r e c a s t e r u s i n g m a r k e t - w i d e r e l a t i v e f r e q u e n c i e s ( H 1 ) , a n d a h i s t o r i c a l f o r e c a s t e r u s i n g s t o c k - s p e c i f i c o u t c o m e s ( H 2 )
Performance Dichotomous forecasts Sign-aggregated forecasts
m e a s u r e a
Experts Semi- Novices Experts Semi- Novices U H1 H2
experts experts P'-S~ 0.205 ***N 0.221 **N 0.316 0.127 **s***N 0.267 0.331 0.250 0.034 Scatters 0.030 0.036 0.041 0.005 *s*r~ 0.072 0.048 0.000 0.000 Slope~' 0.119 ***N 0.059 - 0 . 0 3 4 0.000 *s*r~ - 0 . 0 5 8 - 0 . 0 5 2 0.000 0.000 Price-increase calibrations 0.187 0.194 0.112 *E**s 0.102 *s 0.240 0.134 **s 0.220 0.004 O v e r / u n d e r
forecasting 0 0.370 0.411 - 0 . 0 3 3 ***e***s 0.197 *s 0.366 0.004 **E***s 0.469 0.063 Predicted-outcome calibration ~, 0.085 0.074 0.101 0.011 *s***r~ 0.121 0.114 0.001 0.004 O v e r / u n d e r confidence 0 - 0 . 0 4 4 ***N 0.100 *N 0.229 0.031 *s***r~ 0.219 0.220 0.032 - 0 . 0 6 3 0.125 0.088 - 0 . 0 9 7 0.095 0.063 0.016 0.125
a ~: Smaller values better; 1': larger values better; 0 = values near 0 better. E Better than experts.
s Better than semi-experts. N Better than novices. * p < 0.05.
** p < 0.01. *** p < 0.001.
16 D. Onkal, G. Murado~lu / International Journal of Forecasting 12 (1996) 9-24
scatter (p =0.038), higher slope (p =0.024), better price-increase calibration ( p = 0 . 0 1 3 ) , lower overforecasting (p = 0.038), better predic- ted-outcome calibration (p = 0.017), and lower overconfidence (as shown by a lower positive bias score; p = 0.038). When compared with the no____vice group, experts attained better scores in
P S (p = 0.0000), scatter (p = 0.014), slope (p =
0.013), predicted-outcome calibration (p =
0.0001), and overconfidence (p =0.0009). On the other hand, novices were found to do less overforecasting than both the experts (p = 0.003) and the semi-experts (p = 0.0000); also showing better price-increase calibration than the semi- experts (p = 0.009).
Comparisons with the uniform forecaster dem- onstrated the superior performance of experts with respect to overall accuracy, especially in the sign-aggregated case. While only 69.2% of ex- perts performed better than the uniform fore- caster when presenting forecasts using the dich- otomous format (p >0.10), 84.6% of experts performed better than the uniform forecaster in the sign-aggregated case (p = 0.012). Given the previous findings on forecasters' poorer perform- ances in comparison with the uniform judge (Stael von Holstein, 1972; Yates et al., 1991), our results may reflect that the experts' forecast- ing accuracy can in fact exceed that of a uniform forecaster especially when the forecasts elicited using a multiple-interval format are condensed into a sign-aggregated format.
Comparisons with a historical forecaster who uses last week's realized relative frequencies for the market (i.e. H1) showed that the historical
forecaster performed better in P S , scatter, price-
increase calibration, overforecasting , and predic- ted-outcome calibration (p = 0.0001 for all mea- sures) for the dichotomous forecasts; and per- formed better only in scatter (p = 0.002) for the sign-aggregated forecasts. This historical fore- caster also attained poorer slope scores than the experts (p =0.046) in the dichotomous case. Comparisons with a historical forecaster who uses last week's stock-specific outcome vectors as forecasts (i.e. H2) revealed a similar situation. Such a historical forecaster was found to perform
better than experts in P S (p = 0.012), price-
increase calibration (p = 0.011), overforecasting (p =0.002), and predicted-outcome calibration (p = 0.002) for the dichotomous forecasts only. This historical forecaster showed inferior scatter (p =0.011), slope (p =0.0001), and overconfi- dence (p = 0.046) scores than the expert group in the dichotomous case; receiving poorer scatter (p =0.046), slope (p =0.002), and overconfi- dence (p = 0.046) scores in the sign-aggregated case. These findings may be viewed as providing additional evidence that the sign-aggregation of multiple-interval forecasts leads to better expert performance.
A comparison of the dichotomous forecasts with the sign-aggregated ones revealed interest-
ing results. Experts attained better P S ( p =
0.020), price-increase calibration ( p = 0 . 0 1 7 ) , overforecasting (p =0.002), predicted-outcome calibration (p = 0.014), and overconfidence (p = 0.002) scores when their forecasts were sign- aggregated. These findings indicated that, when the experts' multiple-interval forecasts were con- densed into the dichotomous scale, the resulting representation became better calibrated showing less overforecasting, and displayed better overall accuracy. Over/underconfidence scores also re- vealed that, while the experts showed under- confidence in providing dichotomous forecasts, they became overconfident when their multiple- interval forecasts were sign-aggregated. It should be noted that the experts were relatively less overconfident in the sign-aggregated situation and more underconfident in the dichotomous case, so that their over/underconfidence (in absolute terms) was better in the sign-aggregated representation. The better bias of experts in expressing their forecasts may be attributed to their initial use of the multiple-interval scale. Given that the experts are argued to employ richer representations (Murphy and Wright, 1984), the multiple-interval scale may be viewed as a more suitable format for expressing their beliefs, leading to an improved bias performance when such assessments are sign-aggregated in comparison with the direct elicitation of dich- otomous assessments.
In contrast to the experts, the use of the dichotomous format led to better forecasts when
D. Onkal, G. Muradoglu / International Journal of Forecasting 12 (1996) 9-24 17
compared with the sign-aggregated format for both the semi-expert and the novice groups. In particular, semi-ex__~perts' dichotomous forecasts
showed better PS (p =0.033), scatter (p =
0.033), slope (p = 0.006), price-increase calibra- tion (p = 0.033), and over/underconfidence (p = 0.005) scores; while the novices' dichotomous
forecasts demonstrated better PS (p =0.014),
scatter (p=0.012), price-increase calibration (p =0.003), and predicted-outcome calibration (p = 0.005) scores. These findings also support Murphy and Wright's (1984) argument that rich representations are a function of the level of expertise. Accordingly, the dichotomous scale may be viewed as providing a preferable medium of representation for expressing forecasts based on the limited knowledge domains of semi-ex- perts and novices.
5. Conclusion
Elicitation of probabilistic forecasts from port- folio managers and other banking professionals participating in a portfolio management work- shop provided the focus of this study. As noted by Bolger and Wright (1994), "..assessment of the quality of expert judgment is becoming a central issue for both researchers and practition- ers" (p. 21). Focusing on the financial forecasting domain, this paper attempted to assess the probabilistic forecasting performances of experts (relative to the performances of semi-experts and novices) under different task formats.
The inverse-expertise effect suggested by studies employing mainly student subjects has not been confirmed in general in this study, which involved non-student participants as well. The results obtained for the multiple-interval, dichotomous, and the sign-aggregated situations did not reveal an inverse-expertise effect in probabilistic forecasts of stock prices, with the exception of price-increase calibration and over/ underforecasting measures. The one-week fore- cast horizon employed in this study provides a plausible explanation for the lack of this effect across the different task formats utilized. Previ- ous research has suggested that the inverse-ex-
pertise effect may' be contingent upon the select- ed forecast horizon (Murado~lu and Onkal, 1994). In particular, it has been found that the performance of experts becomes worse than semi-experts as the forecast horizon is extended, even though the experts perform significantly better than the semi-experts for shorter forecast horizons (Murado~lu and Onkal, 1994). It may be argued that the shorter forecast horizons (e.g. one week) describe experts' natural environ- ments better in the sense that portfolio managers essentially make short-term forecasts in emerg- ing markets with higher volatilities. The portfolio managers' superior forecasting performance for the one-week horizon may in turn be attributed to the issue of ecological validity.
The alleged inverse-expertise effect has only been observed with price-increase calibration and over/underforecasting. In particular, the novices were found to display superior calibra- tion in predicting price increases, as well as showing minimal over/underforecasting. Ex- perts, on the other hand, were overforecasting, i.e. they had a higher tendency to judge a stock- price increase to be more likely than it really is. This finding confirms the results of previous studies examining brokerage analysts' recom- mendations (i.e. buy/sell advice) (Pratt, 1993; Womack, 1995). It has been asserted that experts are biased for stock-price increases since they prefer to recommend a buy decision (reflecting an expected stock-price increase) rather than a sell decision (reflecting an expected stock-price decrease). The experts' tendencies towards buy recommendations are viewed as stemming from the costs attached to incorrect judgments on sell recommendations (Pratt, 1993). These costs may include damage to the firm's and the analysts' reputation in terms of present and potential investment banking relationships and informa- tion flows. Therefore, sell recommendations are less frequent, and hence more visible and more risky (Womack, 1995). The resulting tendency of experts to make buy recommendations (indicat- ing predicted stock price increases) was displayed in this study via significant overforecasting on behalf of the portfolio managers.
18 D. Onkal, G. Murado~,lu / International Journal of Forecasting 12 (1996) 9-24
than their dichotomous forecasts, while the re- verse was true for semi-experts and novices. These findings may be viewed as suggesting that experts express their true predictions better when confronted with a multiple-interval format in comparison with a dichotomous format. In particular, the results imply that, while the experts can effectively utilize the more detailed format provided with the multiple-interval scale, semi-experts and novices perform better with the summarized/compact format presented with the dichotomous scale. These findings lend further support to previous research showing that re- sponse mode and the particular 'framing' of outcomes are significant factors in the elicitation of judgments (Tversky and Kahneman, 1982; Slovic et al., 1982). It may be argued that experts, who are endowed with abundant in- formation, can potentially express this rich in- formation better when presented with a response mode utilizing a wider scale (i.e. multiple-inter- val format) as opposed to a compressed scale (dichotomous format). On the other hand, the dichotomous scale may provide a better repre- sentation format for conveying forecasts based on the limited information sets of semi-experts and novices.
An aspect of forecasting accuracy that has received considerable research attention is the over/underconfidence component (Gigerenzer et al. 1991; Juslin, 1994; Keren, 1987; Lichtenstein et al., 1982; Paese and Sniezek, 1991). Our results confirmed the previous findings that ex- pertise has significant effects on confidence (Wright et al., 1994; Trafimow and Sniezek, 1994). The superior performance of experts was especially pronounced when their multiple-inter- val forecasts were sign-aggregated, again em- phasizing the use of a wider scale as a preferable representation format for expressing expert fore- casts. The slight overconfidence displayed with the sign-aggregated assessments may indicate that the wider scale provided by the multiple- interval format might be encouraging the experts to assign higher probabilities to the predicted direction of a price change. A potential explana- tion may be that the experts have a tendency to start giving their forecasts by assigning prob-
abilities to intervals addressing the predicted direction of a price change, which may in turn mean that they are left with lower probabilities for the remaining intervals. Another explanation could stem from the computational properties of the scores. Since the experts' dichotomous judg- ments were slightly underconfident, some a d d e d
positive bias would tend to make their PS scores
better. On the other hand, the semi-experts' and novices' dichotomous judgments were slightly overconfident. Hence, any added positive bias in their multiple-interval judgments would tend to
worsen their PS scores. Such possibilities need to
be examined with detailed research on the cogni- tive processes underlying the experts' probabilis- tic forecasts given under different task formats.
Multiple-interval forecasts of experts were found to outperform the historical forecasts based on stock-specific data in terms of overall accuracy, scatter and skill. When these forecasts were represented in sign-aggregated form, expert performance was observed to be superior in scatter, slope, and overconfidence. This indicates that the information regarding the expert's un- certainty presents valuable financial information in the sense that it reflects rational expectations rather than adaptive expectations. Most financial forecasts are made under the assumption of adaptive expectations with the processing of past data via econometric techniques. Our findings may be viewed as suggesting that, given a perti- nent task format, using probability forecasts that incorporate rational expectations of forecasters does not reduce the accuracy of forecasts, but on the contrary, presents enriched information (Glazer et al., 1990).
A fertile area of future research involves extensive comparisons of expert assessments with those given by historically-based forecasting techniques. For example, the performance of portfolios constructed using Markowitz's efficient frontier that employs historically-based mean and variance estimates (Markowitz, 1959) can be compared with the performance of similar por- tfolios constructed via expert assessments (Bar- tos, 1969). Also, different benchmarks utilizing abnormal returns and/or models incorporating univariate time series can be used to compare
D. Onkal, G. Murado~lu / International Journal of Forecasting 12 (1996) 9-24 1 9 the accuracy of judgmental forecasts (for a
detailed discussion, see Brown, 1993). Such future research will be particularly interesting in the context of emerging and presumably ineffi- cient markets, since the inaccuracies in forecasts are less attributable to the characteristics of the markets in such conditions.
Elicitation of experts' probabilistic forecasts using multiple formats also demands future work. Providing experts with information on observed discrepancies in multiple elicitations, incorporating self-checks on consistency and coherence into the assessment processes, and examining forecasters' revision processes remain intriguing research areas. The role of feedback in improving such elicitations of uncertainty also awaits meticulous exploration (Benson and Onkal, 1992; Bolger and Wright, 1993, 1994; Onkal and Murado~lu, 1995). Further research investigating the effects of training and feedback on the performance of experts' probabilistic forecasts is required.
Acknowledgements
The authors gratefully acknowledge George Wright and two anonymous referees for their comments.
Appendix A: Performance measures for evaluating probabilistic forecasts expressed in multiple-interval format
A . 1. M e a n probability score f o r multiple events
/
Let f = (fl, ..., fm) be the forecast vector given
by a forecaster for each of the stocks, with fk
denoting a probability forecast that the stock's price change will fall into interval k, k =
1, 2, .., m. Accordingly, let d = (dl, . . . , din) de-
fine an outcome index vector, with d k assuming the value of 1 if the realized price change falls within interval k, and assuming the value of 0 if it does not fall within interval k. The probability
score for multiple events ( P S M ) can then be
defined as
P S M = ( f - d ) ( f - d) + = ~ ( f k -- dk) 2.
Hence, the mean of probability scores (P---ffM) over a specified number of forecasting occasions (i.e. over a given number of stocks) gives an index of a forecaster's overall accuracy level. The lower the score, better is the overall accura- cy with respect to the stocks in question.
Components resulting from the Yates de-
composition of the P S M (Yates, 1988) are out-
lined next.
A . 2 . Calibration
Calibration provides information about the forecaster's ability to match the probability as- sessments with the realized relative frequencies. For example, suppose that for a set of 100 stocks a forecaster indicates that the price of each given stock will increase up to 5%, and that the mean of these probabilistic forecasts is 0.40. This forecaster's 0.40 assessments are well calibrated if an increase up to 5% is actually observed on 40 of the 100 stocks. Accordingly, a calibration
score is a function of fk (mean probability fore-
cast for interval k), and d k (realized relative
frequency for interval k). In particular, calibration = ~ ' k - - d k ) 2"
Lower scores indicate better performance in assigning appropriate probabilities to outcomes.
A . 3 . Scatter
Scatter is the remaining element of the overall forecast variance that is not directly attributable to the forecaster's ability to discriminate between occasions when the actual price change will and will not fall into the specified intervals. Given that scatter is basically evidence of excessive variance, lower values are more desirable. A scatter index is computed as follows:
scatter = ~ scatter k
= ~(1/N)[(N,k *Var(f~k))
+ (Nok *Var(f0k))],
20 D. Onkal, G. Murado~lu / International Journal of Forecasting 12 (1996) 9-24
Nlk forecasts given for a price change falling into interval k when it actually occurred. Similarly, Var(f0k ) is the conditional variance of the N0k forecasts given for a price change falling into interval k when it did not occur. As is clear,
N = N, = N,, +No,.
an 'across-interval variance' point of view. It presents an index of how different the fore- caster's probabilities are from those that would be given by a uniform forecaster.
A.6. Skill A. 4. Mean slope
Mean slope addresses another performance aspect that exhibits the forecaster's ability to discriminate between instances when the actual price change will and will not fall into the specified intervals. The higher the mean slope, the better the forecaster is able to discriminate. Mean slope is computed as follows:
mean slope = (1/m)~,slope k
= ( 1 ] m ) Z @ l k ---fOk) ,
where ]'1~ is the mean of probability forecasts for a price change falling into interval k computed over all the cases where the realized price change
actually fell into interval k. Similarly, fog is the
mean of probability forecasts for a price change falling into interval k computed over all the times when the realized price change did not fall into the specified interval. The number of inter- vals presented in the task is given by m, i.e. k = l , 2 .... ,m.
A.5. Forecast profile variance
The aggregate effect of those PSM compo-
nents under the forecaster's control can be measured through a skill score, computed as
skill = P S M - ~Var(dk)
= P S M - E[(2~)* (1-3~)1,
where Var(d,) gives the variance of the outcome
index d k for the interval k. Given that d~ values
are determined by the price changes realized in the stock market, E Var(dk) reflects an uncon-
trollable element of PSM (whose value is given
by the conditions of the stock market). Remov- ing this uncontrollable or 'base-rate' component
from PSM, we are left with the overall effect of
all those accuracy components that are mainly
controllable by the forecaster. Noting that lower
PSM values reflect better accuracy levels, lower
skill scores signal better overall forecasting qual- ity.
Appendix B: Performance measures for evaluating probabilistic forecasts expressed in dichotomous format
Forecast profile variance captures the dis- crepancy between a forecaster's set of prob- abilities (i.e. f = (fl, -.., f,,) and a uniform set of probabilities (i.e. f = ((I/m) .... , (I/m)). Ac- cordingly, the forecast profile variance compares the forecaster's probability profile with a flat profile displaying no variability across intervals. An index of the forecast profile variance could be computed as
forecast profile variance
= ( l l N ) ~ [ ( ~ k ( f k - - ( 1 / m ) ) 2 ) / m ]"
This measure provides an opportunity to ex- amine the profiles of probability forecasts from
When probabilistic forecasts are expressed in dichotomous format, there are two possible codings that could be utilized. The first coding (i.e. external coding) involves eliciting prob- abilistic forecasts for a given target event (e.g. stock price increase). These forecasts are then evaluated with the use of an outcome index that is defined with respect to the occurrence of the prespecified target event. The second coding (i.e. internal coding) requires that the forecaster first chooses one of two possible outcomes and then assesses the probability that his/her predicted outcome will indeed occur. An evaluation of these probabilistic forecasts is then made using an outcome index that is defined with respect to
D. Onkal, G. Murado~lu / International Journal of Forecasting 12 (1996) 9-24 21
the occurrence of the predicted outcome. As discussed extensively in Ronis and Yates (1987), although these codings share the same perform- ance measures, their interpretations vary sub- stantially. These measures and their connotation for the external and internal codings are dis- cussed next. Since the computational formulas remain the same for both codings, they are only presented under the external coding discussion. B.1. External coding
B. 1. I. Mean probability score
A potential extension of the multiple-interval format to the dichotomous format involves defin- ing f~ as the probability forecast given for a target event (e.g. the probability that the stock price will increase). Accordingly, 0 ~<f~ ~< 1.0. Letting the outcome index d i assume a value of 1 if the target event (i.e. price increase) indeed occurs for stock i, with d i assuming a value of 0
otherwise, the probability score for stock i (PSi)
becomes PS i = ( f / - di) 2.
Hence, the mean of probability scores (ffS) over a specified number of forecasting occasions (i.e. over a given number of stocks) gives an index of a forecaster's probability judgment accuracy. The lower the score, better is the overall accura- cy with respect to the stocks in question.
Components resulting from the Yates de-
composition of the PS (Yates et al., 1989) are
outlined next. B.1.2. Calibration
Calibration provides information about the forecaster's ability to match the probability as- sessments with the mean outcome indexes (i.e. relative frequencies of the occurrence of a price increase). The calibration component originated
with the Sanders (1963) decomposition of PS,
and was further employed in the Murphy (1973) decomposition.
A forecaster is said to be perfectly calibrated if, for all the stocks to which (s)he has assigned a 0.1 probability, 10% of the stocks actually show
a price increase; for all the stocks given a 0.2 probability, 20% actually increase in price, and so on. Accordingly, a calibration score can be computed as follows:
calibration = (1/N)2Np(fp _~p)2 ,
where fp addresses the probability forecast
categories (e.g. each forecast can be rounded to the nearest tenth, resulting in 0,0.1,0.2,..,1.0) which could be used by the forecasters. The total number of forecasts (i.e. stocks) is given by N,
with Np representing the number of instances i_n
which a forecast of fp is used. It follows that dp
shows the mean outcome index (i.e. the propor- tion of times the stock price actually increases)
corresponding to forecast fp. Lower calibration
scores indicate better performance in assigning probabilities that match the relative frequencies of occurrence of a stock price increase.
B.1.3. Scatter
Scatter is an index of the useless variability in probabilistic forecasts, with lower values being more desirable. A scatter index is computed as follows:
scatter = [(N 1 *Var(fl) ) + (N O *Var(fo))]/N ,
where Var(f~) is the variance of probabilities for all the N 1 cases when the stock price increases, and Var(f0) is the variance of probabilities for the N O cases when the stock price does not increase. As is clear, N = N 1 + N 0.
B.1.4. Slope
Slope provides an indication of the forecaster's performance in assigning higher probabilities to instances when the stock price actually increases versus those cases when it does not increase. The higher the slope, the better the forecaster is able to discriminate. Slope is computed as follows: slope = ~f~ -?0),
where fl is the mean of probability forecasts for all the cases when the stock price increases, and f0 is the mean of probability forecasts for all the
22 D. Onkal, G. Murado~lu / International Journal of Forecasting 12 (1996) 9-24
B. 1.5. Bias----over / underforecasting
Bias reflects the forecaster's performance in matching her mean probability assignments (f) to the overall relative frequency of stock price increase (d), that is,
bias = f - d.
If the mean of the probabilistic forecasts exceeds the overall relative frequency of price increase, then the forecaster is said to be ~overforecasting'. On the other hand, 'underforecasting' is revealed when the overall relative frequency of the price increase surpasses the mean probability assign- ments.
B.2. Internal coding
B.2.1. Mean probability score
The dichotomous format may require the forecaster to first choose from two outcomes (i.e. whether the stock price will (a) increase, or (b) decrease or stay the same). Forecasters are then requested to convey their degrees of belief in the occurrence of the chosen outcome by assessing subjective probabilities associated with the forecasted direction of price change. Hence, f// denotes the forecaster's probability that his/her chosen outcome will occur for stock i. Accord- ingly, 0.5 ~<f/~< 1.0. Outcome index d i assumes a value of 1 if the chosen outcome indeed occurs for stock i, and takes on a value of 0 otherwise. The mean of probability scores (P--S) over a specified number of forecasting occasions (i.e. over a given number of stocks) gives an index of a forecaster's probability judgment accuracy. The lower the score, the better is the overall accuracy with respect to the stocks in question.
B.2.2. Calibration
Calibration provides information about the forecaster's ability to match the probability as- sessments with the mean outcome indexes (i.e. the proportion of correct forecasts). If a fore- caster attains 50% correct forecasts for all her 0.5 assessments, attains 60% correct for all 0.6 assessments, etc. then the forecaster is said to be perfectly calibrated. Lower calibration scores
indicate better performance in assigning prob- abilities that match the proportion correct.
B.2.3. Scatter
Scatter gives a weighted average of the vari- ability in those instances when the predicted outcome actually occurs as well as the variability in those occasions when the predicted outcome does not occur. Hence, scatter is an index of the useless variability in probabilistic forecasts, with lower values being more desirable.
B.2.4. Slope
Slope provides an indication of the forecaster's performance in assigning higher probabilities to instances when her chosen outcome occurs than when it does not occur. The higher the slope, the better the forecaster is able to discriminate.
B.2.5. Bias--over / underconfidence
Bias reflects the forecaster's performance in matching her mean probability assignments ~ ) to the overall proportion of correct forecasts (d). If the mean of the probabilistic forecasts exceeds the overall proportion of correct forecasts, then the forecaster is said to be 'overconfident'. On the other hand, 'underconfidence' is revealed when the overall proportion correct surpasses the mean probability assignments (Lichtenstein and Fischhoff, 1977).
References
Bartos, J.A., 1969, The assessment of probability distribu- tions for future security prices, Unpublished Ph.D. thesis, Indiana University, Graduate School of Business. Batchelor, R. and P. Dua, 1990, Forecaster ideology, fore-
casting technique, and the accuracy of economic forecasts,
International Journal of Forecasting, 6, 3-10.
Benson, P.G. and D. Onkal, 1992, The effects of feedback and training on the performance of probability forecasters,
International Journal of Forecasting, 8, 559-573.
Bolger, F. and G. Wright, 1993, Coherence and calibration in expert probability judgement, OMEGA, 21, 629-644. Bolger, F. and G. Wright, 1994, Assessing the quality of
expert judgment: Issues and analysis, Decision Support Systems, 11, 1-24.
D. Onkal, G. Murado~lu / International Journal of Forecasting 12 (1996) 9-24 23 cations for capital markets research, International Journal
of Forecasting, 9, 295-320.
Bunn, D. and G. Wright, 1991, Interaction of judgemental and statistical forecasting methods: Issues and analysis,
Management Science, 37, 501-518.
Fama, E.F., 1991, Efficient capital markets: II, The Journal of Finance, XLVI, 1575-1617.
Flores, B.E., D.L. Olson and C. Wolfe, 1992, Judgmental adjustment of forecasts: A comparison of methods, Inter- national Journal of Forecasting, 7, 421-433.
Gigerenzer, G., U. Hoffrage and H. Kleinbolting, 1991, Probabilistic mental models: A Brunswikian theory of confidence, Psychological Review, 98, 506-528.
Glazer, R., J.H. Steckel and R.S. Winer, 1990, Judgmental forecasts in a competitive environment: Rational vs. adap- tive expectations, International Journal of Forecasting, 5, 149-162.
Goodwin, P. and G. Wright, 1991, Decision Analysis for Management Judgment (Wiley, Chichester).
Juslin, P., 1994, The overconfidence phenomenon as a consequence of informal experimenter-guided selection of almanac items, Organizational Behavior and Human Deci- sion Processes, 57, 226-246.
Keren, G., 1987, Facing uncertainty in the game of bridge: A calibration study, Organizational Behavior and Human Decision Processes, 39, 98-114.
Lichtenstein, S. and B. Fischhoff,1977, Do those who know more also know more about how much they know?: The calibration of probability judgments, Organizational Be- havior and Human Performance, 20, 159-183.
Lichtenstein, S., B. Fischhoff and L.D. Phillips, 1982, Calibration of probabilities: The state of the art to 1980, in: D. Kahneman, P. Slovic and A. Tversky (eds.),
Judgment Under Uncertainty: Heuristics and Biases (Cam- bridge University Press, Cambridge), 306-334.
Markowitz, H., 1959, Portfolio Selection: Efficient Diversifi- cation of Investments (Wiley, New York).
McNees, S.K., 1990, The role of judgment in macroeconomic forecasting accuracy, International Journal of Forecasting,
6, 287-299.
Murado~lu, G. and D. Onkal, 1992, Semistrong form ef- ficiency in the Turkish stock market, Middle East Technical University Studies in Development, 19, 197-208.
Murado~lu, G. and D. Onkal, 1994, An exploratory analysis of the portfolio managers' probabilistic forecasts of stock prices, Journal of Forecasting, 13, 565-578.
Murado~lu, G. and M. Unal, 1994, Weak form efficiency in the thinly traded Turkish stock exchange, The Middle East Business and Economic Review, 6, 37-44.
Murphy, A.H., 1973, A new vector partition of the probabili- ty score, Journal of Applied Meteorology, 12, 595-600. Murphy, G.L. and J.C. Wright, 1984, Changes in conceptual
structure with expertise: Differences between real world experts and novices, Journal of Experimental Psychology: Learning, Memory and Cognition, 10, 144-155.
Onkal, D. and G. Murado~lu, 1994, Evaluating probabilistic forecasts of stock prices in a developing stock market,
European Journal of Operational Research, 74, 350-358.
Onkal, D. and G. Murado~,lu, 1995, Effects of feedback on probabilistic forecasts of stock prices, International Journal of Forecasting, 11,307-319.
Paese, P.W. and J.A. Sniezek, 1991, Influences on the appropriateness of confidence in judgment: Practice, ef- fort, information, and decision-making, Organizational Behavior and Human Decision Processes, 48, 100-130. Phillips, L.D., 1987, On the adequacy of judgmental fore-
casts, in: G. Wright and P. Ayton (eds.), Judgmental Forecasting (Wiley, Chichester), 11-30.
Pratt, T., 1993, Wall Street's four-letter word, Investment Dealer's Digest, March, 18-22.
Ronis, D.L. and J.F. Yates, 1987, Components of probability judgment accuracy: Individual consistency and effects of subject matter and assessment method, Organizational Behavior and Human Decision Processes, 40, 193-218. Sanders, F., 1963, On subjective probability forecasting,
Journal of Applied Meteorology, 2, 191-201.
Slovic, P., B. Fischhoff and S. Lichtenstein, 1982, Response mode, framing, and information-processing effects in risk assessment, in: R.M. Hogarth (ed.) Question Framing and Response Consistency (Jossey Bass, San Francisco), 21-36. Stael von Holstein, C.A.S., 1972, Probabilistic forecasting: An experiment related to the stock market, Organizational Behavior and Human Performance, 8, 139-158.
Trafimow, D. and J.A. Sniezek, 1994, Perceived expertise and its effect on confidence, Organizational Behavior and Human Decision Processes, 57, 290-302.
Turner, D.S., 1990, The role of judgement in macroeconom- ic forecasting, Journal of Forecasting, 9, 315-345. Tversky, A. and D. Kahneman, 1982, The framing of
decisions and the psychology of choice, in: R.M. Hogarth (ed.), Question Framing and Response Consistency (Jossey Bass, San Francisco), 3-20.
Wolfe, C. and B. Flores, 1990, Judgmental adjustment of earnings forecasts, Journal of Forecasting, 9, 389-405. Womaek, K.L., 1995, Do brokerage analysts' recommenda-
tions have investment value?, Paper presented at the Annual Meeting of the American Finance Association, Washington, D.C.
Wright, G. and P. Ayton, 1987, The psychology of forecast- ing, in: G. Wright and P. Ayton (eds.), Judgmental Forecasting (Wiley, Chichester), 83-105.
Wright, G., G. Rowe, F. Bolger and J. Gammack, 1994, Coherence, calibration, and expertise in judgmental prob- ability forecasting, Organizational Behavior and Human Decision Processes, 57, 1-25.
Yates, J.F., 1988, Analyzing the accuracy of probability judgments formultiple events: An extension of the co- variance decomposition, Organizational Behavior and Human Performance, 30, 132-156.
Yates, J.F., L.S. McDaniel and E.S. Brown, 1991, Prob- abilistic forecasts of stock prices and earnings: The hazards of nascent expertise, Organizational Behavior and Human Decision Processes, 49, 60-79.
Yates, J.F., Y. Zhu, D.L. Ronis, D.-F. Wang, H. Shinotsuka and M. Toda, 1989, Probability judgment accuracy: China,
24 D. Onkal, G. Murado~lu / International Journal of Forecasting 12 (1996) 9-24
Japan, and the United States, Organizational Behavior and Human Decision Processes, 43, 145-171.
Zarnowitz, V. and L.A, Lambros, 1987, Consensus and uncertainty in economic prediction, Journal of Political Economy, 95, 591-621.
Biographies: Dilek ONKAL is an Assistant Professor of Decision Sciences at Bilkent University, Turkey. She re- ceived a Ph.D. in Decision Sciences from the University of Minnesota, and is doing research on decision analysis and probability forecasting. She has published in the European Journal of Operational Research, International Forum for
Information and Documentation, International Journal of Forecasting, Journal of Behavioral Decision Making, and the
Journal of Forecasting.
Gulnur MURADO(3LU is an Assistant Professor of Finance at Bilkent University, Turkey. She received a Ph.D. in Accounting and Finance from Bogazici University and is doing research on stock market efficiency and stock price forecasting, She has published in the European Journal of Operational Research, International Journal of Forecasting, Journal of Forecasting, and The Middle East Business and Economic Review.