PDF ISSN: 1528-2635
ACADEMY OF ACCOUNTING AND
FINANCIAL STUDIES JOURNAL
Mahmut Yardimcioglu, Karamanoglu Mehmetbey University
Academy Information
is published on the Allied Academies web page www.alliedacademies.org
The Academy of Accounting and Financial Studies Journal is owned and published by the DreamCatchers Group, LLC, and printed by Whitney Press, Inc. Editorial content is under the control of the Allied Academies, Inc., a non-profit association of scholars, whose purpose is to support and encourage research and the sharing and exchange of ideas and insights throughout the world.
Neither the DreamCatchers Group or Allied Academies is responsible for the content of the individual manuscripts. Any omissions or errors are the sole responsibility of the authors. The Editorial Board is responsible for the selection of manuscripts for publication from among those submitted for consideration. The Publishers accept final manuscripts in digital form and make adjustments solely for the purposes of pagination and organization.
The Academy of Accounting and Financial Studies Journal is owned and published by the DreamCatchers Group, LLC, 51 Blake Drive, Arden, NC 28704. Those interested in subscribing to the Journal, advertising in the Journal, submitting manuscripts to the Journal, or otherwise communicating with the Journal, should contact the Executive Director of the Allied Academies at [email protected].
Academy of Accounting and Financial Studies Journal Accounting Editorial Review Board Members
Agu Ananaba
Atlanta Metropolitan College Atlanta, Georgia
Richard Fern
Eastern Kentucky University Richmond, Kentucky Manoj Anand
Indian Institute of Management Pigdamber, Rau, India
Peter Frischmann Idaho State University Pocatello, Idaho Ali Azad
United Arab Emirates University United Arab Emirates
Farrell Gean
Pepperdine University Malibu, California D'Arcy Becker
University of Wisconsin - Eau Claire Eau Claire, Wisconsin
Luis Gillman Aerospeed
Johannesburg, South Africa Jan Bell
California State University, Northridge Northridge, California
Richard B. Griffin
The University of Tennessee at Martin Martin, Tennessee
Linda Bressler
University of Houston-Downtown Houston, Texas
Marek Gruszczynski Warsaw School of Economics Warsaw, Poland
Jim Bush
Middle Tennessee State University Murfreesboro, Tennessee
Morsheda Hassan
Grambling State University Grambling, Louisiana Douglass Cagwin
Lander University
Greenwood, South Carolina
Richard T. Henage Utah Valley State College Orem, Utah
Richard A.L. Caldarola Troy State University Atlanta, Georgia
Rodger Holland
Georgia College & State University Milledgeville, Georgia
Eugene Calvasina
Southern University and A & M College Baton Rouge, Louisiana
Kathy Hsu
University of Louisiana at Lafayette Lafayette, Louisiana
Darla F. Chisholm
Sam Houston State University Huntsville, Texas
Shaio Yan Huang Feng Chia University China
Askar Choudhury Illinois State University Normal, Illinois
Robyn Hulsart
Ohio Dominican University Columbus, Ohio
Natalie Tatiana Churyk Northern Illinois University DeKalb, Illinois
Evelyn C. Hume Longwood University Farmville, Virginia Prakash Dheeriya
California State University-Dominguez Hills Dominguez Hills, California
Terrance Jalbert
University of Hawaii at Hilo Hilo, Hawaii
Rafik Z. Elias
California State University, Los Angeles Los Angeles, California
Marianne James
California State University, Los Angeles Los Angeles, California
Academy of Accounting and Financial Studies Journal Accounting Editorial Review Board Members
Jongdae Jin
University of Maryland-Eastern Shore Princess Anne, Maryland
Ida Robinson-Backmon University of Baltimore Baltimore, Maryland Ravi Kamath
Cleveland State University Cleveland, Ohio
P.N. Saksena
Indiana University South Bend South Bend, Indiana
Marla Kraut University of Idaho Moscow, Idaho
Martha Sale
Sam Houston State University Huntsville, Texas
Jayesh Kumar
Xavier Institute of Management Bhubaneswar, India
Milind Sathye University of Canberra Canberra, Australia Brian Lee
Indiana University Kokomo Kokomo, Indiana
Junaid M.Shaikh
Curtin University of Technology Malaysia
Harold Little
Western Kentucky University Bowling Green, Kentucky
Ron Stunda
Birmingham-Southern College Birmingham, Alabama C. Angela Letourneau
Winthrop University Rock Hill, South Carolina
Darshan Wadhwa
University of Houston-Downtown Houston, Texas
Treba Marsh
Stephen F. Austin State University Nacogdoches, Texas
Dan Ward
University of Louisiana at Lafayette Lafayette, Louisiana
Richard Mason
University of Nevada, Reno Reno, Nevada
Suzanne Pinac Ward
University of Louisiana at Lafayette Lafayette, Louisiana
Richard Mautz
North Carolina A&T State University Greensboro, North Carolina
Michael Watters
Henderson State University Arkadelphia, Arkansas Rasheed Mblakpo
Lagos State University Lagos, Nigeria
Clark M. Wheatley
Florida International University Miami, Florida
Nancy Meade
Seattle Pacific University Seattle, Washington
Barry H. Williams King’s College
Wilkes-Barre, Pennsylvania Thomas Pressly
Indiana University of Pennsylvania Indiana, Pennsylvania
Carl N. Wright Virginia State University Petersburg, Virginia Hema Rao
SUNY-Oswego Oswego, New York
Academy of Accounting and Financial Studies Journal Finance Editorial Review Board Members
Confidence W. Amadi Florida A&M University Tallahassee, Florida
Ravi Kamath
Cleveland State University Cleveland, Ohio Roger J. Best
Central Missouri State University Warrensburg, Missouri
Jayesh Kumar
Indira Gandhi Institute of Development Research India
Donald J. Brown
Sam Houston State University Huntsville, Texas
William Laing Anderson College Anderson, South Carolina Richard A.L. Caldarola
Troy State University Atlanta, Georgia
Helen Lange Macquarie University North Ryde, Australia Darla F. Chisholm
Sam Houston State University Huntsville, Texas
Malek Lashgari University of Hartford West Hartford, Connetticut Askar Choudhury
Illinois State University Normal, Illinois
Patricia Lobingier George Mason University Fairfax, Virginia Prakash Dheeriya
California State University-Dominguez Hills Dominguez Hills, California
Ming-Ming Lai Multimedia University Malaysia Martine Duchatelet Barry University Miami, Florida Steve Moss
Georgia Southern University Statesboro, Georgia Stephen T. Evans
Southern Utah University Cedar City, Utah
Christopher Ngassam Virginia State University Petersburg, Virginia William Forbes
University of Glasgow Glasgow, Scotland
Bin Peng
Nanjing University of Science and Technology Nanjing, P.R.China
Robert Graber
University of Arkansas - Monticello Monticello, Arkansas
Hema Rao SUNY-Oswego Oswego, New York John D. Groesbeck
Southern Utah University Cedar City, Utah
Milind Sathye University of Canberra Canberra, Australia Marek Gruszczynski
Warsaw School of Economics Warsaw, Poland
Daniel L. Tompkins Niagara University Niagara, New York Mahmoud Haj
Grambling State University Grambling, Louisiana
Randall Valentine University of Montevallo Pelham, Alabama Mohammed Ashraful Haque
Texas A&M University-Texarkana Texarkana, Texas
Marsha Weber
Minnesota State University Moorhead Moorhead, Minnesota
Terrance Jalbert
University of Hawaii at Hilo Hilo, Hawaii
ACADEMY OF ACCOUNTING AND
FINANCIAL STUDIES JOURNAL
CONTENTS
Accounting Editorial Review Board Members . . . iii Finance Editorial Review Board Members . . . v LETTER FROM THE EDITORS . . . viii DO CEOS AND PRINCIPAL FINANCIAL OFFICERS
TAKE A “BATH” SEPARATELY OR TOGETHER?: AN INVESTIGATION OF DISCRETIONARY ACCRUALS SURROUNDING APPOINTMENTS
OF NEW CEOS AND PFOS . . . 1 Marshall A. Geiger, University of Richmond
David S. North, University of Richmond
EARNINGS MANAGEMENT AND LONG-RUN STOCK
UNDERPERFORMANCE OF PRIVATE PLACEMENTS . . . 31 Daoping He, San Jose State University
David C. Yang, University of Hawaii at Manoa Liming Guan, University of Hawaii at Manoa CORPORATE RISK INFORMATION IN ANNUAL
REPORTS AND STOCK PRICE BEHAVIOR IN THE
UNITED ARAB EMIRATES . . . 59 Md Hamid Uddin, University of Sharjah
DEFINED BENEFIT VS. DEFINED CONTRIBUTION RETIREMENT PLANS FOR FACULTY: AN EXPLORATION OF THE COST OF
A PORTABLE RETIREMENT . . . 85 John B. White, United States Coast Guard Academy
Morgan P. Miles, Georgia Southern University Roger White, University of Pittsburgh
DO FIRMS MANIPULATE EARNINGS WHEN
ENTERING THE BOND MARKET? . . . 99 Sangshin (Sam) Pae, Arkansas State University
Tina Quinn, Arkansas State University
AN ANALYSIS OF THE CONTENT OF FORM 20-F U.S. GAAP RECONCILIATION BY FOREIGN ENTITIES EMPLOYING IFRS:
IS THE SEC IFRS ROADMAP PREMATURE? . . . 117 John E. McEnroe, DePaul University
LETTER FROM THE EDITORS
Welcome to the Academy of Accounting and Financial Studies Journal. The editorial content of this journal is under the control of the Allied Academies, Inc., a non profit association of scholars whose purpose is to encourage and support the advancement and exchange of knowledge, understanding and teaching throughout the world. The mission of the AAFSJ is to publish theoretical and empirical research which can advance the literatures of accountancy and finance.
Dr. Mahmut Yardimcioglu, Karamanoglu Mehmetbey University, is the Editor. The mission is to make the AAFSJ better known and more widely read.
As has been the case with the previous issues of the AAFSJ, the articles contained in this volume have been double blind refereed. The acceptance rate for manuscripts in this issue, 25%, conforms to our editorial policies.
The Editor works to foster a supportive, mentoring effort on the part of the referees which will result in encouraging and supporting writers. He will continue to welcome different viewpoints because in differences we find learning; in differences we develop understanding; in differences we gain knowledge and in differences we develop the discipline into a more comprehensive, less esoteric, and dynamic metier.
Information about the Allied Academies, the AAFSJ, and our other journals is published on our web site. In addition, we keep the web site updated with the latest activities of the organization. Please visit our site and know that we welcome hearing from you at any time.
Mahmut Yardimcioglu, Karamanoglu Mehmetbey University
DO CEOS AND PRINCIPAL FINANCIAL OFFICERS
TAKE A “BATH” SEPARATELY OR TOGETHER?:
AN INVESTIGATION OF DISCRETIONARY
ACCRUALS SURROUNDING APPOINTMENTS
OF NEW CEOS AND PFOS
Marshall A. Geiger, University of Richmond
David S. North, University of Richmond
ABSTRACT
This study presents the first targeted examination of changes in financial reporting surrounding the appointment of both new CEOs and Principal Financial Officers (PFOs). We identify companies that appoint new CEOs and PFOs in the period 1995 to 2002 and find that the change in discretionary accruals is negative and significant in the year of hire (from t-1 to t) for firms appointing a new CEO or both a new CEO and PFO (i.e., the “big bath”), but not for firms appointing only a new PFO. We also find that firms appointing both executives in the same year report significant increases in discretionary accruals in the subsequent year (from t to t+1) and for the combined two-years surrounding the joint appointments (from t-1 to t+1). However, similar increases are not found for firms hiring only one of these executives. Additional analyses indicate that our results are robust when examining other discretionary financial reporting choices (i.e., special items, extraordinary items and discontinued operations), and that the type of compensation contract offered by the firm (i.e., having a high bonus component) is not significantly related to the changes in discretionary accruals surrounding these appointments. Our findings contribute to the corporate governance and executive turnover literature and provide evidence of a heightened financial reporting effect when firms concurrently appoint both new CEOs and PFOs.
INTRODUCTION
Personal certification requirements for Chief Executive Officers (CEOs) and Principal Financial Officers (PFOs) arrived in corporate America during the summer of 2002 in the form of an SEC Order and the watershed Sarbanes-Oxley Act (Sarbanes-Oxley Act 2002; SEC 2002b, 2002c). These legislative mandates were the first in the U.S. to require CEOs and PFOs to separately and personally file sworn statements with the SEC regarding the material accuracy and completeness of their companies’ periodic financial filings. The Congressional investigations
leading up to these mandates highlighted the significant influence of both the CEO and PFO on corporate financial reporting and led to the adoption of legislation to hold both of these individuals personally accountable for the release of accurate and complete corporate financial disclosures (SEC 2002a, Williams 2002; Geiger and Taylor 2003; Smith 2004). As implied by personal certification requirements, and argued by prior researchers (Pourciau 1993; Geiger and North 2006), individual CEOs and PFOs exert substantial influence on the reporting of their company’s financial condition, and a personnel change at either of these two positions could lead to significant changes in financial reporting outcomes for the company.
Prior researchers have paid particular attention to the effect of newly appointed CEOs on corporate financial reporting (Pourciau 1993; Murphy and Zimmerman 1993; Murphy 1999; Reitenga and Tearney 2003), and some research has begun investigation of the relationship between PFO appointments and a firm’s reported financial information (Mian 2001; Aier et al. 2005; Geiger and North 2006). However, prior studies have focused on either CEO or on PFO turnover effects, and have not adequately considered turnover at both senior financial executive positions. While Mian (2001) finds that turnover at the CFO position is often accompanied by CEO turnover, we find no extant study that adequately examines concurrent turnover in both of these financial executive positions. In fact, no prior study examining changes in CEOs has considered concurrent turnover in PFOs, and, no extant PFO turnover study has adequately assessed or controlled for concurrent CEO turnover.
In order to properly examine the effect of both CEO and PFO turnover on changes in corporate financial reporting, we identify a sample of large publicly traded firms appointing a new CEO, a new PFO, or concurrently appointing both a new CEO and PFO in the same year. If individual CEOs and PFOs have the ability to effect financial reporting, a likely outcome would be the reporting of unexpected financial results by the hiring firm. Thus, we examine changes in a company’s discretionary accounting accruals surrounding the change in personnel at either of these two positions. Using the EXECUCOMP database we are able to identify a sample of 9,550 company reporting years from 1995-2002 for which we can obtain unambiguous information on the individuals appointed as CEO and PFO of the firm. We use these reporting year observations to examine the effect of CEO and PFO turnover on financial reporting for large U.S. public companies. Specifically, we examine changes in a firm’s performance-adjusted total discretionary accruals surrounding CEO and PFO appointments. We assess total discretionary accruals in order to include all reported accruals and not only the current accruals that might be more easily managed by company reporting executives (DeFond and Jiambalvo 1994; Kothari et al. 2005). Further, we examine performance-adjusted accruals in order to provide better control for unidentified firm performance effects that might unwittingly affect our discretionary accruals measure (Kothari et al. 2005; Reynolds and Francis 2006). In addition, unlike most prior executive turnover studies, we employ a fixed-effects approach in our regression analyses that provides enhanced control for unspecified firm-specific factors by assigning each firm to serve as its own control.
Our results indicate that changes in performance-adjusted discretionary accruals for large U.S. firms appointing new CEOs, new PFOs, and both in the same year, were all negative in the initial reporting year of the new executive (i.e., the “big bath” from t-1 to t); however they were significant only for the CEO appointment firms and firms appointing both a CEO and PFO in the same year, but not for the PFO appointment firms. Further, we find that changes in discretionary accruals are positive in the first full reporting year after companies appoint these new individuals (i.e., from t to t+1), however they are significantly different from non-hiring firms only when firms concurrently appoint a new CEO and PFO. We also find that only the firms hiring both financial executives in the same year report significant increases in accruals over the entire t-1 to t+1 two-year period surrounding the new appointments, providing further support for the compound effects of concurrent CEO and PFO hires.
Additional analyses indicate that our results are robust to the specification of financial reporting choice. Specifically, our findings with respect to performance-adjusted total discretionary accounting accruals are reinforced when examining other financial reporting choices such as the reporting of special items, extraordinary items and discontinued operations for our sample of large U.S. public firms.
We then examine whether the type of compensation package offered by the hiring firm to the new executive is related to changes in reported discretionary accruals. Results of these additional analyses indicate that high bonus firms exhibit higher year-end levels of discretionary accruals, but are not associated with differences in changes in discretionary accruals compared to low bonus firms. Thus we find evidence of an association between compensation type and levels of discretionary accruals; however, we do not find an association between compensation type and changes in levels of accruals for our samples of hiring firms.
Motivation for our study comes not only from the lack of comprehensive research on the effects of financial executive turnover on reported financial performance, but also from the continuing interest of legislators, corporate directors, investors, auditors, and the SEC regarding corporate financial reporting and the ability of individuals to affect reported corporate financial information (Levitt 2000; SEC 2002b; US Senate 2002; Bartov and Mohanran 2004; Desai et al. 2006). An individual CEO’s or PFO’s affect on earnings management, and their role in overall corporate governance, continues to be an issue of considerable debate and research focus (McVay 2006; Larcker et al. 2007; Cohen et al. 2008).
Our study contributes to the existing literature in several important ways. First, it extends the corporate governance and executive turnover literature, as well as the discretionary accounting choice literature, by presenting a comprehensive examination of the effect of both CEO and PFO turnover on changes in corporate financial reporting. Prior research has focused either on CEO turnover or PFO turnover, but has not adequately examined concurrent turnover in both of these financial executive positions. Second, we provide improved statistical analyses of changes in firm’s discretionary accounting accruals by examining performance-adjusted total accruals, and employ a firm fixed-effects approach in our analyses to provide better control for performance related and
firm-specific factors often overlooked in prior studies. Third, we contribute to the ongoing debate within the corporate governance literature regarding the significant influence of individual financial executives within the firm (Shen and Cannella 2002; Wells 2002; Smith 2004).
The remainder of the paper is organized as follows. Section 2 discusses the related literature and develops our hypotheses. Section 3 presents our research method. Section 4 presents our empirical results and Section 5 presents additional and robustness tests. The final section summarizes our main findings and offers suggestions for further research.
PRIOR LITERATURE AND HYPOTHESES CEO Turnover and Financial Reporting
Financial statement participants, including corporate executives, investors, regulators, audit committees and external auditors, are all concerned with individuals and companies attempting to misrepresent the true financial position of the firm by manipulating reported accounting information (Levitt 1998, 2000; SEC 2000; Bartov et al. 2002; Bartov and Mohanran 2004; Desai et al. 2006). This concern has generated a considerable amount of research over the years into the influence of CEOs on the quality of corporate reporting and the existence of earnings management through the use of discretionary accounting choices (DeAngelo 1988; Dechow and Sloan 1991; Puffer and Weintrop 1991; Aboody and Kasznik. 2000; Barton and Simko 2002; Dechow and Dichev 2002; Wells 2002; Brickley 2003; Engle et al. 2003; McVay 2006; Larcker et al. 2007; Cohen et al. 2008). The influence of individual CEOs on corporate financial reporting has typically been assessed by identifying situations where large public companies appoint a new individual and then examining changes in reported financial information surrounding this turnover event. In sum, prior studies on CEO turnover have consistently found that companies appointing new CEOs are more likely to report reduced income in the initial year of the new CEO (i.e., at time t) – the financial “big bath” phenomena – and then report increased income in the immediately succeeding years (i.e., at time
t+1) (Strong and Meyer 1987; DeAngelo 1988; Pourciau 1993; Murphy and Zimmerman 1993;
Denis and Denis 1995; Murphy 1999; Wells 2002). In this way, new CEOs are often able to lay claim to improved financial performance under their new leadership. However, prior research has also concluded that companies hiring a new CEO are generally poorer performers in terms of previous stock price performance and financial profitability, with smaller firms being the most sensitive to these performance indicators (Murphy 1999; Matusmoto 2002). Prior empirical work has also documented that in planned successions, outgoing CEOs may attempt to inflate earnings and discretionary accounting accruals in their last years prior to departure in order to increase compensation and the likelihood of maintaining board seats (Dechow and Sloan 1991; Murphy and Zimmerman 1993; Reitenga and Tearney 2003).
However, no prior examination of CEO turnover has considered the impact of concurrent PFO appointments during the CEO turnover event horizon. The results of Geiger and North (2006)
regarding the significant influence of CFOs on reported financial results, coupled with the fact that a substantial number of firms appoint a new CEO and PFO in the same year (Mian 2001), call in to question whether the results of these earlier CEO turnover studies are driven, or at least influenced, by concurrent PFO turnover.
PFO Turnover and Financial Reporting
While the literature is fairly established for CEO changes and corporate reporting, there has been relatively little direct investigation of the influence of the PFO in the financial reporting process. In the first general examination of PFO appointments, Mian (2001) examined companies hiring a new CFO and documents where the new CFOs come from and where the former CFOs went to in the corporate executive turnover process. Similar to CEO turnover events, he also concluded that CFO turnover is often punitive in nature, in that it is regularly preceded by poor stock price and operating income performance; and also noted that CFO turnover is preceded by relatively high CEO turnover. However, Main (2001) did not assess the effect of CFO turnover on the company’s reported financial results.
More recently, several post-Sarbanes-Oxley Act studies have begun to examine the impact of PFO appointments on corporate financial reporting by assessing levels of discretionary accounting accruals. Menon and Williams (2004), Dowdell and Krishnan (2004) and Geiger et al. (2005) examine the impact of a company hiring a financial reporting executive directly from their external audit firm – i.e., the hiring practice referred to as the “revolving door” – which is now restricted under the Sarbanes-Oxley Act. Menon and Williams (2004) examine companies that over time have appointed former partners of their external audit firm to PFO positions, as well as to board of director’s positions, and find that discretionary accruals are significantly higher for companies appointing individuals from their external audit firms into PFO positions. Dowdell and Krishnan (2004) and Geiger et al. (2005) provide a more direct assessment of hiring individuals directly from the company’s external audit firm into corporate financial reporting positions and report mixed results. Dowdell and Krishnan (2004) conclude that levels of signed and absolute discretionary accruals are higher for these hiring companies, while Geiger et al. (2005) find no differences with respect to changes in absolute total accruals or non-operating accruals once these individuals begin their employ with the company.
The first targeted examination of the general effect of hiring PFOs on company financial reporting is presented in Geiger and North (2006). Their study examines changes in signed current discretionary accruals surrounding CFO appointments for a broad sample of public companies and concludes that current discretionary accruals decrease significantly over a two year period surrounding the appointment of a new CFO. Geiger and North (2006) also present a test for concurrent CFO and CEO hiring by examining a sub-sample of their CFO hiring firms that also appointed a new CEO. However, their analysis may be confounded by their identification of concurrent CEO appointments. Specifically, they identify CFO hiring firms that also appoint a CEO
during the t-1 to t+1 time period surrounding the CFO appointment. Therefore, they include not only cases where companies appoint both a new CFO and CEO in the same year, but also companies that hire a CFO in one year and a CEO in either the year prior or subsequent to the CFO hiring (i.e., years t-1 and t+1). This possible confounding due to the inclusion of differing timings of the CEO and CFO appointments readily could have lead to their non-significant results when assessing this sub-sample of CFO hiring firms, particularly in light of the findings of the present study.
Changes in Discretionary Accruals and CEO/PFO Turnover
Prior authors have argued that the level of discretionary accounting accruals reported by a company is an indication of management’s use of the reporting flexibility and choice inherent in current generally accepted accounting principles that allow companies considerable latitude to either increase or decrease reported net income (Schipper 1989; Jones 1991; Healy and Wahlen 1999; Levitt 2000; DeFond and Park 2001). Earlier research has differentiated between nondiscretionary (or normal) and discretionary (or abnormal) components of accounting accruals. Nondiscretionary accruals are the expected, or normal, level of accruals for the company based on factors such as type of operating industry, company size, level of property plant and equipment, and revenue growth (Jones 1991; DeFond and Jiambalvo 1994; Kothari et al. 2005). The discretionary, or abnormal, accrual for a company is the unexpected component of accruals and is the difference between actual levels reported and the level expected to be reported by the company for the period. Since discretionary accruals are largely subject to management’s reporting judgment, and are therefore potentially more easily changed than are nondiscretionary accruals, if individual CEOs and PFOs can significantly impact corporate financial reporting we would expect that influence to be manifest in changes in the levels of discretionary accruals reported by companies making a change in senior financial executive personnel. In this study we examine the association between appointing a new CEO or new PFO and changes in a company’s financial reporting by assessing changes in total discretionary accounting accruals. We assess total signed discretionary accruals in order to include all firm reported accruals and not only the current accruals that might be more easily managed by company reporting executives (DeFond and Jiambalvo 1994; Levitt 2000).
Prior research has consistently documented that new CEOs are more likely to reduce income when they are first appointed (i.e., the “big bath” in time t), and then report significant increases in income in the year subsequent to their appointment (in time t+1) (Strong and Meyer 1987; DeAngelo 1988; Pourciau 1993; Murphy and Zimmerman 1993; Denis and Denis 1995; Murphy 1999; Wells 2002). In other words, the new executive wants to “clean the corporate financial house” when they are first appointed and they do so by making reporting choices that reduce income in the year of their hire in order to report more favorable results in subsequent years under their direction. Once the company has eliminated the possible effects of future asset write-downs or reserve shortfalls, for example, by taking the write-offs and increasing reserves in their initial year, future periods are less likely to include these or similar charges to income and, therefore, appear more profitable in
comparison. Thus, we expect that our total discretionary accruals results would be consistent with this general pattern of income reducing accruals from time t-1 to t when the new executive is hired, and then show income increasing accruals in the subsequent year from time t to t+1.
When examining CFO turnover, however, Geiger and North (2006) identify a broad sample of public firms and find that CFO hiring companies have significantly higher current discretionary accruals in the year prior to appointing a new CFO (in time t-1) and then report uniform decreases in these current discretionary accruals over the entire t-1 to t+1 period. Unlike the earlier CEO turnover research, they report that the decrease in current discretionary accruals from t-1 to t for their sample of all firms in COMPUSTAT is not significant for the CFO turnover firms, indicating no substantial support for the “big bath” in the initial reporting period. Geiger and North (2006) also report that the change in current discretionary accruals from t to t+1, unlike the findings on CEO turnover, is again negative but not significant. However, they find that the aggregate two-year change in current discretionary accruals for their sample of CFO hiring firms is significantly negative compared to non-hiring firms.
There are several possible reasons for the disparity in the findings regarding the change in financial reporting between the CEO turnover studies and the results reported in Geiger and North (2006) for CFO turnover. It could be that CEOs and CFOs differ with respect to their influence on the reported results of their firms. This might suggest that CEOs have greater influence over these reported changes than CFOs, or that new CEOs are more interested in reporting subsequent positive financial results than are new CFOs. The difference may also be due to the use of differing financial reporting metrics across the studies. Prior CEO turnover studies have often used summary financial measures such as changes in net income or total accruals; however, Geiger and North (2006) examine changes in current discretionary accruals, representing only a portion of all firm accruals. Additionally, the differences in sample composition between studies likely affect the results. Specifically, Geiger and North (2006) include all firms in COMPUSTAT with available data, leading to the inclusion of a significant number of relatively small public firms in their sample. In contrast, the vast majority of earlier CEO turnover research has been performed on the largest public companies where financial and turnover data has historically been more readily available. For example, Engel et al. (2003) and Reitenga and Tearney (2003) use the Forbes Annual Compensation Survey consisting of the 800 largest public firms to identify their sample, Farell and Whidbee (2003), similar to the present study, use the EXECUCOMP database to identify their sample, and Desai et al. (2006) indicate that the average total assets for firms in their study is $1.1 billion. This compares to the average total assets for the sample of firms examined in Geiger and North (2006) of only $88 million. Thus, the average firm size in the sample examined in Geiger and North (2006) is on the order of approximately 11 times smaller than most prior research examining CEO turnover. Accordingly, somewhat divergent results between studies using different financial reporting metrics and vastly different sizes of sample firms may not be unexpected when examining executive turnover.
Since the majority of the extant CEO turnover research has been performed on larger, more closely followed public firms like those included used in this study, we believe our results will be more consistent with the “big bath” reporting phenomena documented in the extant CEO turnover literature. This expectation is also driven by the fact that we examine total discretionary accruals, and not current accruals, in order to assess changes in overall firm reporting postures surrounding these new executives (DeFond and Jiambalvo 1994; Kothari et al. 2005). Therefore, we expect that our sample of large companies hiring new CEOs and new PFOs would initially report significant reductions in the level of total discretionary accruals in the year of appointment (from t-1 to t) and then report significant increases in total discretionary accruals in the year after their initial appointment (from t to t+1) compared to companies not hiring a new CEO or new PFO. Thus, the first hypothesis examined in our study is:
H1: Companies that appoint a new CEO or PFO report significant reductions in
signed discretionary accruals upon their hire and then report significant increases in signed discretionary accruals in the subsequent year compared to other non-hiring firms.
As previously discussed, we believe that both individual CEOs and PFOs have generally the same incentives to affect the financial results of their companies. However, no prior research has directly compared the financial reporting changes surrounding the appointments of both CEOs and PFOs. Accordingly, it is an empirical question as to whether the new CEO or the new PFO is associated with greater changes in a company’s reported financial statement results. Thus, our second hypothesis (in null form) examines the relative impact of hiring individuals at these two positions on the change in the firm’s reported total discretionary accruals:
H2: Companies that appoint a new CEO report similar changes in signed
discretionary accruals surrounding their hire as companies appointing a new PFO.
Concurrent CEO and PFO Appointments and Changes in Financial Reporting
Our study is the first to allow for the accurate examination of the combined effects of appointing new individuals to both CEO and PFO positions in the same reporting year. We expect larger changes in financial reporting for companies appointing new executives to both positions for several reasons. First, if both top financial reporting executives are replaced in the same year, neither individual is as readily captured by the commitment to prior policies and decisions as the former executives and thus the new executive is more willing to adopt new approaches to financial accounting and reporting issues than their predecessors (Tversky and Kahneman 1981; Ross and Staw 2003). This lack of commitment to prior reporting policies is compounded if both executives
are replaced in the same year (McNamara et al 2002; Jensen 2007), leaving neither of the two new executives bound by previous reporting decisions. We argue that the changes in accruals would be heightened by the fact that both of the new financial reporting executives no longer need to be concerned about making reporting choices that were supported by the other financial executive since that person is also no longer with the firm (McNamara et al 2002; Ross and Staw 2003). That is, a new PFO, for example, no longer needs to be concerned about the reporting choices made or supported by the former CEO since that person has also been replaced in the current year. Thus, appointing new individuals to both of these positions in the same year reduces each individual’s concern for changing reporting practices or choices (e.g., estimates, reserve balances, internal and external accounting and disclosure policies, etc) formerly approved by not only their predecessor, but by the other senior financial reporting executive. This reduction in the reliance on prior reporting choices would then lead to greater changes in financial reporting and, therefore, greater changes in discretionary accruals for firms appointing both a new CEO and PFO in the same year.
Additionally, prior research has found significantly different decision-making processes develop within a new decision-making group when several individuals are replaced than would be found if only one new influential decision-maker (i.e., a CEO or PFO) were added to the existing group (LePine 2003; Choi and Thompson 2005; Bosman et al. 2006). Therefore, we would expect this new, substantially changed group, and new group decision-making dynamic would lead to greater changes in reporting decisions and result in more substantial changes in discretionary accruals compared to companies hiring only one new top financial reporting executive in any one year. Accordingly, our third hypothesis addresses the joint effect on changes in discretionary accruals when firms concurrently hire individuals at both senior executive financial reporting positions:
H3: Companies that appoint both a new CEO and PFO in the same year report greater changes in signed discretionary accruals than firms hiring only a new CEO or new PFO.
RESEARCH METHOD Sample Identification
To identify our sample of public companies appointing new CEOs and PFOs from 1995 to 2002 we use the EXECUCOMP database for the years 1994 to 2003. While this database constitutes an average of just 20.2 percent of the number of publicly traded firms in the U.S. , the firms in EXECUCOMP represent an average of 64.5 percent of total U.S. market capitalization for all publicly traded firms included in COMPUSTAT over our sample period. Thus, the EXECUCOMP database contains data on large public firms and also provides yearly information on the top five salaried individuals for each firm. EXECUCOMP also specifically identifies the CEO of each firm
and any CEO turnover dates. In order to identify the PFO for each firm-year we searched the five top salaried employees and verified the inclusion of the CEO as well as identified the top financial reporting executive. If no financial reporting executive was listed in the top five for a given firm-year, we searched the firm’s annual report or 10k filing and identified the person who signed as the firm’s PFO. Additionally, if EXECUCOMP identified more than one financial executive in the top five compensated individuals for the firm, we used the signatures on the annual report or 10k filing to identify the PFO. We then tracked these individuals over time to identify PFO turnover events. For identified CEO and PFO turnover events we were able to identify start dates in either the 10k filings or by searching for announcements on Factiva. We were also able to obtain annual reports and 10k filings for all companies in the EXECUCOMP database for all of our sample years. As a final check on the accuracy of our appointment data, we hand verified all CEO and PFO identifications in our samples, if not already performed, by reference to annual reports or 10k filings, ensuring that our specification of newly appointed individuals and continuing appointments is accurate.
Consistent with prior discretionary accounting accruals studies, we exclude financial services and utilities industry firms due to idiosyncratic and industry specific financial reporting issues. After these data requirements are satisfied, we are able to obtain complete data on a sample of 786 firm-years indicating the appointment of a new CEO (i.e., the CEO sample), 1,232 firm-years indicating the appointment of a new PFO (i.e., the PFO sample), and 335 firm-years indicating the appointment of a new CEO and a new PFO concurrently in the same reporting year (i.e., the BOTH sample) in the years 1995-2002.
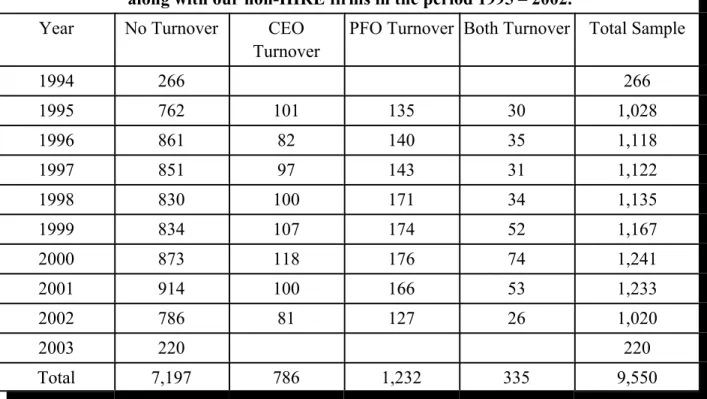
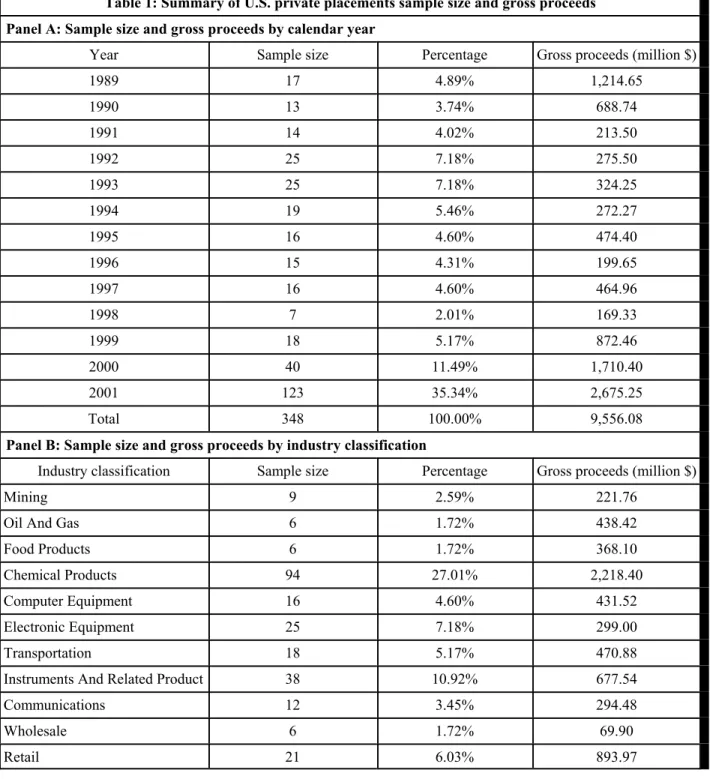
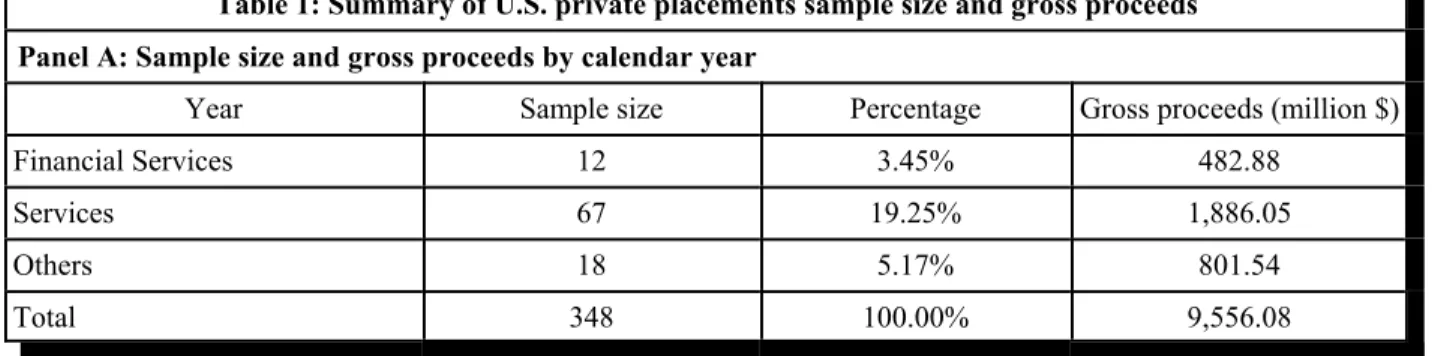
We are also able to identify 7,197 firm-years with no CEO or PFO turnover. These firm-year observations comprise our non-HIRE control sample and include all firm-years for the companies in EXECUCOMP with necessary data to calculate the discretionary accruals models and all control variables used in our multivariate regressions. Additionally, of these non-turnover year observations, 3,891 firm-years were also not included in any of the t-1 or t+1 years surrounding a CFO or PFO appointment. Accordingly, we use the 7,197 non-hire observations in our combined sample regression analyses that provide control for the t-1 to t+1 years surrounding a CFO or PFO appointment and we use the 3,891 observations when making univariate comparisons of turnover firms to non-turnover firms. Unlike prior research that has individually addressed either CEO turnover or PFO turnover, our study accurately identifies three separate hiring groups (i.e., CEO, PFO, BOTH) as well as firms having no turnover, resulting in the creation of highly precise samples for examination. Table 1 presents the distribution of our sample of 9,550 firm-year observations for the CEO, PFO, BOTH and non-HIRE companies across the years of our examination period.
Table 1: Sample Distribution
Distribution for our samples of companies that appointed a new CEO, PFO or BOTH, along with our non-HIRE firms in the period 1995 – 2002.
Year No Turnover CEO
Turnover
PFO Turnover Both Turnover Total Sample
1994 266 266 1995 762 101 135 30 1,028 1996 861 82 140 35 1,118 1997 851 97 143 31 1,122 1998 830 100 171 34 1,135 1999 834 107 174 52 1,167 2000 873 118 176 74 1,241 2001 914 100 166 53 1,233 2002 786 81 127 26 1,020 2003 220 220 Total 7,197 786 1,232 335 9,550
As presented in Table 1, the distribution of hiring and non-hiring firms is relatively evenly distributed across our 1995 to 2002 examination period. Table 2 presents descriptive data on the variables used in our regressions for our samples of non-HIRE companies and companies hiring CEOs, PFOs, and BOTH for each of the three years surrounding the turnover event. We winsorize outliers (top and bottom 1 percent in each year) for discretionary accruals, size, book-to-market ratio, distress (measured using Zmijewski’s [1984] model), cash flow scaled by total assets, and sales growth percentage. Our results are substantively unchanged if we delete the top and bottom 1 percent of firms instead of winsorizing these outliers.
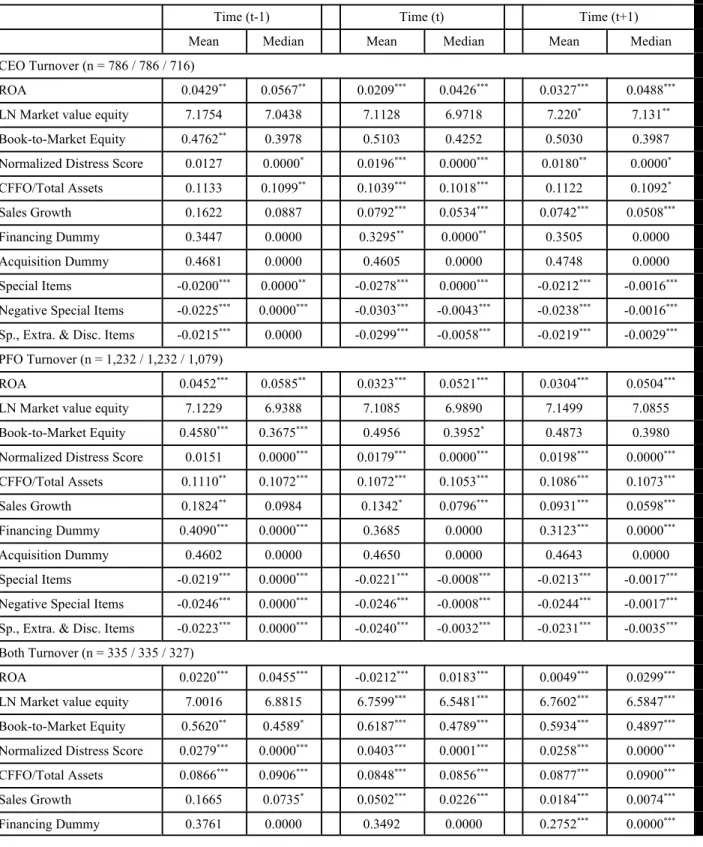
The sample size in time t+1 for the CEO, PFO, and BOTH samples are slightly lower due to events in which the new executive did not remain with the company for a second year. As also indicated in Table 2, we find significant differences in each of the three groups in terms of mean and median return on assets (ROA) between our CEO, PFO and BOTH samples compared to the non-HIRE control firm years. Consistent with prior research (Denis and Denis 1995; Mian 2001), our hiring firms exhibit significantly lower ROA than the non-HIRE control firms. As discussed in the next section, in order to mitigate the effect of firm performance on our estimates of discretionary accruals, we employ a performance-adjusting procedure to arrive at our discretionary accruals metric (Francis et al. 2005; Kothari et al. 2005; Cahan and Zhang 2006).
Table 2: Descriptive Statistics
Descriptive statistics for our samples of CEO, PFO and BOTH hiring firms along with the non-HIRE firms. Time t is the year of the new appointment for the hire firms.
Time (t-1) Time (t) Time (t+1)
Mean Median Mean Median Mean Median
CEO Turnover (n = 786 / 786 / 716)
ROA 0.0429** 0.0567** 0.0209*** 0.0426*** 0.0327*** 0.0488***
LN Market value equity 7.1754 7.0438 7.1128 6.9718 7.220* 7.131**
Book-to-Market Equity 0.4762** 0.3978 0.5103 0.4252 0.5030 0.3987
Normalized Distress Score 0.0127 0.0000* 0.0196*** 0.0000*** 0.0180** 0.0000*
CFFO/Total Assets 0.1133 0.1099** 0.1039*** 0.1018*** 0.1122 0.1092*
Sales Growth 0.1622 0.0887 0.0792*** 0.0534*** 0.0742*** 0.0508***
Financing Dummy 0.3447 0.0000 0.3295** 0.0000** 0.3505 0.0000
Acquisition Dummy 0.4681 0.0000 0.4605 0.0000 0.4748 0.0000
Special Items -0.0200*** 0.0000** -0.0278*** 0.0000*** -0.0212*** -0.0016***
Negative Special Items -0.0225*** 0.0000*** -0.0303*** -0.0043*** -0.0238*** -0.0016***
Sp., Extra. & Disc. Items -0.0215*** 0.0000 -0.0299*** -0.0058*** -0.0219*** -0.0029***
PFO Turnover (n = 1,232 / 1,232 / 1,079)
ROA 0.0452*** 0.0585** 0.0323*** 0.0521*** 0.0304*** 0.0504***
LN Market value equity 7.1229 6.9388 7.1085 6.9890 7.1499 7.0855
Book-to-Market Equity 0.4580*** 0.3675*** 0.4956 0.3952* 0.4873 0.3980
Normalized Distress Score 0.0151 0.0000*** 0.0179*** 0.0000*** 0.0198*** 0.0000***
CFFO/Total Assets 0.1110** 0.1072*** 0.1072*** 0.1053*** 0.1086*** 0.1073***
Sales Growth 0.1824** 0.0984 0.1342* 0.0796*** 0.0931*** 0.0598***
Financing Dummy 0.4090*** 0.0000*** 0.3685 0.0000 0.3123*** 0.0000***
Acquisition Dummy 0.4602 0.0000 0.4650 0.0000 0.4643 0.0000
Special Items -0.0219*** 0.0000*** -0.0221*** -0.0008*** -0.0213*** -0.0017***
Negative Special Items -0.0246*** 0.0000*** -0.0246*** -0.0008*** -0.0244*** -0.0017***
Sp., Extra. & Disc. Items -0.0223*** 0.0000*** -0.0240*** -0.0032*** -0.0231*** -0.0035***
Both Turnover (n = 335 / 335 / 327)
ROA 0.0220*** 0.0455*** -0.0212*** 0.0183*** 0.0049*** 0.0299***
LN Market value equity 7.0016 6.8815 6.7599*** 6.5481*** 6.7602*** 6.5847***
Book-to-Market Equity 0.5620** 0.4589* 0.6187*** 0.4789*** 0.5934*** 0.4897***
Normalized Distress Score 0.0279*** 0.0000*** 0.0403*** 0.0001*** 0.0258*** 0.0000***
CFFO/Total Assets 0.0866*** 0.0906*** 0.0848*** 0.0856*** 0.0877*** 0.0900***
Sales Growth 0.1665 0.0735* 0.0502*** 0.0226*** 0.0184*** 0.0074***
Table 2: Descriptive Statistics
Descriptive statistics for our samples of CEO, PFO and BOTH hiring firms along with the non-HIRE firms. Time t is the year of the new appointment for the hire firms.
Time (t-1) Time (t) Time (t+1)
Mean Median Mean Median Mean Median
Acquisition Dummy 0.4865 0.0000 0.4298 0.0000 0.4128 0.0000
Special Items -0.0287*** 0.0000*** -0.0437*** -0.0106*** -0.0255*** -0.0065***
Negative Special Items -0.0307*** 0.0000*** -0.0452*** -0.0106*** -0.0283*** -0.0065***
Sp., Extra. & Disc. Items -0.0288*** 0.0000*** -0.0457*** -0.0134*** -0.0293*** -0.0074***
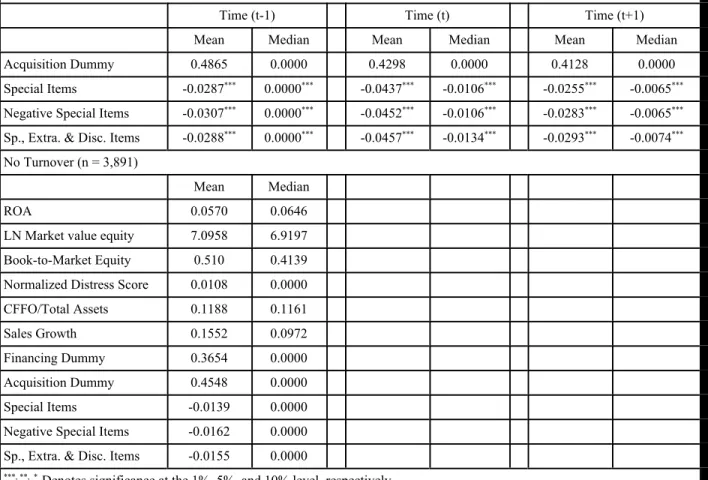
No Turnover (n = 3,891)
Mean Median
ROA 0.0570 0.0646
LN Market value equity 7.0958 6.9197 Book-to-Market Equity 0.510 0.4139 Normalized Distress Score 0.0108 0.0000
CFFO/Total Assets 0.1188 0.1161
Sales Growth 0.1552 0.0972
Financing Dummy 0.3654 0.0000
Acquisition Dummy 0.4548 0.0000
Special Items -0.0139 0.0000
Negative Special Items -0.0162 0.0000 Sp., Extra. & Disc. Items -0.0155 0.0000
***, **, * Denotes significance at the 1%, 5%, and 10% level, respectively.
Note – P-values were calculated using two-tailed t-tests (Wilcoxon rank sum tests) for differences in means (medians).
For all other control variables and alternate specifications of discretionary accounting choice (e.g., Special Items, Negative Special Items, and Special Items, Extraordinary Items and Discontinued Operations items – discussed further in a subsequent section), except the Acquisition indicator variable (ACQ), we find significant differences between our samples of hiring firms and our non-HIRE control years for one or more of the periods examined. Accordingly, we use these additional measures identified in prior research in our regression analyses to control for the effects of these differing factors on the levels and changes in levels of discretionary accruals across our samples.
Discretionary Accruals Measure
Following prior research (DeFond and Jiambalvo 1994; Becker et al. 1998; Chung and Kallapur 2003; Geiger and North 2006) we examine signed discretionary accruals. These earlier
researchers have argued that companies are rarely sued for booking accruals to reduce earnings, so examining signed discretionary accruals is the most appropriate measure of the intentional influence of management on financial reporting. Additionally, we expect directional changes in discretionary accruals in that we hypothesize a reduction in signed accruals corresponding with the hire of a new CEO or PFO, and then an increase in signed accruals in the subsequent reporting year. Accordingly, we examine signed total discretionary accruals in our study.
Following prior research, we use the modified cross-sectional version of the Jones (1991) model introduced by DeFond and Jiambalvo (1994) and calculate total discretionary accruals using the following model:
AC i, t /TAi, t-1 = β1 [1/TAi, t-1] + β2 [[CREVi, t - CAR] / TA i, t-1] + β3 [PPEi, t / TA i, t-1] + ei (1)
where: AC is our accruals measure defined as income before extraordinary items less operating cash flows adjusted for discontinued operations and extraordinary items (Hribar and Collins 2002), TA is total assets, CREV is change in revenue, CAR is change in accounts receivable, and PPE is property, plant and equipment, for firm i at year t. Following Francis et al. (2005) and Cahan and Zhang (2006), we estimate the model cross-sectionally for every firm in COMPUSTAT based on the Fama and French (1997) industry groupings containing at least 20 firms, excluding the sample firm. The estimated coefficients from the industry regressions are used to predict accruals for the sample firms in our study. Discretionary accruals (DA) are calculated as actual accruals minus the predicted accruals. All COMPUSTAT firms with available data are used to calculate DA, even if they were not included in EXECUCOMP or did not have all data available to enable them to be used in the later analyses.
As noted in the previous section, and consistent with prior research, our hiring firms exhibit significantly lower financial performance in terms of return on assets (ROA) than our non-HIRE control firms. Kothari et al. (2005) provide evidence that when assessing discretionary accruals across firms, Type I error rates are inflated if the portioning variable is correlated with performance – as it is in our samples. In order to mitigate this bias we compute a performance-adjusted measure of DA (Kothari et al. 2005). Following Francis et al. (2005) and Cahan and Zhang (2006) we use all firms with available COMPUSTAT data for each Fama and French (1997) industry and divide each industry sample into deciles based on ROA. We then compute the performance-adjusted discretionary accrual (PDA) for our sample firms by taking the DA for firm i from eq. 1 and subtracting the median unadjusted DA for firm i’s industry ROA decile. We also exclude firm i from the computation of the median industry-ROA deciles.
Our performance-adjusting procedure, while it may lower the power of our statistical tests compared to non-performance-adjusting, reduces discretionary accruals estimation errors and eliminates any idiosyncrasies derived when employing a firm-by-firm ROA matching procedure (Francis et al. 2005; Ayers et al. 2006). We use these performance-adjusted discretionary accruals (PDA) metrics as our measure of discretionary accruals reported by the firm.
RESULTS
In order to examine the influence of individual CEOs and PFOs over corporate financial reporting, we present data on the year-end performance-adjusted discretionary accruals positions of our sample firms for periods immediately before to immediately after companies appoint a new CEO or PFO. Consistent with Cahan and Zhang (2006) and Geiger and North (2006), the main focus of our study is on the changes in levels of PDA. Accordingly, we also examine changes in PDA over the period beginning immediately prior to the hiring event (i.e., time t-1) to the first full reporting period after the new executives take over financial reporting responsibility (i.e., time t+1) in our assessment of the influence of individuals on reported discretionary accruals. Table 3 presents the PDA and change in PDA results for our samples of hiring firms and the non-HIRE control sample.
Table 3: Univariate Results – Performance-Adjusted Discretionary Accruals (PDA)
Panel A: Discretionary accruals by time generated by the modified cross-sectional Jones (1991) model; PDA is performance-adjusted discretionary accruals. Panel B: Changes in performance-performance-adjusted discretionary accruals from time (t-1) to time (t+1). Time t is the year of appointment for the sample of CEO, PFO and BOTH hiring firms, and all non-HIRE firm years. PANEL A: Year-end comparisons
Observations Time (t-1) Time (t) Time (t+1)
Firm Years (t-1) / (t) / (t+1) Mean Median Mean Median Mean Median
Non-Hires 3,891 / 3,891 / 3,891 -0.0182*** -0.0143*** -0.0182*** -0.0143*** -0.0182*** -0.0143***
CEO turnover 786 / 786 / 716 -0.0269*** -0.0175*** -0.0251*** -0.0207*** -0.0194*** -0.0190***
PFO turnover 1,232 / 1,232 / 1,079 -0.0195*** -0.0163*** -0.0232*** -0.0179*** -0.0181*** -0.0158***
Both turnover 335 / 335 / 327 -0.0184*** -0.0089*** -0.0321*** -0.0255*** -0.0085 -0.0101**
Non-Hires vs. CEO turnover -0.0086*** -0.0032* -0.0068** -0.0064** -0.0011 -0.0047
Non-Hires vs. PFO turnover -0.0012 -0.002 -0.0049* -0.0036 0.0001 -0.0015
Non-Hires vs. Both turnover 0 0.0054 -0.0139*** -0.0112** 0.0097** 0.0042
CEO turnover v. PFO turnover 0.0074* 0.0012 0.0018 0.0028 0.0012 0.0032
CEO turnover v. Both turnover 0.0086 0.0086 -0.007 -0.0048 0.0108* 0.0089**
PFO turnover v. Both turnover 0.0011 0.0074 -0.0089 -0.0076 0.0096* 0.0057
PANEL B: PDA comparisons
Changes in PDA Time (t) - Time (t-1) Changes in PDA Time (t+1) – Time (t) Changes in PDA Time (t+1) - Time (t-1)
Firm Years Mean Median Mean Median Mean Median
Non-Hires 2,696 / 2,696 / 2,673 -0.0031 -0.0001 -0.0031 -0.0001 -0.0032 0.0005 CEO turnover 786 / 786 / 716 0.0025 0.0003 0.0051 0.0014 0.0090** -0.0019
PFO turnover 1,232 / 1,232 / 1,079 -0.0039 -0.0001 0.0068** 0.0045* 0.0022 0.003
Both turnover -0.0115* -0.0061 0.0241*** 0.0079** 0.0122* 0.0015
Table 3: Univariate Results – Performance-Adjusted Discretionary Accruals (PDA)
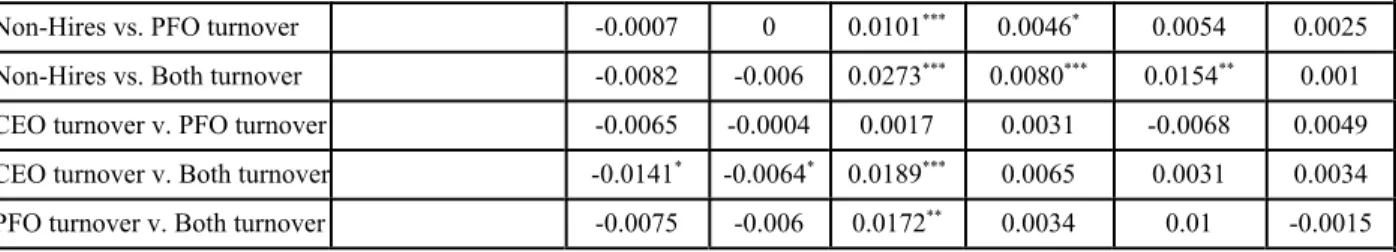
Non-Hires vs. PFO turnover -0.0007 0 0.0101*** 0.0046* 0.0054 0.0025
Non-Hires vs. Both turnover -0.0082 -0.006 0.0273*** 0.0080*** 0.0154** 0.001
CEO turnover v. PFO turnover -0.0065 -0.0004 0.0017 0.0031 -0.0068 0.0049 CEO turnover v. Both turnover -0.0141* -0.0064* 0.0189*** 0.0065 0.0031 0.0034
PFO turnover v. Both turnover -0.0075 -0.006 0.0172** 0.0034 0.01 -0.0015 *** , **, * Denotes significance at the 1%, 5%, and 10% level, respectively. Note – P-values were calculated using two-tailed
tests.
Univariate Tests
In performing our calculation of PDA for our sample firms, we use all available firm data in COMPUSTAT to estimate our DA and PDA measures. The use of all available data to estimate PDA for our EXECUCOMP firms results in a non-zero mean (median) PDA for our EXECUCOMP sample firms. Table 3 indicates that the mean (median) PDA for our sample of 3,891 non-HIRE firm-years is -1.82 (-1.43) percent of total assets. In fact, Panel A of Table 3 indicates that all mean (median) PDA levels, with the exception of the BOTH firm mean in t+1, are significantly different than zero at p < .05. We calculate the change in PDA (PDA) for the non-HIRE firms by using all available non-HIRE firm-years that have continuous data for two consecutive years when calculating the one-period change; and that have all necessary data over three consecutive years when calculating the two-period change. This results in a sample of 2,696 non-HIRE firm observations for the one-year change and 2,673 non-HIRE firm observations for the two-year PDA comparison. We use the non-HIRE sample results, as opposed to zero, as a benchmark to compare our samples of CEO, PFO, and BOTH hiring firms.
Panel A of Table 3 presents the year-end PDA results and comparison tests for the CEO, PFO and BOTH samples. When comparing among companies that hire CEOs, PFOs or BOTH, our year-end comparisons indicate that the PFO firms report higher PDA than the CEO firms at time t-1 (p < .10), and the BOTH companies report significantly lower mean PDA at time t than the PFO firms (p < .10), and higher mean PDA than the CEO and PFO hiring companies at time t+1 (p < .05). However, the focus of our study and our hypotheses address changes in PDA for our samples of hiring firms, which are reported in Panel B of Table 3.
As noted in Panel B, the one-year mean (median) PDA is -0.31 (-0.01) percent of total assets and the two-year mean (median) PDA is -0.32 (-0.05) percent of total assets for the non-HIRE firms, both of which are not significantly different from zero. Thus, even though our non-HIRE firms report a non-zero initial mean PDA in t-1, they report very little change in PDA over a one-year or a two-one-year time horizon.
In examining the PDA for our hiring samples from t-1 to t we find significant differences when compared to the non-HIRE control firms only for the BOTH firms (p < .10). These univariate
results suggest that CFOs and PFOs take a bigger “earnings bath” in their first year if they are hired together than when they are appointed separately. Further, in assessing the t to t +1 time period we find that all three hiring groups report significantly increased PDA compared to the non-HIRE control firms. Specifically, the mean PDA for the t to t +1 period for the CEO sample is significant at the p < .10 level, and the increase for the PFO and BOTH samples are significant at the p < .01 level. Thus, we find consistent evidence of the use of more income increasing PDA over the t to t+1 period for all of our hiring firms.
Assessing the relative differences in PDA among our three samples of hiring firms, we find that the CEO and PFO samples report similar PDA in both of the one-year sub-periods. However, our sample of BOTH firms report significantly greater decreases in mean PDA in the t-1 to t time period compared to the CEO firms (p < .10), and report significantly greater increases in mean PDA in the t to t+1 period than the CEO firms (p < .01) and PFO sample firms (p < .05). In sum, these results indicate that PDA are fairly consistent among the CEO and PFO hiring firms, but are greater for the BOTH sample firms in terms of PDA reduction during the initial year of hire (t-1 to t) and increases in the subsequent reporting year (t to t+1).
When we examine the combined two-year change period surrounding the executive hiring in the last two columns of Panel B we find that the mean ΔPDA change from t–1 to t+1 is greater for the CEO sample (p < .01) and BOTH sample (p < .05) compared to the mean two-year change for the non-HIRE control firms. The non-HIRE firms report a mean two-year change of – 0.32 percent while the CEO firms report an increase of 0.90 percent and the BOTH firms report an increase of 1.22 percent. When we compare among companies that hire CEOs, PFOs or BOTH, our univariate tests reveal no significant differences in PDA among our three hiring groups for the combined period from t-1 to t+1. Next, we conduct multivariate analyses to investigate whether our univariate results are robust to controlling for other factors found to be associated with discretionary accruals.
Multivariate Tests
To provide examination of the impact of hiring a new CEO, PFO or both on PDA and PDA, we combine our hire and non-hire samples and use the following multivariate model to control for factors found in prior research to be related to levels of discretionary accruals:
PDA, PDA = a + b1CEOt-1,t,t+1/PFO t-1,t,t+1/BOTH t-1,t,t+1 + b2MVE + b3BM +
b4DISTRESS + b5CFFO + b6GROWTH + b7FINANCE+ b8ACQ (2)
where:
PDA = performance-adjusted discretionary accruals estimated from the modified cross-sectional Jones (1991) model,
PDA = changes in performance-adjusted discretionary accruals estimated from the modified cross-sectional Jones (1991) model,
CEOt-1 = 1 if company hired a CEO in the succeeding year, 0 otherwise, CEOt = 1 if company hired a CEO in the current year, 0 otherwise, CEOt+1 = 1 if company hired a CEO in the previous year, 0 otherwise, PFOt-1 = 1 if company hired a PFO in the succeeding year, 0 otherwise, PFOt = 1 if company hired a PFO in the current year, 0 otherwise,
PFOt+1 = 1 if company hired a PFO in the previous year, 0 otherwise,
BOTHt-1 = 1 if company hired both a CEO and PFO in the succeeding year, 0 otherwise,
BOTHt = 1 if company hired both a CEO and PFO in current year, 0 otherwise,
BOTHt+1 = 1 if company hired both a CEO and PFO in previous year, 0 otherwise, and the
additional control variables are MVE = log of the market value of equity,
BM = book-to-market equity ratio,
DISTRESS = financial distress measure (calculated from Zmjewski 1984), CFFO = cash flow from operations divided by total assets,
GROWTH = sales growth rate,
FINANCE = 1 if number of o/s shares increased by at least 10 percent or long-term debt increased by at least 20 percent during the year, and
ACQ = 1 if the company engaged in an acquisition during the year.
In order to simultaneously assess all three hire samples and the years surrounding these appointments to the non-HIRE control firms, we estimate our year-end PDA and PDA regression models using all firm years with available data. The year-end PDA regression examines all firm-year observations and includes time period indicator variables for t-1, t, and t+1 for each of our three samples of hiring firms. To examine the PDA over a one-year period (either from t-1 to t, or from
t to t+1), we include indicator variables for our three samples of hiring firms for each of the one-year
time periods. When examining the PDA over the entire two-year period (from t-1 to t+1), we include indicator variables for each of our three samples of hiring firms in the model.
Following prior literature, we include controls for company size, financial condition, operating cash flow, sales growth, and structural changes due to significant new financing or acquisitions. While our accruals measures are scaled for size, and our sample contains relatively larger sized firms from the EXECUCOMP database, it is still possible that scaled accruals or changes in accruals may be related to firm size. We use the log of market value of equity (MVE) at the end of the period as our measure of firm size. Geiger and North (2006) find that MVE is positively related to levels of discretionary accruals. BM is the proportion of book value to market value and represents the growth opportunities available to the firm. Ashbaugh et al. (2003), Butler et al. (2004), and Menon and Williams (2004) have found BM to be negatively related to discretionary accruals.
Even though we use performance-adjusted discretionary accruals metrics, we include an additional measure of financial condition (DISTRESS) due to concerns that the Jones (1991) model may over estimate accruals for poorly performing companies (Dechow et al. 1995; Kothari et al. 2005). We use Zmijewski’s (1984) measure of financial distress as our firm condition metric. Greater values of DISTRESS indicate higher levels of financial stress present in the firm. Reynolds and Francis (2000), Ashbaugh et al. (2003), and Menon and Williams (2004) find evidence that financial health is negatively associated with discretionary accruals. CFFO is our measure of operating cash flow scaled by total assets. Prior research has shown that CFFO is negatively related to discretionary accruals (Ashbaugh et al. 2003; Becker et al. 1998; Chung and Kallapur 2003; Frankel et al. 2002). Sales growth has also been found to be positively associated with discretionary accruals (Menon and Williams 2004). Accordingly, we include a sales growth variable (GROWTH), measured as the percentage growth in sales over the period, into our regression models. We include a measure of significant changes in company financing (FINANCE) and whether the company entered into an acquisition during the period (ACQ) due to concerns regarding the effects of significant changes in capital structure on estimating accounting accruals and because of the possible limitations of accruals management imposed by the structure of the balance sheet (Barton and Simko 2002). Prior research by Ashbaugh et al. (2003) and Chung and Kallapur (2003) provide evidence that significant changes in financing and entering into a substantial acquisition are positively related to discretionary accruals.
We initially examine year-end PDA levels, and then we assess the PDA from t-1 to t, from
t to t+1, and from t-1 to t+1 as dependent variables in our regression analyses. In our second set of
regressions, because we are examining changes in PDA, and because discretionary accruals tend to reverse over time, we use the changes in our control variables and we also include the initial level of PDA exhibited by the firm at the start of the period (i.e., either PDAt-1 or PDAt, depending on the
model). Including initial levels of PDA provides a control for the potential differences in the magnitude of accruals reversals across firms based on initial PDA levels for our sample firms. Accordingly, we would expect there to be a negative relationship between initial levels of PDA and PDA over the ensuing period. In our PDA regression models we also include the changes in our control variables across the time period examined. Based on the change regression results in Geiger and North (2006) we expect to find positive associations between PDA and MVE, GROWTH, and FINANCE, and negative associations between PDA and BM,?DISTRESS, CFFO, and ACQ.
In order to provide additional statistical control for unidentified firm effects not captured in our control variables, we perform our PDA and PDA analyses using a firm fixed-effects model. The firm fixed-effects model gauges the effects of within-firm variation over time, which provides a more direct, and we believe a more accurate, assessment of firm-specific PDA changes over the time periods surrounding executive turnover. Results of our combined sample regressions are presented in Table 4.
Table 4: Regression Results
Regression models for the combined samples of CEO, PFO, BOTH and non-HIRE firms in the period 1995 – 2002. Time t is the year of the new appointment. Dependent variables are performance-adjusted discretionary accruals (PDA) and in changes in performance-adjusted discretionary accruals (PDA). P-values are in parentheses.
Panel A: Regressions Variables PDA at Year-end (1) Exp. sign Variables Exp sign One-year PDA (2) Two-year PDA (3) CEO (t-1) -0.0096*** (0.001) ? CEO Turnover (t) – (t-1) --0.0054* (0.100) CEO (t) -0.0110*** (0.000) - PFO Turnover (t) – (t-1) --0.0030 (0.288) CEO (t+1) -0.0017 (0.560) % Both Turnover (t) – (t-1) --0.0121** (0.017) PFO (t-1) 0.0020 (0.412) ? CEO Turnover (t+1) – (t) % 0.0019 (0.566) PFO (t) -0.0028(0.264) - PFO Turnover (t+1) – (t) % (0.131)0.0044 PFO (t+1) (0.288)0.0027 % Both Turnover (t+1) – (t) % 0.0149
*** (0.003) Both (t-1) -0.0086** (0.050) ? CEO Turnover ? 0.0003 (0.910) Both (t) -0.0163*** (0.000) _ PFO Turnover ? 0.0040 (0.167) Both (t+1) 0.0064 (0.150) % Both Turnover ? 0.0107** (0.037) Controls Controls MVE 0.0069*** (0.000) % MVE % 0.0191*** (0.000) 0.0161*** (0.000) BM -0.0156*** (0.000) - BM -0.0181*** (0.000) 0.0025 (0.244) DISTRESS -0.2529*** (0.000) - DISTRESS --0.3392*** (0.000) -0.2159*** (0.000) CFFO -0.5866*** (0.000) - CFFO --0.4644*** (0.000) -0.3883*** (0.000) GROWTH 0.0116*** (0.000) % GROWTH % 0.0214*** (0.000) 0.0215*** (0.000) FINANCE 0.0064 *** (0.000) % FINANCE % 0.0021 (0.140) 0.0018 (0.238) ACQ -0.0007(0.703) - ACQ - -0.0013(0.466) (0.966)0.0001