Full Terms & Conditions of access and use can be found at
https://www.tandfonline.com/action/journalInformation?journalCode=rcit20
Current Issues in Tourism
ISSN: (Print) (Online) Journal homepage: https://www.tandfonline.com/loi/rcit20
The (Un)sticky role of exchange and inflation rate
in tourism development: insight from the low and
high political risk destinations
Seyed Alireza Athari , Uju Violet Alola , Matina Ghasemi & Adewale Andrew
Alola
To cite this article: Seyed Alireza Athari , Uju Violet Alola , Matina Ghasemi & Adewale
Andrew Alola (2020): The (Un)sticky role of exchange and inflation rate in tourism development: insight from the low and high political risk destinations, Current Issues in Tourism, DOI:
10.1080/13683500.2020.1798893
To link to this article: https://doi.org/10.1080/13683500.2020.1798893
Published online: 28 Jul 2020.
Submit your article to this journal
Article views: 39
View related articles
The (Un)sticky role of exchange and in
flation rate in tourism
development: insight from the low and high political risk
destinations
Seyed Alireza Athari a, Uju Violet Alolab,c, Matina Ghasemidand Adewale Andrew Alolae,f,g
a
Faculty of Business, Department of Banking and Finance, Girne American University, Kyrenia, Turkey;bFaculty of Economics, Administrative and Social Science, Department of Tourism Guidance, Istanbul Gelisim University, Istanbul, Turkey;cDepartment of Economics and Management, South Ural State University, Chelyabinsk, Russia;
d
Faculty of Business and Economics, Department of Business, Girne Amercian University, Kyrenia, Turkey;eFaculty of Economics, Administrative and Social Science, Department of Economics and Finance, Istanbul Gelisim University, Istanbul, Turkey;fDepartment of Financial Technologies, South Ural State University, Chelyabinsk, Russia;gAviola consult, Nigeria
ABSTRACT
Although the tourism industry has continued to exert a significant impact on economies of most destinations, the impacts of political (in) security, socioeconomic and financial dynamics in the destination countries are equally playing decisive roles. Mirroring from this perspective, this study examined the role of political risk, exchange rate and inflation rate on the inbound international tourists in the panel of 76 destinations over the period 1995–2017. By employing the Pooled OLS (Ordinary Least Square) and the Generalized Moment of Methods (GMM), the estimation results suggest that the political risk is a significant impediment to the growth of total tourism arrivals in the panel countries. In addition, high exchange and inflation rates, respectively, impact international tourism arrivals (ITAs) in a positive and negative pattern. Moreover, thefindings show that the impact of political risk on ITAs is significant, and has a positive and negative effect in the low- and high-risk destinations, respectively. While the study urges for a formidable drive towards sustainable conflict resolution in destination countries, it further presents recommendations for preventing potential spillover effects in the event of the political, economic orfinancial crisis.
ARTICLE HISTORY Received 20 December 2019 Accepted 11 July 2020 KEYWORDS
Political risk; exchange rate; inflation rate; low-risk destinations; high-risk destinations
1. Introduction
Tourism is growing drastically amidst terrorism, political instability, economic problems and high inflation in diverse countries. The massive inflow of tourists to different countries is increasing on a daily basis and tourism activities contribute to economic output. For instance, in 2016, according to the report of Travel and Tourism Economic Impact (WTTC,2017), 300 million jobs were created, thus yielding an increased income to the tune of 7 trillion US dollars. Additionally, the World Travel and Tourism Council (WTTC,2019) noted that the tourism sector created 319 million jobs in 2018 and contributing about 10.4% to the global GDP.
Several recent literature have highlighted the relevance of tourism inflow to an economy (Akadiri et al.,2019; Alola & Alola,2018; Alola, Alola, et al.,2019a; Alola, Cop, et al.,2019b; Kim et al.,2018). The prediction of tourist arrival for 2019 (UNWTO2018) saw the limelight as international tourist arrivals grew by 4% in thefirst half of 2019. The growth in the tourism industry was evident in most of the
© 2020 Informa UK Limited, trading as Taylor & Francis Group CONTACT Adewale Andrew Alola [email protected] https://doi.org/10.1080/13683500.2020.1798893
countries across the globe. For instance, the Middle East witnessed the highest tourist arrival of 8% plus, followed by Asia and the Pacific which grew by +6% and 4% growth rate for the European region, respectively, Africa’s growth rate is reported as +3% and a 2% plus growth in the Americas. Given the sub-regions’ verdict, the Caribbean witnessed the highest growth of 11% plus, the North Africa by +9%, while +7% growth was seen in North-East Asia. Thus, giving credence to the previous forecast by the UNWTO concerning tourism arrival, the growth is undoubtedly positive.
Notwithstanding the fascinating development, the tourism industry has not been without unde-sirably dynamic economic indicators, such as trade, technological tension and other socioeconomic factors, across the world. For instance, the political instability witnessed in some part of the globe, the recent America–China trade dispute, the prolonged Brexit debacle are few of the global events that have the potential to signal a shock in tourist inflow. Although growth has been driven by cheap flights, easy visa facilitation, increased air connectivity, strong economy, the political unrest in most countries across the globe and tourism and political issues are becoming important impedi-ments to tourism growth (Ghalia et al.,2019). Political instability, according to notable researchers, has a huge impact on tourism (Perles-Ribes et al., 2019). The tremendous overdependency on safety and political stability has hindered the success of tourism in certain areas amidst terrorist attract that is becoming prevalent in the globe.
Recent scholars have unanimously added valuable contribution to the existing related literature for instance Perles-Ribes et al. (2019), for the case of Spain, Kebede (2018) for the case of Ethiopia, Lanouar and Goaied (2019), for the case of Tunisia. Expectedly, these politically unstable countries are reportedly experiencing decline in tourism arrival. The rate of tourism activities and the number of tourist visitations increase significantly in countries with lower levels of political risk. Tourism provides employment and increases the nation’s GDP (Faber & Cecile, 2019). Moreover, some other factors, such as the inflation, fluctuation in exchange rate and real exchange rate, are also perceived to affect tourism (Ongan & Gozgor,2018; Wu & Wu,2019).
Considering the aforementioned motivations, the current study attempts to investigate the role of political risk vis-à-vis political instability or political uncertainty, the real exchange rate, the Gross Domestic Product and inflation on the inbound of international tourists. By employing the dataset of 76 countries across the regions of the world (see the list of the countries in AppendixA1), an exper-imental period of 1995–2017 is employed by using both the Pooled OLS (ordinary least square) and the Generalized Moment of Methods (GMM) quantitative approaches. Hence, in addition to the specified objectives of the study, the novelty of the current study is found to be laudable in different ways.
. This study employs two approaches (the Pooled OLS and GMM) in a novel framework; thus, this presents both complimentary and robust dimensions to the conceptual estimation.
. This study also uses the comprehensive Political Risk Index scores, which include the components1 of government stability, socioeconomic conditions, socioeconomic conditions, internal conflict, external conflict, corruption, military in politics, religious tensions, law and order, ethnic tensions, democratic accountability and bureaucracy quality.
. In addition to studying a wider spectrum of countries from all the regions globally, the current study further categorizes and examines the countries when separately grouped as low and high political risk countries in a novel approach.
Then, rest of the study is arranged in the following folds. The next fold presents the literature review under sub-sections of the potential determinants of international tourism arrivals. The second fold which is the third section presents both the data description and methodology, while the fourth section describes the result of the investigation. In the last section of this study, the con-clusion, policy implication and the direction for future study are presented.
2. Literature review: tourism determinants
Tourism demand forecasting plays an important role in tourism industry (Law et al., 2019). To measure and identify tourism demand, based on the suggestions made by Santos and Cincera (2018), arrivals and departures of tourists and the duration of their stay are as crucial as their expen-diture and income. In addition, travel export and import andfinally the number of nights they spend in tourist accommodations are all important determinants of tourism development. Indeed, globali-zation and the real income of countries regarding the tourism sector are in line with the determinants of environmental sustainability (Saint Akadiri et al.,2019a). As an industry, tourism substantially in flu-ences development and economy. In 2016 alone, it raised more than US$ 7 trillion globally and created around 300 million jobs (or: in 2016 alone, tourism accounted for just above 10% of global Gross domestic products as well as a tenth of all jobs on the planet) (Travel and Tourism Econ-omic Impact,2017). Due to its significance in economy and higher reliance on its returns, a detailed understanding of its influential dynamics is of paramount. Extensive literature already exists, focusing on the economic determinants of tourism development (e.g. cost, national income and price) (Crouch,1994; Gray,1970; Kim et al.,2018; Kim & Song,2001), as well as other non-economic deter-minants of inbound tourism (e.g. travel risk, heritage, infrastructure and technology) (Fischhoff et al.,
2004; Su & Lin,2014; Zhang & Jensen,2007).
2.1. The impact of political stability
With current political unrest around the world, the interactions between tourism and political situ-ations along with terrorism become increasingly important2 (Ghalia et al., 2019). Based on the findings illustrated by Saha, S., & Yap, G. in 2014, political instability has a far greater effect on tourism than unprecedented isolated incidents of terrorist attacks. Expectedly, these attacks in pol-itically stable countries can actually hamper tourism development, because tourist inflow is expected to suffer significant setback in countries with higher levels of instability. More so, the combination of political uncertainty, terrorism activities and other unpleasant situations resulting from riots, wars and social unrest is endangering the tourism industry, thus causing negative impacts on tourism development.
In some circumstances, one of the greatest hindrances to the expansion of tourism is military coups. During such time, the government is mainly focused on managing the violence to avoid infer-ence with the economic activities. Therefore, long-term plans are suspended, especially those intended for the development of the tourism industry. This perception of military-economic interfer-ence is supported by a study performed in the case of Fiji by Fletcher and Morakabati (2008). The study opined that after the coup in Fiji in 2000, the country suffered a total decrease of 35% in tourism receipts and hotel occupancy rate fell by 15–20%. It took Fiji more than 3 years to rise back to the pre-coup extent of sectoral development (Fletcher & Morakabati,2008). Furthermore, Cothran and Cothran (1998) opined that countries with the potential to depend on tourism industry should endeavour to establish stable governmental policies with comprehensive institutions. The study observed that this approach is important in order to expand their tourism inflow. The study further opined that political risk, in turn, could be reduced by improved diplomatic relationships, safety and security within and outside a nation’s territory. Hence, political stability plays an important role in tourism development; it potentially influences trade and culture, infrastructure development, job availability, revenue generation and importantly affects the integration of the people.
Similarly, the effect of political dynamics on tourist inflow was established in the study of Eilat and Einav (2004). The study informed that a country’s political risk has a pivotal role in the country’s tourist attraction. In addition, the political dynamics of a country is believed to affect the supply side of the tourism industry, so also are political risk and maladministration (Hyndman,2015; Saha & Yap,2014). Importantly, the period of political tension expectedly causes many service providers to go out of business. In the absence of peace and security, due to the involvement of military forces in politics,
it is also expected to deter tourism growth (Hyndman,2015; Khalid, et al.,2019; Saha & Yap,2014). The activities within the tourism sector and the number of tourists especially increase significantly in countries with lower levels of political risk. Factors like GDP per capita, population, distance to tourism destination, existence of common border and language are critical in this respect. Revenues from tourism constitute a significant portion of national GDP and vice versa. Since economic expan-sion could promote tourism development, developing countries could expectedly advance their tourism industry development through economic expansion by employing policies that reduce pol-itical risk and improve institutional quality (Faber & Cecile,2019).
2.2. The impact of exchange rate
The efficacy of the economic policy uncertainty on tourism demand was examined in a study con-ducted by Işık et al. (2019). The study stated that tourism demand is affected more by economic uncertainties related to political issues than by any other well-established economic or non-economic factors. By using the case of the United States, the study demonstrated the impact of the economic policy uncertainty (EPU) index on tourism demand between January 1996 and September 2017. The study examined the international tourist arrivals (a measure of tourism demand) from Mexico and Canada and proved that EPU is a significant predictor. With higher values of the EPU index tourism demand to the United States decreased, especially for the Canadian tourists (The vacation time spent by the Canadians in the United States was significantly lower than that of the Mexicans during times with higher EPU indices).
A study was carried out to evaluate a rarely studied bilateral relation (a rare study) between Turkey and Spain (since both countries are trade partners) by using the non-linear ARDL co-integration approach (Işik et al.,2019). The study opined that the trade balance in Spain seems to be positively influenced by tourism, since Spain has the highest rate of tourist arrivals in the world. Moreover, Işik et al. (2019) maintained that the depreciation of the Euro (currency) increases tourist arrivals from Turkey considering the short-term and long-term evaluation of the exchange rate impact on trade balance in tourism with Turkey. On the other hand, the appreciation of the Euro does not affect Spain’s tourism balance significantly. Another study of Dogru et al. (2019), by using the linear and non-linear autoregressive distributed lag (ARDL) co-integration techniques, shows the effects of exchange rate depreciations and appreciations have an impact on the tourism trade balance, especially in regard to the bilateral relations between United States (U.S.), Canada, Mexico and the United Kingdom (U.K.). The study showed that the devaluation of the U.S. dollar improves the U.S. trade balance with all the three trading partners. Contrarily, even though the appreciation of the U.S. dollar has a negative effect on the U.S. bilateral tourism trade balance with Canada and the U.K., it does not affect its relationship with Mexico in the long term, which provides evidence against the J-curve theory, thus supporting the ML condition.
The buoyancy of tourism activity and its relationship with exchange ratefluctuations are perceived to impact the attraction of tourists to a destination. According to the series of surveys carried out in ten European countries (Denmark, Norway, Sweden, Switzerland, Czech Rep., Russian federation, Croatia, Hungary, Poland and Romania), Irandoust (2019) implied that exchange rate plays an impor-tant role in tourism development. Evidently, tourism is the one service that is directly influenced by the exchange rate in two distinct ways (Akar,2012; Dincer et al.,2015; Webber,2001). Firstly, the study implies that the exchange rate influences the number of tourists. Secondly, the exchange rate influ-ences the amount of money they will eventually spend. As a rule, tourists tend to travel to desti-nations where the exchange rate is in their favour (Wang et al.,2008). Xue et al. (2018) examined the relation between the exchange rate and the number of tourists in China. As a time-varying caus-ality, the expansion of the currency’s trading band is the most concerning variable to the tourists. However, the devaluation of a currency can eventually entice travellers to choose one country over others and spend more time and money in such a destination (Crouch,1993).
The investigations of the effects of real exchange rates and income on inbound tourist arrivals from 7 European countries (Germany, France, the UK, the Netherlands, Italy, Spain and Sweden) to the USA between 1996Q3 and 2015Q1 show higher sensitivity of tourists visiting the USA to real exchange rate changes than GDP changes (Ongan et al.,2017). Tourists from France react strongly to the GDP, while the real exchange rate is more important for the tourists from the UK, a country outside the Eurozone that intends to leave the European Union. This paper uses panel co-integration analysis under a cross-sectional dependence (CD) test and common correlated effects (CCE) approach. The study has reportedly claimed to have used the Harmonized Index of Consumer Prices (HICP) for Restaurants and Hotels– instead of general Consumer Price Index (CPI) – for the first time in order to transform the nominal exchange rate to the real exchange rate as an indepen-dent variable in models to analyze tourism demand. Therefore, the application of this index is the chief contribution of the study to the related literature, in addition to the revealing results of exchange rate-income-tourism relationship.
2.3. The impact of otherfinancial indicators
Additionally, the volatility of exchange rate, inflation and oil prices are observed to affect tourism per-formance (Meo et al.,2018). The rapid growth of tourism in the last 50 years is an evident that the sector is one of the most dominant sectors of economy. Because tourism creates jobs, it reduces poverty, minimizes inflation and finally contributes significantly to the world GDP. Even though ter-rorist attacks have risen during the last decades, tourism still shows considerable growth. In order to thrive economically, government often develops its own county’s tourism infrastructure in line with global practices, thus meeting the expectation of the prospective tourists. Hence, developing the tourism industry of a destination is important because the accumulated foreign funds expectedly yield higher living standards (Balcilar et al.,2014; Tang & Abosedra,2014).
Financial crisis has the propensity to disseminate throughout all sectors, albeit with unique impacts on respective areas (Andersson & Karpestam,2014). In recent times, some studies have focused on the effects of financial crisis on tourism, as one of the sectors of economy. Some of the earliest studies assessed the effects of Asian Financial Crisis (AFC) on Asia Pacific countries, such as Malaysia and Thai-land, through qualitative analysis of the secondary data. Specifically, for the case of Thailand, Konto-georgopoulos (1999) had examined the interactions between sustainable development and sustainable tourism in the face of the AFC, which revealed that Thailand had to prioritize rapid growth in tourism over its previous policy (long-term ecological sustainability of tourism) in order to draw in the much-needed foreign currency and foreign direct investment through tourism.
Furthermore, a study by Prideaux (1999) showed that the effects of the financial crises (which are akin to political unrest) were not as devastating as predicted in East Asia, which proved tourism (to be) more robust than presumed. In addition, De Sausmarez (2004) investigated the AFC and its effects on Malaysian tourism and the crisis management capabilities of the country. According to the author, Malaysia’s international marketing campaigns and policies towards promoting local tourism were most effective in response to the AFC. The study further showed that the country’s international market campaigns surged, thus prompting arrivals from new markets. Furthermore, Anderson (2006) studied Australian tourism industry in respect to the AFC and the Bali terrorist attack. The study proved that the Australian tourism industry was incompetent to manage such crises (and learned little from these events). On the other hand, in Mexico, the swineflu pandemic, exchange rate fluctuations and the weather conditions seem to be more relevant in causing the economic crises.
2.3. The impact of macroeconomic factors
According to Tang and Tan (2013), tourism comprises a great portion of tax returns, exports and employment, thus making the sector to significantly contribute to the global trade. Reports from
the UNWTO (2005) indicate that tourism is the leading factor in socioeconomic development. The UNWTO also reported that the revenues from the industry exceeded a trillion United States dollars, which accounted for 5% of the investments and exports worldwide, thus generating about 10% of the GDP and creating more than 200 million jobs globally. The estimations of the World Travel & Tourism Council (WTTC,2013) were also similar. Several research studies point to a multitude of potentials for tourism, such as raising foreign funds, endorsement of enterprises and increasing wages, as well as diminishing job loss and raising tax return to balance out government expendi-ture/spending. Thus, governments invest in infrastructure, such as roads and hotels, as a ploy to attract tourists into the country, and the related policies are directed at the private sector to be more involved in promoting the tourism industry (Jalil et al.,2013).
Additionally, tourism has a trivial role in all economic areas and the industry remains insignificant as far as poverty reduction in certain locations (poverty being one of the most severe global pro-blems). This is because macroeconomic effects of economic and financial crises are often catastrophic and persistent, usually triggering higher unemployment rates and lower GDP growth (Khalid et al.,
2019; Reinhart & Rogoff, 2009, 2011). Because of the role of tourism in economic development, the swift advancement in the industry would affect not only through the private domestic and public incomes directly, but also through indirect pathways (Polat & Günay,2012). Policies regarding tourism were the centre of attention since the 1980s. In 1982, a bill on tax incentives for tourism sector was introduced, which supported thefield greatly, thus leading to significant advances in the industry.
2.4. Other determinants of tourism performance
The turning point that underpins tourism performance is the simple fact that tourists promote foreign currency in the destination country, thus providing the much-needed resource, especially for devel-oping countries. As opposed to other industries, tourism is the only trade item with great contri-butions to the economy without significant adverse effects of industrialization, destructive impact on the ecosystem or depleting natural resources. Therefore, it is quite understandable that the pol-icies in developing countries would be favourable for a higher inflow of tourists.
Furthermore, sustainable development and economic expansion are observed to have facili-tated the international tourism trades, especially as the largest service industry in international trade, (according to the world tourism organization). According to the World Tourism Economic Trends Report (2017), the global tourist inflow has surpassed the earth’s population by 1.4 times (almost 5% growth over the previous year) in 2016. The report further indicates that global tourist inflow is expected to reach 1.8 billion by 2030. In 2016, revenues of global tourism are made up 7% of global gross domestic product (GDP), which is more than 3% increase during the course of a year. This shows a significantly higher growth rate for tourism than the global GDP growth rate. As clearly stated by the aforementioned data (Chiu & Yeh,2017), tourism is the source of growth and development through export returns, new jobs and enterprises, development of the infra-structure and subsequently advancing the socio-economic situation (Paramati et al., 2017b). Unequivocally, governments and experts are increasingly interested in tourism and its economic repercussions in recent years (De Vita & Kyaw, 2013; Falk,2015; Tang et al.,2016; Tang & Tan,
2016).
Moreover, in understanding sustainable tourism, examining the correlation between economic development, tourism and the quality of environmental standards is methodologically vital. The United Nations nominated the year 2017 as the International Year of Sustainable Tourism. This pre-sents the industry with a valuable opportunity to prepare for the future (according to sustainable development goals) (WTTC,2016). Being the biggest industry in the world according to the World Tourism Organization, tourism remained the key factor in any country’s economy (According). Tourism sector has advanced enormously during the past decades and has managed to be one of the largest industries, with great potential, in both developing and developed countries (Paramati
et al.,2017a). Generally, it is evidently observed that activities in the tourism industry are significantly perceived to be a fundamental part of economic growth (Brida & Risso,2009; Tang & Tan,2013).
3. Data description and methodology 3.1. Data description
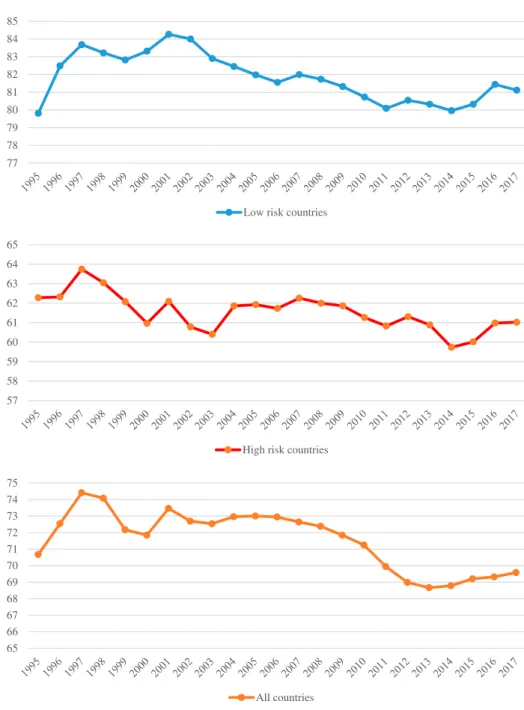
The current study considers a dataset that includes the international tourism arrivals, political risk index (this variable proxy for political instability or uncertainty), the real exchange rate, the Gross Domestic Product (GDP) and the inflation rate for 76 countries. It’s worthy to note that our sample size initially includes 128 countries over the period 1985–2018. However, 52 countries were removed from our sample size and the study’s period was limited to 1995–2017 due to mismatching the countries from different data sources and data unviability. Appendix A shows the list of the sampled countries. Except for the political risk score, all the data were retrieved from the World Bank Development Indicator (WDI,2019) of the World Bank for the period 1995–2017. Thus, following the study by Athari (2020), the political risk index score3data were retrieved from thewww.prsgroup. comfor all the countries. As presented inTable 1, the description of the explored variables provides additional information on the measurement of the data and their respective sources and likewise is the respective visual representation, as shown inFigure 1. Additionally, the descriptive statistics of the experimented data are displayed inTable 2.
3.2. Methodology
Certain econometric problems are being identified when investigating and modelling of panel data. In extant studies, the problems of heteroscedasticity and endogeneity of the explanatory vari-ables are few of the associated sources of setbacks (Ganda,2019; Usman et al.,2019). In order to prevail over the aforementioned concern, the current study jointly employs the difference estima-tor and an estimaestima-tor in the level to derive a two-step system (GMM estimaestima-tor) that is appropriate for the investigation (Arellano & Bover, 1995; Blundell & Bond, 1998). In the current case, the dynamic panel regression estimator permits the use of the lagged endogenous variable as an inde-pendent variable to prevent the likelihood of endogeneity. Moreover, the system GMM is believed to yield a robust estimate especially given that the number of countries (N, which is the cross-section) is more than the number of time (T which is the experimental period) dimension of the series.
By employing a similar theoretical framework that models international tourism inbound in the extant literature (Javid & Katircioglu,2017; Alola et al.,2019a; Saint Akadiri et al.,2019b), the
two-Table 1.Variables’ definition and sources.
Variables Definition Source
Number of tourism arrivals
International tourism, number of arrivals World Bank
Political risk score Political risk is an index containing the government stability, socioeconomic conditions, investment profile, internal conflict, external conflict, corruption, military in politics, religious tensions, law and order, ethnic tensions, democratic accountability, bureaucracy quality. Overall, a political risk rating of 0.0% to 49.9% indicates a very high risk; 50.0% to 59.9% high risk; 60.0% to 69.9% moderate risk; 70.0% to 79.9% low risk and 80.0% or more very low risk. The score range is from 0 to 100.
www.prsgroup. com
Real exchange rate Real effective exchange rate index (2010 = 100) World Bank
GDP GDP per capita growth (annual %) World Bank
Inflation Inflation, consumer prices (annual %) World Bank
Notes:Table 1describes all using variables. Thefirst and second columns show the names and definitions of the variables that are used in the econometric model. The third column refers to the data source of each variable.
77 78 79 80 81 82 83 84 85
Low risk countries
57 58 59 60 61 62 63 64 65
High risk countries
65 66 67 68 69 70 71 72 73 74 75 All countries
Figure 1.Time series plot of political risk scores for the low-risk, high-risk and all examined countries.
Table 2.Descriptive statistics (1995–2017).
Variables Mean Median Minimum Maximum St.dev.
Number of tourism arrivals 9,254,347.462 3,450,500 7500 86,861,000 14,747,254.681
Political risk score 71.549 71.875 28.500 96.083 12.189
Real exchange rate 100.411 99.236 42.900 740.601 25.867
GDP 2.207 2.147 −22.312 23.940 3.586
Inflation 6.397 3.107 −30.856 376.746 15.846
step dynamic SYS-GMM estimator represented in the following forms:
lnTourism Arrivalst=a0+ a1lnTourism Arrivalsit-1+ a2Political Riskit
+a3Exchange Rateit+ a4GDPit+ a5Infltionit+1it1
(1) Exchange Ratet=b0+ b1Exchange Rateit-1+ b2lnTourism Arrivalit
+b3Political Riskit+ b4lnGDPit+ b5Infltionit+1it1
(2) GDPt=c0+ c1GDPit-1+ c2Political Riskit+ c3Exchange Rateit
+c4lnTourism Arrivalsit+ c5Infltionit+1it2
(3) Inflationt=d0+ a1Inflationit-1+ d2Political Riskit
+d3Exchange Rateit+ d4GDPit+ d5lnTourism Arrivalsit+1it3
(4) where only Tourism Arrival variables are expressed in natural logarithms and other variables are employed directly because they are either categorical or index. The coefficients a0, b0, c0 and d0
are the constants that measure the corresponding impacts of the independent variables. The sub-script‘i’ represents the ith series (i = 1, … , 76) and `t′is the time period (t = 1995,… , 2017). Addition-ally, theεit1, εit2andεit3represent the stochastic terms that are assumed to be characterized by a
white noise process.
In the current study, the above-stated GMM procedure isfirst carried out for the panel of the entire 76 countries to present a global perspective and the result is depicted inTable 4. Similarly, the exper-imental procedure is repeated for the panels of low-risk countries and high-risk countries with the results presented in Table 5. In both cases, and as indicated in the corresponding tables, the impact of the investigated factors is obviously implied.
4. Result and discussion 4.1. Descriptive statistics
The prevailing evidence from the minimum, maximum and the standard deviation values of the dataset presented in Table 2 reveals the volatility characteristics of real exchanges rates, the inflation and the political risk and tourism arrivals in the panel countries. As seen in Table 2, tourism arrivals have the highest deviation, followed by the real exchange rate variability, the inflation and the political risk. However, the variability in the panel country is observed to be lowest in terms of the GDP.
The aforementioned variable description compliments the visual representation (seeFigure 1) of the degree of political risk patterns and especially the categorization of the countries as low and high political risks.
Moreover, before conducting estimations, the unit root tests are performed to check the stationar-ity of investigated variables. This study uses the panel unit root tests suggested by Levin–Lin–Chu (2002) and Im et al. (2003) for each variable by considering both trend and cross-sectional depen-dence options. The results are shown inTable 3 and indicate that the investigated variables are stationary at level I (0) for both options (trend and cross-sectional dependence options).
4.2. Regression analysis
Importantly, impacts of political risk, real exchange rate, inflation and the GDP on tourism arrivals in the panel country are indicated inTable 4. The results for both the Generalized Method of Moments (SYS-GMM) and the Pooled Ordinary Least Squares (OLS) both posit similar inference. Indicatively, the SYS-GMM and the Pooled OLS results inTable 4imply that political risk, the GDP and inflation exerts’ positive impact on tourism arrivals in the panel country. Specifically, political risk, which represents a
Table 3.Unit root test results.
Variables Panel (A): Levin–Lin–Chu (2002) Panel (B): Im et al. (2003)
With trend With cross-sectional dependence With trend With cross-sectional dependence
Tourism arrival −5.069* −3.496* −5.023* −3.018*
Political risk −8.089* −8.234* −7.981* −5.288*
Real exchange rate −9.346* −8.475* −15.462* −13.062*
GDP −10.499* −9.239* −14.996* −12.794*
Inflation −10.388* −11.124* −15.752* −13.160*
Notes:Table 4shows the panel unit root test results of investigated variables. The null hypothesis of Levin–Lin–Chu (LLC) and Im– Pesaran–Shin (IPS) unit root test is panels contain unit roots. The symbols * indicate statistical significance at the 1%, 5% and 10% levels, respectively.
Table 4.The global effect of political risk on tourism arrivals (1995–2017).
Pooled (OLS) SYS-GMM
Independent variables Coefficient Z Prob. Coefficient Z Prob.
Lagged of tourism arrivals 0.876* 4.37 0.000 0.887* 4.29 0.000
Political risk score 0.884* 4.56 0.000 0.663* 3.38 0.000
Real exchange rate −0.028 −0.45 0.653 −0.374** −3.39 0.028
GDP 0.013* 3.06 0.002 0.014* 4.13 0.005 Inflation 0.002 0.56 0.578 0.004** 2.11 0.043 Constant −1.050* −3.29 0.001 −2.694* −4.28 0.000 R-square 0.68 — — — — — Hansen-test — — — (0.732) — — M2-test — — — (0.590) — — No. of obs. 1672 — — 1672 — —
Notes:Table 4shows the global effect of political risk on tourism arrivals over the period of 1995–2017 using the pooled and dynamic (SYS-GMM) regressions. Descriptions of the variables are shown inTable 1. The Hansen and M2tests are conducted
to check the validity of instruments and serial correlations. Standard errors are asymptotically robust to heteroscedasticity. For the regression diagnostic tests, only p-values in parentheses are reported. The symbols * and ** indicate statistical signi fi-cance at the 1%, 5% and 10% levels, respectively.
Table 5.The dynamic effect of political risk on tourism arrivals under different country risk levels (1995–2017). Panel A: Low Risk Countries
Independent variables Coefficient Z Prob.
Lagged of tourism arrivals 0.972* 3.82 0.000
Political risk score −0.182** −2.16 0.031
Real exchange rate 0.077 1.28 0.628
GDP 1.441* 3.62 0.000 Inflation −0.097* −2.91 0.004 Constant 1.670 0.25 0.801 Hansen-test (0.475) — — M2-test (0.337) — — No. of obs. 785 — —
Panel B: High Risk Countries
Lagged of tourism arrivals 3.75 0.000
Political risk score 0.255* 4.45 0.000
Real exchange rate −0.013 −0.34 0.735
GDP 0.018* 2.10 0.002 Inflation 0.008** 2.03 0.036 Constant −1.029* −4.80 0.000 Hansen-test (0.452) — — M2-test (0.345) — — No. of obs. 806 — —
Notes:Table 5shows the effect of political risk on tourism arrivals under different country risk levels namely low- and high-risk countries over the period of 1995–2017 using the dynamic (SYS-GMM) regressions. Descriptions of the variables are shown in
Table 1. The Hansen and M2tests are conducted to check the validity of instruments and serial correlations. Standard errors
are asymptotically robust to heteroscedasticity. For the regression diagnostic tests, only p-values in parentheses are reported. The symbols * and ** indicate statistical significance at the 1% and 5% levels.
level of uncertainty, suggests that a high score of political risk (which implies low political risk due to high government stability or absence of military coup) is essentially responsible for higher tourism arrival inflow. In the same way, the low political risk score that indicates the high level of instability in the panel country is responsible for low tourism arrivals in the panel countries. This observation in the current study regarding the negative impact of political instability on tourism arrivals is signi fi-cantly similar to that of the extant studies (Alola, Cop, et al.,2019b; Fletcher & Morakabati,2008; Ghalia et al.,2019; Kebede,2018; Lanouar & Goaied,2019).
Similarly, the SYS-GMM result for the real exchange rate and tourism arrival inflows relationship in the current study is within the expected theoretical notion. That is to say that the low exchange rate of the domestic panel of estimated countries is a trigger for the higher tourism inflow. Practically, pro-spective tourists will be more excited to travel to a destination where a small amount of the country of origin will change for more amount or purchase more good and services in the destination country. Interestingly, the studies of Webber (2001) and that of Wang et al. (2008) are among the few extant studies that indicate that exchange rate is a significant determinant of tourism arrival. Additionally, the study of Meo et al. (2018) affirms the significant impact of both the exchange rate and inflation on tourism arrival inflows especially in Pakistan.
Furthermore, the result of the current study from the indicated SYS-GMM suggests that economic growth vis-à-vis the GDP is a significant determinant of tourism development vis-à-vis the tourism arrival inflows in the panel of the estimated countries. The implication of the result is that economic growth in the panel country is a catalyst for tourism development, thus the economic growth-led hypothesis is valid for the estimated panel. Although previous studies have jointly argued for and against the tourism-led growth hypothesis (Akadiri et al., 2019; Brida & Risso, 2009; Chiu & Yeh,
2017; Faber & Cecile,2019), the current study supports the economic growth-led hypothesis from the global perspective (Khalid et al., 2019; Ongan & Gozgor,2018; Wu & Wu,2019). Interestingly, the lag value of tourism arrival is seen as a significant determinant of tourism arrival in the two esti-mation techniques. This implies that the values of tourism arrivals in the previous years are a good predictor of tourism arrival inflow in the succeeding year, thus good information about previous tourism arrival performance is a green light for tourist arrival inflow.
4.3. Perspectives from the low and high political risk destinations
Table 5 presents the dynamic effect of political risk on tourism arrivals from the perspectives of different political risk levels. As shown in Table 1, a country with higher political risk score has more political stability and vice versa (source, PRS). Therefore, to classify countries into the low and high political risk levels, we assume that the countries that are above the overall median political risk score as the low-risk and the countries that are below the overall median political risk score as high-risk. Considering that ‘LOW’ political risk ‘HIGH’ risk score, we employed the inverse values and apply reverse interpretation. Hence, Panel A inTable 5presents the estimation results for the low political risk countries. In this case, the result expectedly presented an increase in the inter-national tourist arrivals to the panel of low political risk countries. Although the impact of real exchange rate is not significant as observed in the result, the GDP and inflation are shown to have a significant evidence of positive and negative effects on the inflow of tourists to the panel of desti-nation countries. Similarly, the previous information of tourism arrivals (the lag value of tourism arri-vals) is equally observed to possess the potential for attracting prospective tourists.
On the other hand, as shown in Panel B (see the lower part ofTable 5), the coefficient of political risk in the panel of high political risk countries is interpreted in reverse pattern as suggested above. In contrast to the result in Panel A, the results posited that there is a significant decline in the inflow of tourists to the destination of panel high political risk countries. Similar to the result of the low-risk countries, the impact of real exchange rate on tourism arrivals is positive but insignificant. However, the impacts of the GDP and inflation on tourism inflows in the panel of high political
risk destination countries are the same with the low political risk countries (i.e. positive and negative, respectively).
4.4. Diagnostics test
The supporting diagnostic test employed in validating the result of the above investigation posits a desirable implication. Interestingly, the Hansen and M2tests (seeTables 4and5) that were conducted
to check the validity of both the instrumental variables and serial correlations that validates the robustness of the aforementioned results. In addition, these diagnostic tests imply that the standard errors are asymptotically robust to heteroscedasticity.
5. Conclusion and policy implication
This study examined the global perspective of political risk, the gross domestic product (GDP), inflation and exchange rate on the tourism inbound in the panel of 76 (seeAppendixfor the list) des-tinations over the period of 1995–2017. This is the first comprehensive study which tested this nexus at the global level. Expectedly, the study found that the countries with a high level of political risk arising from political instability, such as military interference, are susceptible to decline in tourism inbound. This implies that in addition to being a tourism destination country, the level of (in) stability in the destination country is equally a significant determinant of tourism performance of such a country. As expected, the case of the low political risk countries suggests that the inflow of tourist is on the increase. In general, the study found that improvement in political stability would cause tourist inflows to increase in destinations. Furthermore, the study opined a more interesting inference from the panel of low and high political risk destinations. Specifically, the study revealed that the level of economic growth in the panel countries is a significant determinant of the performance of the tourism industries in the examined countries. Like the tourism-led growth hypothesis in the extant literature, the current study equally validates the GDP-tourism arrival relationship, thus the growth-led hypothesis for the tourism industries of the panel countries is valid.
Moreover, the results of the impact of inflation and real exchange rate for both the entire panel countries and that of the categories of low and high political risk countries equally suggest interesting inferences. In thefirst case (result from the entire panel of investigated countries), the study revealed a negative and significant impact of exchange rate on tourism arrivals, while inflation has a statisti-cally significant and negative effect on tourism arrivals with the opposite sign. For both the low pol-itical risk countries, the impact of the exchange rate on tourism arrivals is positive but not significant. It is also observed that a high inflation in the low and high political risk countries will cause the number of tourists visiting the destinations to decline.
5.1. Policy implication
Considering that the current study examines the global perspectives of the role of political risk, real exchange rate, the gross domestic product (GDP) and inflation in determining the performance of tourism industry, it expectedly presents valuable policy directives. Since this investigation covers 76 countries across world regions, the implied policies from the result for both the examined countries and stakeholders are in folds.
. Considering that there is a strong significant correlation between political risk and tourism arrivals, a more inclusive and stronger network and collaborations that strengthen peace and conflict res-olution should be further engineered across the globe.
. Regions or country-specific approaches such that addresses the peculiarity of the fundamental cause of instability should be identified and uniquely targeted with result-oriented mechanisms.
. The significant impact of both the exchange rate and inflation observed in the investigation further reiterate the need for stronger monetary andfiscal regulations among the countries of the world. Such policies are essential for the possible prevention of spillover effects especially during economic orfinancial turmoil in a country or another part of the world.
. For the non-tourism destinations, the current investigation further instructs that growth is essen-tial towards driving tourism development, thus such destinations could target more economic and sustainable development goals.
However, the current investigation further shows that future study could explore the income cat-egorization of the countries (such as the low-, middle- and upper-income countries) within the same conceptual framework. As an additional recommendation, more countries could be incorporated in future studies so as to further enhance the robustness of the investigation.
Notes
1. https://www.prsgroup.com/wp-content/uploads/2012/11/icrgmethodology.pdf
2. Several studies also show that political risk is matter and impact profitability of financial companies (e.g., Athari,
2020).
3. Further information on the measurement and properties of Political Index can be found fromwww.prsgroup.com
Disclosure statement
No potential conflict of interest was reported by the author(s).
ORCID
Seyed Alireza Athari http://orcid.org/0000-0003-4918-1597
References
Akadiri, S. S., Akadiri, A. C., & Alola, U. V. (2019). Is there growth impact of tourism? Evidence from selected small island states. Current Issues in Tourism, 22(12), 1480–1498.https://doi.org/10.1080/13683500.2017.1381947
Akar, C. (2012). Modelling Turkish tourism demand and the exchange rate: The bivariate GARCH approach. European Journal of Economics, Finance and Administrative Sciences, 50, 133–141.
Alola, A. A., & Alola, U. V. (2018). Agricultural land usage and tourism impact on renewable energy consumption among Coastline Mediterranean countries. Energy & Environment, 29(8), 1438–1454. https://doi.org/10.1177/ 0958305X18779577
Alola, U. V., Alola, A. A., Avci, T., & Ozturen, A. (2019a). Impact of corruption and insurgency on tourism performance: A case of a developing country. International Journal of Hospitality & Tourism Administration, 1–17.https://doi.org/10. 1080/15256480.2019.1650686
Alola, U. V., Cop, S., & Adewale Alola, A. (2019b). The spillover effects of tourism receipts, political risk, real exchange rate, and trade indicators in Turkey. International Journal of Tourism Research.https://doi.org/10.1002/jtr.2307
Anderson, B. A. (2006). Crisis management in the Australian tourism industry: Preparedness, personnel and postscript. Tourism Management, 27(6), 1290–1297.https://doi.org/10.1016/j.tourman.2005.06.007
Andersson, F. N., & Karpestam, P. (2014). Short and long term growth effects of financial crises. In M. Gallegati & W. Semmler (Eds.), Wavelet applications in economics andfinance (pp. 227–248). Springer.
Arellano, M., & Bover, O. (1995). Another look at the instrumental variable estimation of error-components models. Journal of Econometrics, 68(1), 29–51.
Athari, S. A. (2020). Domestic political risk, global economic policy uncertainty, and banks’ profitability: Evidence from Ukrainian banks. Post-Communist Economies, 1–26.https://doi.org/10.1080/14631377.2020.1745563
Balcilar, M., van Eyden, R., Inglesi-Lotz, R., & Gupta, R. (2014). Time-varying linkages between tourism receipts and econ-omic growth in South Africa. Applied Econecon-omics, 46(36), 4381–4398.https://doi.org/10.1080/00036846.2014.957445
Blundell, R., & Bond, S. (1998). Initial conditions and moment restrictions in dynamic panel data models. Journal of Econometrics, 87(1), 115–143.
Brida, J. G., & Risso, W. A. (2009). Tourism as a factor of long-run economic growth: An empirical analysis for Chile. European Journal of Tourism Research, 2, 178–185.
Chiu, Y. B., & Yeh, L. T. (2017). The threshold effects of the tourism-led growth hypothesis: Evidence from a cross-sectional model. Journal of Travel Research, 56(5), 625–637.https://doi.org/10.1177/0047287516650938
Cothran, D. A., & Cothran, C. C. (1998). Promise or political risk for Mexican tourism. Annals of Tourism Research, 25(2), 477– 497.https://doi.org/10.1016/S0160-7383(97)00100-X
Crouch, G. I. (1993). Currency exchange rate and the demand for international tourism. Journal of Tourism Studies, 4(2), 45–53.
Crouch, G. I. (1994). The study of international tourism demand: A review offindings. Journal of Travel Research, 33(1), 12– 23.https://doi.org/10.1177/004728759403300102
De Sausmarez, N. (2004). Malaysia’s response to the asian financial crisis: Implications for tourism and sectoral crisis man-agement. Journal of Travel & Tourism Marketing, 15(4), 217–231.https://doi.org/10.1300/J073v15n04_01
De Vita, G., & Kyaw, K. S. (2013). Role of the exchange rate in tourism demand. Annals of Tourism Research, 43, 624–627.
https://doi.org/10.1016/j.annals.2013.07.011
Dincer, M. Z., Dincer, F. I., & Ustaoglu, M. (2015). Reel effective exchange rate volatilities impact on tourism sector in Turkey: An empirical analysis of 2003–2014. Procedia Economics and Finance, 23, 1000–1008.https://doi.org/10. 1016/S2212-5671(15)00352-4
Dogru, T., Isik, C., & Sirakaya-Turk, E. (2019). The balance of trade and exchange rates: Theory and contemporary evidence from tourism. Tourism Management, 74, 12–23.https://doi.org/10.1016/j.tourman.2019.01.014
Eilat, Y., & Einav, L. (2004). Determinants of international tourism: A three-dimensional panel data analysis. Applied Economics, 36(12), 1315–1327.https://doi.org/10.1080/000368404000180897
Faber, B., & Cecile, G. (2019). Tourism and economic development: Evidence from Mexico’s coastline. American Economic Review, 109(6), 2245–2293.https://doi.org/10.1257/aer.20161434
Falk, M. (2015). The sensitivity of tourism demand to exchange rate changes: An application to Swiss overnight stays in Austrian mountain villages during the winter season. Current Issues in Tourism, 18(5), 465–476.https://doi.org/10.1080/ 13683500.2013.810610
Fischhoff, B., De Bruin, W. B., Perrin, W., & Downs, J. (2004). Travel risks in a time of terror: Judgments and choices. Risk Analysis, 24(5), 1301–1309.https://doi.org/10.1111/j.0272-4332.2004.00527.x
Fletcher, J., & Morakabati, Y. (2008). Tourism activity, terrorism and political instability within the commonwealth: The cases of Fiji and Kenya. International Journal of Tourism Research, 10(6), 537–556.https://doi.org/10.1002/jtr.699
Ganda, F. (2019). The environmental impacts of financial development in OECD countries: A panel GMM approach. Environmental Science and Pollution Research, 26(7), 6758–6772.https://doi.org/10.1007/s11356-019-04143-z
Ghalia, T., Fidrmuc, J., Samargandi, N., & Sohag, K. (2019). Institutional quality, political risk and tourism. Tourism Management Perspectives, 32, Article 100576.https://doi.org/10.1016/j.tmp.2019.100576
Gray, H. P. (1970). International travel-international trade. D.C. Heath.
Hyndman, J. (2015). The securitization of Sri Lankan tourism in the absence of peace. Stability: International Journal of Security and Development, 4(1),https://doi.org/10.5334/sta.fa
Im, K. S., Pesaran, M. H., & Shin, Y. (2003). Testing for unit roots in heterogeneous panels. Journal of Econometrics, 115(1), 53–74.https://doi.org/10.1016/S0304-4076(03)00092-7
Irandoust, M. (2019). On the relation between exchange rates and tourism demand: A nonlinear and asymmetric analysis. The Journal of Economic Asymmetries, 20, e00123.https://doi.org/10.1016/j.jeca.2019.e00123
Işik, C., Radulescu, M., & Fedajev, A. (2019). The effects of exchange rate depreciations and appreciations on the tourism trade balance: The case of Spain. Eastern Journal of European Studies, 10(1).
Işık, C., Sirakaya-Turk, E., & Ongan, S. (2019). Testing the efficacy of the economic policy uncertainty index on tourism demand in USMCA: Theory and evidence. Tourism Economics.https://doi.org/10.1177/1354816619888346
Jalil, A., Mahmood, T., & Idrees, M. (2013). Tourism–growth nexus in Pakistan: Evidence from ARDL bounds tests. Economic Modelling, 35, 185–191.https://doi.org/10.1016/j.econmod.2013.06.034
Javid, E., & Katircioglu, S. (2017). The globalization indicators-tourism development nexus: A dynamic panel-data analysis. Asia Pacific Journal of Tourism Research, 22(11), 1194–1205.https://doi.org/10.1080/10941665.2017.1378240
Kebede, N. S. (2018). The fate of tourism during and in the aftermath of political instability: Ethiopia tourism in focus. Journal of Tourism Hospitality, 7((01|1)), 337.https://doi.org/https://doi.org/10.4172/2167-0269.1000337
Khalid, U., Okafor, L. E., & Shafiullah, M. (2019). The effects of economic and financial crises on international tourist flows: A cross-country analysis. Journal of Travel Research.https://doi.org/10.1177/0047287519834360
Kim, Y. R., Saha, S., Vertinsky, I., & Park, C. (2018). The impact of national institutional quality on international tourism inflows: A cross-country evidence. Tourism Analysis, 23(4), 533–551. https://doi.org/10.3727/108354218X15391 984820503
Kim, S. H., & Song, W. K. (2001). An interpretation of the determinants of international tourismflow: Application of the Hechsher-Ohlin’s factor endowment theorem. Journal of Tourism Science, 23(3), 67–87.
Kontogeorgopoulos, N. (1999). Sustainable tourism or sustainable development? Financial crisis, ecotourism, and the ‘amazing Thailand’ Campaign. Current Issues in Tourism, 2(4), 316–332.https://doi.org/10.1080/13683509908667859
Lanouar, C., & Goaied, M. (2019). Tourism, terrorism and political violence in Tunisia: Evidence from Markov-switching models. Tourism Management, 70, 404–418.https://doi.org/10.1016/j.tourman.2018.09.002
Law, R., Li, G., Fong, D. K. C., & Han, X. (2019). Tourism demand forecasting: A deep learning approach. Annals of Tourism Research, 75, 410–423.https://doi.org/10.1016/j.annals.2019.01.014
Levin, A., Lin, C. F., & Chu, C. S. J. (2002). Unit root tests in panel data: asymptotic andfinite-sample properties. Journal of Econometrics, 108(1), 1–24.
Meo, M. S., Chowdhury, M. A. F., Shaikh, G. M., Ali, M., & Masood Sheikh, S. (2018). Asymmetric impact of oil prices, exchange rate, and inflation on tourism demand in Pakistan: New evidence from nonlinear ARDL. Asia Pacific Journal of Tourism Research, 23(4), 408–422.https://doi.org/10.1080/10941665.2018.1445652
Ongan, S., & Gozgor, G. (2018). Tourism demand analysis: The impact of the economic policy uncertainty on the arrival of Japanese tourists to the USA. International Journal of Tourism Research, 20(3), 308–316.https://doi.org/10.1002/jtr.2182
Ongan, S., Işik, C., & Özdemir, D. (2017). The effects of real exchange rates and income on international tourism demand for the USA from some European Union countries. Economies, 5(4), 51.https://doi.org/10.3390/economies5040051
Paramati, S. R., Alam, M. S., & Chen, C. F. (2017a). The effects of tourism on economic growth and CO2 emissions: A com-parison between developed and developing economies. Journal of Travel Research, 56(6), 712–724.https://doi.org/10. 1177/0047287516667848
Paramati, S. R., Shahbaz, M., & Alam, M. S. (2017b). Does tourism degrade environmental quality? A comparative study of Eastern and Western European Union. Transportation Research Part D: Transport and Environment, 50, 1–13.https://doi. org/10.1016/j.trd.2016.10.034
Perles-Ribes, J. F., Ramón-Rodríguez, A. B., Such-Devesa, M. J., & Moreno-Izquierdo, L. (2019). Effects of political instability in consolidated destinations: The case of Catalonia (Spain). Tourism Management, 70, 134–139.https://doi.org/10. 1016/j.tourman.2018.08.001
Polat, E., & Günay, S. (2012). The test of the effect of tourism and export receipts on the economic growth in turkey: Co-integration and causality analysis. Süleyman Demirel Üniversitesi Fen Bilimleri Enstitüsü Dergisi, 204–211.
Prideaux, B. (1999). Tourism perspectives of the asianfinancial crisis: Lessons for the future. Current Issues in Tourism, 2(4), 279–293.https://doi.org/10.1080/13683509908667856
Reinhart, C. M., & Rogoff, K. S. (2009). The aftermath offinancial crises. American Economic Review, 99(2), 466–472.https:// doi.org/10.1257/aer.99.2.466
Reinhart, C. M., & Rogoff, K. S. (2011). Fromfinancial crash to debt crisis. American Economic Review, 101(5), 1676–1706. Saha, S., & Yap, G. (2014). The moderation effects of political instability and terrorism on tourism development: A
cross-country panel analysis. Journal of Travel Research, 53(4), 509–521.https://doi.org/10.1177/0047287513496472
Saint Akadiri, S., Alola, A. A., & Akadiri, A. C. (2019a). The role of globalization, real income, tourism in environmental sus-tainability target. Evidence from Turkey. Science of the Total Environment, 687, 423–432.https://doi.org/10.1016/j. scitotenv.2019.06.139
Saint Akadiri, S., Eluwole, K. K., Akadiri, A. C., & Avci, T. (2019b). Does causality between geopolitical risk, tourism and econ-omic growth matter? Evidence from Turkey. Journal of Hospitality and Tourism Management.https://doi.org/10.1016/j. jhtm.2019.09.002
Santos, A., & Cincera, M. (2018). Tourism demand, low cost carriers and European institutions: The case of Brussels. Journal of Transport Geography, 73, 163–171.https://doi.org/10.1016/j.jtrangeo.2018.04.026
Su, Y.-W., & Lin, H.-L. (2014). Analysis of international tourist arrivals worldwide: The role of world heritage sites. Tourism Management, 40, 46–58.https://doi.org/10.1016/j.tourman.2013.04.005
Tang, C. F., & Abosedra, S. (2014). Small sample evidence on the tourism-led growth hypothesis in Lebanon. Current Issues in Tourism, 17(3), 234–246.https://doi.org/10.1080/13683500.2012.732044
Tang, J., Sriboonchitta, S., Ramos, V., & Wong, W. K. (2016). Modelling dependence between tourism demand and exchange rate using the copula-based GARCH model. Current Issues in Tourism, 19(9), 876–894.https://doi.org/10. 1080/13683500.2014.932336
Tang, C. F., & Tan, E. C. (2013). How stable is the tourism-led growth hypothesis in Malaysia? Evidence from disaggregated tourism markets. Tourism Management, 37, 52–57.https://doi.org/10.1016/j.tourman.2012.12.014
Tang, C. F., & Tan, E. C. (2016). The determinants of inbound tourism demand in Malaysia: Another visit with non-station-ary panel data approach. Anatolia, 27(2), 189–200.https://doi.org/10.1080/13032917.2015.1084345
Travel and Tourism Economic Impact. (2017). https://www.statista.com/statistics/233223/travel-and-tourism--total-economiccontribution-worldwide/
The United Nations World Tourism Organization. (2005). https://www.unwto.org/archive/global/publication/unwto-annualreport-2015
The United Nations World Tourism Organization. (2018).https://www.e-unwto.org/doi/book/10.18111/9789284419876
Usman, O., Elsalih, O., & Koshadh, O. (2019). Environmental performance and tourism development in EU-28 countries: The role of institutional quality. Current Issues in Tourism, 1–6.https://doi.org/10.1080/13683500.2019.1635092
Wang, H., Chen, N., & Lu, C. (2008). Tourism demand and exchange rates in Asian countries: New evidence from copulas approach. Third International Conference on Convergence and Hybrid Information Technology, 2, 1188–1193.https://doi. org/10.1109/ICCIT.2008.416.
Webber, A. (2001). Exchange rate volatility and cointegration in tourism demand. Journal of Travel Research, 39(4), 398– 405.https://doi.org/10.1177/004728750103900406
World Tourism Economy Trends. (2017).https://www.statista.com/topics/962/global-tourism/
World Trade Tourism Council. (2016).https://wttc.org/
World Travel and Tourism Council. (2017). Travel and Tourism Economic Impact 2017 World.
World Travel & Tourism Council. (2013). Economic Impact Reports. https://wttc.org/Research/Economic-Impact. World Travel & Tourism Council’s. (2019). The World Travel & Tourism Council (WTTC) represents the Travel & Tourism
sector globally.https://wttc.org/
Wu, T. P., & Wu, H. C. (2019). The link between tourism activities and economic growth: Evidence from China’s provinces. Tourism and Hospitality Research, 19(1), 3–14.https://doi.org/10.1177/1467358416683769
Xue, G. A. O., Chang, H. L., & Chi-Wei, S. U. (2018). Does exchange rate always affect the number of inbound tourists sig-nificantly in China? Theoretical & Applied Economics, 25(1).
Zhang, J., & Jensen, C. (2007). Comparative advantage: Explaining tourismflows. Annals of Tourism Research, 34(1), 223– 243.https://doi.org/10.1016/j.annals.2006.08.004
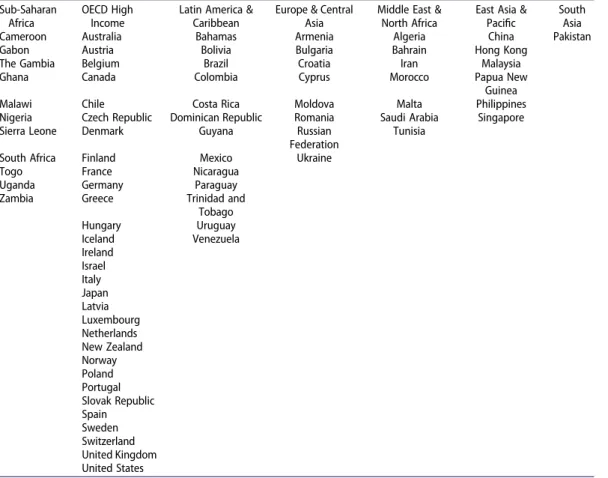
Appendix
Table A1. List of countries in the dataset Sub-Saharan
Africa
OECD High Income
Latin America & Caribbean
Europe & Central Asia
Middle East & North Africa
East Asia & Pacific
South Asia
Cameroon Australia Bahamas Armenia Algeria China Pakistan
Gabon Austria Bolivia Bulgaria Bahrain Hong Kong
The Gambia Belgium Brazil Croatia Iran Malaysia
Ghana Canada Colombia Cyprus Morocco Papua New
Guinea
Malawi Chile Costa Rica Moldova Malta Philippines
Nigeria Czech Republic Dominican Republic Romania Saudi Arabia Singapore
Sierra Leone Denmark Guyana Russian
Federation
Tunisia
South Africa Finland Mexico Ukraine
Togo France Nicaragua
Uganda Germany Paraguay
Zambia Greece Trinidad and
Tobago Hungary Uruguay Iceland Venezuela Ireland Israel Italy Japan Latvia Luxembourg Netherlands New Zealand Norway Poland Portugal Slovak Republic Spain Sweden Switzerland United Kingdom United States