Abstract. On February 1, 2020, China an-nounced a novel coronavirus CoVID-19 outbreak to the public. CoVID-19 was classified as an ep-idemic by the World Health Organization (WHO). Although the disease was discovered and concen-trated in Hubei Province, China, it was exported to all of the other Chinese provinces and spread globally. As of this writing, all plans have failed to contain the novel coronavirus disease, and it has continued to spread to the rest of the world. This study aimed to explore and interpret the effect of environmental and metrological variables on the spread of coronavirus disease in 30 provinces in China, as well as to investigate the impact of new China regulations and plans to mitigate fur-ther spread of infections. This article forecasts the size of the disease spreading based on time series forecasting. The growing size of CoVID-19 in Chi-na for the next 210 days is estimated by predicting the expected confirmed and recovered cases. The results revealed that weather conditions large-ly influence the spread of coronavirus in most of the Chinese provinces. This study has determined that increasing temperature and short-wave radia-tion would positively increase the number of con-firmed cases, mortality rate, and recovered cases. The findings of this study agree with the results of our previous study.
Key Words:
Coronavirus, Epidemic, CoVID-19, Forecasting
Abbreviations
ARIMA: Autoregressive Moving Average; CCDC: Chinese Centre of Disease Control and Prevention; CoVID-19: Novel Coronavirus; GFS; Global Forecast System; IR; Short-Wave Irradiation; WD: Wind Di-rection; WHO; World Health Organization; WS: Wind Speed.
Introduction
Scientists have recently announced the detec-tion of a novel and stealthier coronavirus, desig-nated as CoVID-19, which is responsible for the sudden outbreak of respiratory illnesses. On De-cember 31, 2019, Wuhan City in Hubei Province, China reported 27 cases of unknown etiology1.
The Wuhan Municipal Health Commission an-nounced that seven cases were detected with the same respiratory illness2. These cases had several
symptoms (i.e., very dry cough, extremely high fever, and difficult dyspnea). Further radiological examination revealed bilateral lung infiltrates3-5.
On January 9, 2020, the Chinese Centre of Dis-ease Control and Prevention (CCDC) reported to the rest of the world the news of this novel corona-virus, CoVID-196. In addition, from 15 to around
59 cases in Hubei were then suspected to be in-fected with CoVID-197. On January 22, 2019, a
CoVID-19 epidemic was then announced, and all of the data relating to these infections and its fur-ther spread were shared8.
However, it is clear that the number of infect-ed and confirminfect-ed cases vary from one province to another. Several studies9,10 have focused on
ana-lyzing the medical conditions related to CoVID-19 infections and factors responsible for its rapid spread across China and the rest of the world. In particular, some provinces showed a significantly higher number of infections than other provinces. Assessing the topology of China indicates that the number of confirmed cases is not related to the distance among provinces as some distant prov-inces were more rapidly infected than other nearby provinces. However, studying the most populous
N. AL-ROUSAN, H. AL-NAJJAR
Department of Computer Engineering, Faculty of Engineering and Architecture Istanbul Gelisim University, Istanbul, Turkey
The correlation between the spread
of COVID-19 infections and weather variables
in 30 Chinese provinces and the impact
Chinese provinces revealed that Shanghai, Beijing, and Tianjin, which are considered as the three most populated provinces, have a low number of con-firmed cases compared to other provinces.
Several studies have been conducted to estab-lish the etiology of COVID-19 infections. How-ever, the fast spreading inside and outside China is interesting and an important case to study. Evi-dently, several issues should be addressed to mit-igate further spreading of CoVID-19. In addition, it is essential to determine whether the variations in geographical nature and weather variables are correlated to the widespread occurrence of this novel coronavirus in some provinces. The main target of this research is to observe the effect of each metrological variable in China based on the incidence of coronavirus disease, and to deter-mine their effects on confirmed, fatal, and recov-ery cases in each Chinese province and to fore-cast the number of confirmed, fatal, and recovery cases in the country. To the best of our knowl-edge, the correlation of environmental variables and geographical nature on the spread of novel CoVID-19 has not been investigated to date. This study will help other researchers mitigate further the infection or increasing the number of recov-ered cases by preparing the appropriate environ-ment variables for their recovery. In addition, this study aimed to select the optimum forecasting models to estimate the worst and best scenarios in coronavirus spreading.
Materials and Methods
In this study, the first step was to explore the effect of several environmental variables on COVID-19 confirmed, fatal, and recovered cas-es. The effects of these metrological attributes on COVID-19 infections in each province were stud-ied to identify the factors that influence its further spreading in some provinces faster compared to others. The second step is to forecast the expected number of confirmed, fatal, and recovered cases in all of the Chinese provinces after 210 days for both best and worst cases. Several forecasting methods were used to accurate the expected results.
Data Sources and Assumptions
The daily metrological data for all of the Chi-nese provinces, excluding Inner Magnolia and Hong Kong, were obtained. Time series metrolog-ical data from the Global Forecast System (GFS) Web service from January 22, 2020 to March 1,
2020 were obtained. Nine different environmen-tal variables were adopted to complete this study, including delivering a time series of temperature at two meters above the ground (Kelvin), relative humidity at two meters above the ground in per-cent (%), pressure at ground level in Hectopascal (hPa), wind speed at 10 m above the ground in (m/s), wind direction at 10 m above ground in de-grees (i.e., 0 means from North, 1 and 90 from East), rainfall rate in (kg/m2), snowfall rate in (kg/
m2), snow depth in meter, and surface downward
short-wave irradiation (watt hour/m2).
In addition, a COVID-19 dataset from John Hopkins University that was collected from the World Health Organization3, the Chinese Center
for Disease Control and Prevention (CDC)11, and
European Centre for Disease Prevention and Con-trolwas used to forecast the infected, fatal, and re-covered cases4. The data covered the period from
January 22, 2020 to March 1, 2020. The published data consists of the number of confirmed, fatal, and recovered cases in all of the infected regions globally. Data were filtered to select the infected provinces in China that were considered, as well as the first infected country in the world. The fil-tered data consist of the number of COVID-19 cases in 30 Chinese provinces, excluding both In-ner Mongolia and Hong Kong.
Correlation Between the Environmental and CoVID-19 Spread In China
Correlation analysis was used to assess the ef-fect of the environmental variables on the num-ber of infected or suspected COVID-19 cases, including confirmed, fatal, and recovered cases. Several environmental variables, including tem-perature, relative humidity, pressure, wind speed, wind direction, rainfall rate, snowfall rate, snow depth, and shortwave irradiation for each day were adopted as input variables, whereas the out-put was the number of confirmed, fatal, and re-covered cases. The aim of this step was to deter-mine the impact of metrological variables on the spread of COVID-19 in China between January 22, 2020 and March 1, 2020. Pearson correlation coefficient was used to assess the relationship be-tween environmental variables and the number of confirmed, fatal, and recovered cases in all of the Chinese provinces separately. The Pearson correlation coefficient, which ranges from -1 to 1, indicates the strength of the relationship between considered variables, whereas the sign of the cor-relation coefficient indicates direction of the rela-tionship between variables12.
Forecasting the Spread of CoVID-19 In China
A time series model to forecast the growth of confirmed, fatal, and recovered cases was ad-opted. The time series model forecasts up to 7 months ahead from January 22, 2020 until Au-gust 18, 2020. Four time series models, includ-ing Brown, Holt linear trend model, Simple, and Autoregressive Moving Average (ARIMA) models, were employed to predict the spread of CoVID-19 infections in each province separate-ly13. The proposed models were used based on two
scenarios considering Chinese and global health plans to mitigate CoVID-19 spreading, and to show whether virus spread has changed after the Chinese government implemented deterministic plans (i.e., isolation, closing boarders, shutting airport, and building hospitals, etc.). The scenario encompassed the period from January 22, 2020 to March 1, 2020. While the second scenario did not consider the regulations implemented by the Chinese government. The aim of this test was to show the expected extent of COVID-19 infections when further spread of the virus is not controlled.
Results
Date and Weather Correlation Analysis
To study the impact of the variables of weather and date on the number of confirmed, fatal, and recovered cases, Pearson correlation coefficient was employed, and significant correlations were identified when p-values were ≤ 0.05 or 0.01. The movement and direction of correlated significant weather variables were only recorded based on Chinese provinces (Table I). The results revealed that temperature is the most effective variable for confirmed cases. Temperature positively affected the number of confirmed cases in 86.2% of the provinces, and the number of confirmed cases in-creased with higher temperature in most of the provinces. Furthermore, short-wave radiation is also positively correlated to the number of con-firmed cases in 72.4% of the provinces, whereas pressure contributed to 65.5% of the provinces, with a positive relationship on 27.5%, and a neg-ative relationship on 38% of the provinces. How-ever, other variables, including wind direction, wind speed, humidity, rainfall, and snow depth imparted minimal effects on the number of con-firmed cases in 37.9%, 27.5%, 24.1%, 6%, and 24.1% of the provinces, respectively, and these effects are either positive in some provinces or
negative in others. No correlation was observed between snowfall and the number of confirmed cases in all of the provinces.
Similar to the number of confirmed cases, the number of recovered cases was also affected by both temperature and short-wave radiation, with a positive effect on 93.1% and 55.2% of the prov-inces. Pressure is the third effective variable that affects 51.7% of provinces. The effects of wind direction, wind speed, humidity, rainfall ratio, snowfall ratio, and snow depth variables vary among provinces as well.
For the fatal cases, the results revealed that temperature and short-wave radiation were highly positively correlated. The impact of other variables varied among provinces, whereas snowfall did not have any effect on the number of fatal cases.
Taken together, the results indicate that tem-perature and short-wave radiation are the two most effective variables that affected 86.2% and 58.6% of the cases. Furthermore, the weather variables have a strong effect on the spread of the novel coro-navirus in most of provinces, and their impacts on fatal, recovered, and confirmed cases vary among provinces (Table I). In line with the findings of the previous correlation analysis14, we also observed
that weather variables influenced the spreading of the coronavirus in all of the Chinese provinces, and both short-wave radiation and temperature variables are the most influential variables. In the previous correlation analysis, temperature either positively or negatively impacted the number of infected cases. This discrepancy in results may be due to the lack of available data between January 22 and February 4. Sixteen provinces were affect-ed by certain weather variables, whereas a strong relationship between weather variables, popula-tion density, and the number of confirmed, fatal, or recovered cases was observed after repeating the analysis using the data collected between Jan-uary 22 and March 1. In this research and in con-trast to our expectation, increasing the tempera-ture would not mitigate the epidemic and would increase the number of infected cases in most of the provinces. Justifying the obtained results did not confirm the novel coronavirus yet. While Wei et al15 have investigated that coronavirus will be
killed by temperatures of 56°C based on a per-sonal bubble, Carbone16 found that temperatures
between 30 and 40°C would persist coronavi-ruses for a shorter time. It is found that the tem-peratures for all Chinese provinces are below the recommended temperatures to kill COVID-19. The range of temperatures in all China provinces is
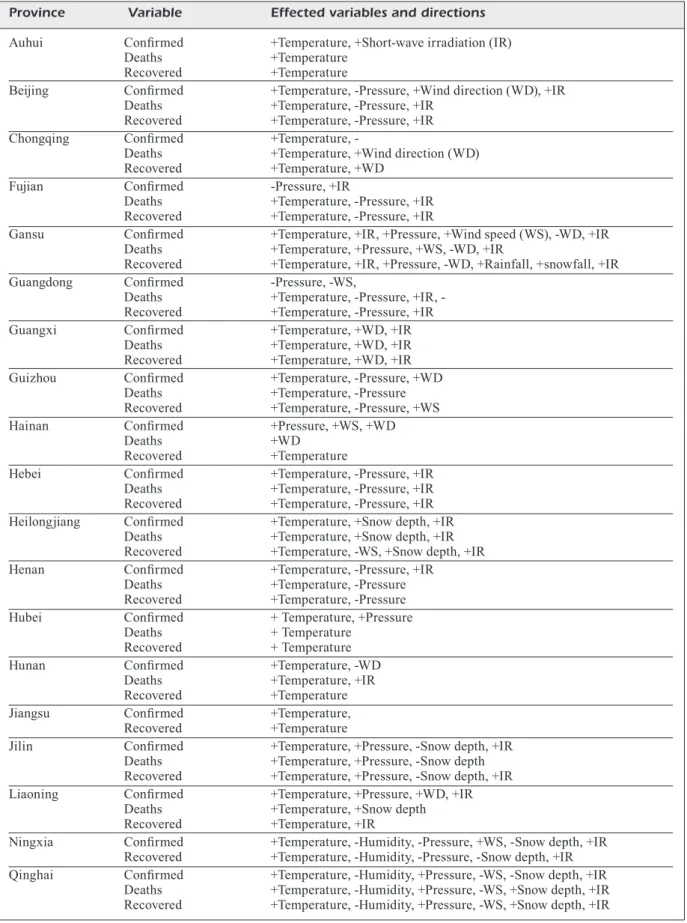
Table I. The most influential weather variables with movement direction in each province.
Countinued
Province Variable Effected variables and directions Auhui Confirmed +Temperature, +Short-wave irradiation (IR)
Deaths +Temperature
Recovered +Temperature
Beijing Confirmed +Temperature, -Pressure, +Wind direction (WD), +IR Deaths +Temperature, -Pressure, +IR
Recovered +Temperature, -Pressure, +IR Chongqing Confirmed +Temperature,
-Deaths +Temperature, +Wind direction (WD) Recovered +Temperature, +WD
Fujian Confirmed -Pressure, +IR
Deaths +Temperature, -Pressure, +IR Recovered +Temperature, -Pressure, +IR
Gansu Confirmed +Temperature, +IR, +Pressure, +Wind speed (WS), -WD, +IR Deaths +Temperature, +Pressure, +WS, -WD, +IR
Recovered +Temperature, +IR, +Pressure, -WD, +Rainfall, +snowfall, +IR Guangdong Confirmed -Pressure, -WS,
Deaths +Temperature, Pressure, +IR, -Recovered +Temperature, -Pressure, +IR Guangxi Confirmed +Temperature, +WD, +IR
Deaths +Temperature, +WD, +IR Recovered +Temperature, +WD, +IR Guizhou Confirmed +Temperature, -Pressure, +WD
Deaths +Temperature, -Pressure Recovered +Temperature, -Pressure, +WS
Hainan Confirmed +Pressure, +WS, +WD
Deaths +WD
Recovered +Temperature
Hebei Confirmed +Temperature, -Pressure, +IR Deaths +Temperature, -Pressure, +IR Recovered +Temperature, -Pressure, +IR Heilongjiang Confirmed +Temperature, +Snow depth, +IR
Deaths +Temperature, +Snow depth, +IR Recovered +Temperature, -WS, +Snow depth, +IR Henan Confirmed +Temperature, -Pressure, +IR
Deaths +Temperature, -Pressure Recovered +Temperature, -Pressure Hubei Confirmed + Temperature, +Pressure
Deaths + Temperature
Recovered + Temperature
Hunan Confirmed +Temperature, -WD
Deaths +Temperature, +IR Recovered +Temperature
Jiangsu Confirmed +Temperature,
Recovered +Temperature
Jilin Confirmed +Temperature, +Pressure, -Snow depth, +IR Deaths +Temperature, +Pressure, -Snow depth Recovered +Temperature, +Pressure, -Snow depth, +IR Liaoning Confirmed +Temperature, +Pressure, +WD, +IR
Deaths +Temperature, +Snow depth Recovered +Temperature, +IR
Ningxia Confirmed +Temperature, -Humidity, -Pressure, +WS, -Snow depth, +IR Recovered +Temperature, -Humidity, -Pressure, -Snow depth, +IR Qinghai Confirmed +Temperature, -Humidity, +Pressure, -WS, -Snow depth, +IR
Deaths +Temperature, -Humidity, +Pressure, -WS, +Snow depth, +IR Recovered +Temperature, -Humidity, +Pressure, -WS, +Snow depth, +IR
from 247.97(-25.18°C) Kelvin to 299.05(25.94°C) Kelvin. It was claimed by Wang et al17 that
coro-navirus is highly sensitive to high temperature and it could be transmitted to colder region rather than warmer region, while other research team18
found that sustained transmission of the corona-virus is possible in a range of humidity conditions (from cold and dry provinces in China to tropi-cal locations). In line with this research, our re-sults could prove that increasing the temperature could increase the growth of infected cases, and the current distribution of the disease showed that it could transmit even to highly temperature re-gions11.
Testing the Performance of the Developed Models
Different forecasting models were used to pre-dict the number of confirmed, deaths, and recov-ered cases in 30 Chinese provinces, and only the best model was recorded. The results of both dis-cussed scenarios revealed that the ARIMA model is the superior model for deaths in both scenarios, whereas both the Holt and Brown models were
most effective for both recovered and confirmed cases in both scenarios.
The results showed that the developed models can efficiently estimate the spread of CoVID-19. After building forecasting models for the two sce-narios, the results from February 5, 2020 to March 1, 2020 were used to validate the used models in estimating the spread of CoVID-19. The first sce-nario showed better performance in forecasting the confirmed and recovered cases in China com-pared to the second scenario. This is due to the data availability for the first scenario. The ranges of R2
and root mean square error (RMSE) using the sec-ond scenario range from 0.33 to 0.93 and from 1 to 51,536, respectively, where the ranges of R2 and
RMSE using the first scenario are from 0.81 to 1.00 and from 1 to 3,107 respectively. In terms of fatal cases, the data were insufficient to build a complete model to predict the movement of COVID-19.
To analyze the benefits of the new regulations and rules on the expected number of recovered and confirmed cases, 210 days ahead were con-sidered. For brevity, only the overall forecasting results of all of the Chinese provinces are
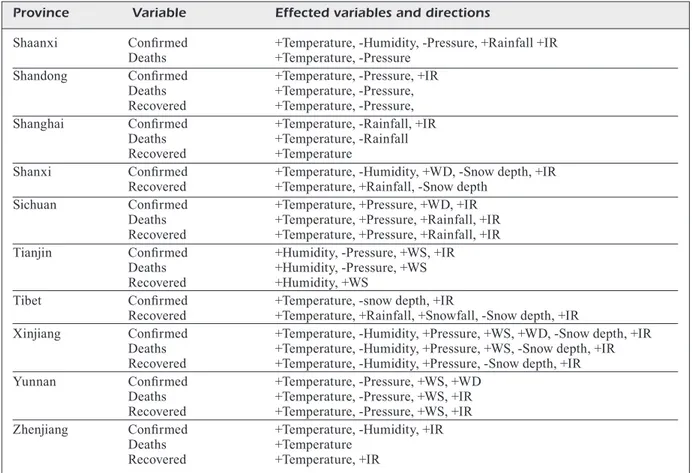
present-Table I (Continued). The most influential weather variables with movement direction in each province. Province Variable Effected variables and directions
Shaanxi Confirmed +Temperature, -Humidity, -Pressure, +Rainfall +IR Deaths +Temperature, -Pressure
Shandong Confirmed +Temperature, -Pressure, +IR Deaths +Temperature, -Pressure, Recovered +Temperature, -Pressure, Shanghai Confirmed +Temperature, -Rainfall, +IR
Deaths +Temperature, -Rainfall Recovered +Temperature
Shanxi Confirmed +Temperature, -Humidity, +WD, -Snow depth, +IR Recovered +Temperature, +Rainfall, -Snow depth
Sichuan Confirmed +Temperature, +Pressure, +WD, +IR Deaths +Temperature, +Pressure, +Rainfall, +IR Recovered +Temperature, +Pressure, +Rainfall, +IR Tianjin Confirmed +Humidity, -Pressure, +WS, +IR
Deaths +Humidity, -Pressure, +WS Recovered +Humidity, +WS
Tibet Confirmed +Temperature, -snow depth, +IR
Recovered +Temperature, +Rainfall, +Snowfall, -Snow depth, +IR
Xinjiang Confirmed +Temperature, -Humidity, +Pressure, +WS, +WD, -Snow depth, +IR Deaths +Temperature, -Humidity, +Pressure, +WS, -Snow depth, +IR Recovered +Temperature, -Humidity, +Pressure, -Snow depth, +IR Yunnan Confirmed +Temperature, -Pressure, +WS, +WD
Deaths +Temperature, -Pressure, +WS, +IR Recovered +Temperature, -Pressure, +WS, +IR Zhenjiang Confirmed +Temperature, -Humidity, +IR
Deaths +Temperature
ed. Figures 1 and 2 show the forecasting results for confirmed and recovered cases, respectively. The results of the confirmed cases showed that Scenario 1 is slower in growth than Scenario 2. Figure 2 shows that the growth of recovered cases using Scenario 1 is slower than Scenario 2, which indicates that the number of recovered cases
af-ter considering the new regulations remains slow. The results of the confirmed cases showed that the growth rate for Scenarios 1 and 2 are 2.64% and 4.43%, respectively, where the results of the recovered cases are 4.91% and 3.86%, respective-ly. The results of the confirmed cases indicate that the growth rate is decreasing using the new
regu-Figure 1. The number of confirmed cases in all of the Chinese provinces using Scenarios 1 and 2.
lations; the results of the recovered cases indicate that the growth rate will decrease in the near fu-ture. The results revealed that the new regulations and rules that were applied by the Chinese gov-ernment are efficient.
Conclusions
This study predicted the spread of CoVID-19 before and after applying the Chinese rules and regulations on COVID-19 infections. These find-ings indicate that weather conditions, particularly higher temperatures and short-wave radiation, in-crease the number of confirmed, fatal, and recov-ered cases in most of the Chinese provinces.
Conflict of Interests
The authors declared there is no conflict of interest.
References
1) Wuhan City health Committee (WChC). Wuhan Municipal Health and Health Commission’s brief-ing on the current pneumonia epidemic situation in our city 2019 [updated 31 December 201914 January 2020]. Available from: http://wjw.wuhan. gov.cn/front/web/showDetail/2019123108989. 2) Chan JF, yuan S, KoK Kh, to KK, Chu h, yang J, Xing
F, liu J, yip CC, poon RW, tSoi hW, lo SK, Chan Kh, poon VK, Chan Wm, ip JD, Cai Jp, Cheng VC, Chen h, hui CK, yuen Ky. A familial cluster of pneumo-nia associated with the 2019 novel coronavirus indicating person-to-person transmission: a study of a family cluster. Lancet 2020; 395: 514-523. 3) WoRlD health oRganization(2020). Home care for
patients with suspected novel coronavirus (nCoV) infection presenting with mild symptoms and management of contacts: interim guidance. 4) euRopean CentReFoR DiSeaSe pReVentionanD ContRol
(ECDC). Risk assessment: outbreak of acute respiratory syndrome associated with a novel coronavirus, Wuhan, China; first update 2020 [up-dated 22 January 2020]. Available from: https:// www.ecdc.europa.eu/en/publications-data/ risk-assessment-outbreak-acute-respiratory-syn-drome-associated-novel-coronavirus.
5) Chen n, zhou m, Dong X, Qu J, gong F, han y, Qiu y, Wang J, liu y, Wei y, Xia J, yu t, zhang X, zhang l. Epidemiological and clinical characteristics of 99 cases of 2019 novel coronavirus pneumonia in Wuhan, China: a descriptive study. Lancet 2020; 395: 507-513.
6) CoRman Vm, lanDt o, KaiSeR m, molenKamp R, meiJeR a, Chu DKW, BleiCKeR t, BRüninK S, SChneiDeR
J, SChmiDt ml, mulDeRS DgJC, haagmanS Bl, Van DeR VeeR B, VanDen BRinK S, WiJSman l, goDeRSKi g, Romette Jl, elliS J, zamBon m, peiRiS m, gooSSenS h, ReuSKen C, KoopmanS mpg, DRoSten C. Detec-tion of 2019 novel coronavirus (2019-nCoV) by real-time RT-PCR. Euro Surveill 2020; 25. doi: 10.2807/1560-7917.ES.2020.25.3.2000045. 7) neWS X. Experts claim that a new coronavirus
is identified in Wuhan 2020 [14 January 2020]. Available from: http://www.xinhuanet.com/2020-01/09/c_1125438971.htm.
8) holmeS e. Initial genome release of novel coronavi-rus 2020 [14 January 2020]. Available from: http:// virological.org/t/initial-genome-release-of-nov-el-coronavirus/319.
9) Wang W, tang J, Wei F. Updated understanding of the outbreak of 2019 novel coronavirus (2019‐ nCoV) in Wuhan, China. J Med Virol 2020; 92: 441-447.
10) phan lt, nguyen tV, luong QC, nguyen tV, nguyen ht, le hQ, nguyen tt, Cao tm, pham QD. Importa-tion and human-to-human transmission of a novel coronavirus in Vietnam. N Engl J Med 2020; 382: 872-874.
11) ChineSe CenteR FoR DiSeaSe ContRol anD pReVention (CDC), 2019 Novel Coronavirus, 2020, Beijing, China.
12) BeneSty J, Chen J, huang y, Cohen i. Pearson cor-relation coefficient. In Noise reduction in speech processing. Springer International Publishing, 2009.
13) hynDman RJ, athanaSopouloS g. Forecasting: prin-ciples and practice. OTexts, 2018.
14) al-RouSan n, al-naJJaR h. Nowcasting and fore-casting the spreading of novel Coronavirus 2019-nCoV and its association with weather vari-ables in 30 Chinese provinces: a case study. Available at SSRN: http://dx.doi.org/10.2139/ss-rn.3537084.
15) Wei W, lu Jg, galinSKy aD, Wu h, goSling SD, Rent -FRoW pJ, yuan W, zhang Q, guo y, zhang m, gui W, guo Xy, potteR J, Wang J, li B, li X, han ym, lV m, guo XQ, Choe y, lin W, yu K, Bai Q, Shang z, han y, Wang l. Regional ambient temperature is associated with human personality. Nat Hum Behav 2017; 1: 890-895.
16) CaRBone C. Could this bizarre personal bubble kill coronavirus? Fox News March 3, 2020. Available at: https://www.foxnews.com/science/person-al-bubble-bat-man-coronavirus.
17) Wang m, Jiang a, gong l, luo l, guo W, li C, zheng J, li C, yang B, zeng J, Chen y, zheng K, li h. Temperature significant change COVID-19 transmission in 429 cities. medRxiv 2020. Doi: https://doi.org/10.1101/2020.02.22.20025791. 18) luo W, maJumDeR mS, liu D, poiRieR C, manDl KD,
lipSitCh m, Santillana m. The role of absolute humidity on transmission rates of the COVID-19 outbreak. medRxiv 2020. Doi: https://doi.org/10.1 101/2020.02.12.20022467.