T.R.
ANTALYA BILIM UNIVERSITY
INSTITUTE OF POSTGRADUATE EDUCATION
DISSERTATION MASTER’S PROGRAM OF ELECTRICAL AND
COMPUTER ENGINEERING
UTILIZING MUTUAL EXCLUSIVITY FOR THE
IDENTIFICATION OF CANCER DRIVER GENE MODULES
DISSERTATION
Prepared By
Rafsan Ahmed
Student ID: 181212003
T.R.
ANTALYA BILIM UNIVERSITY
INSTITUTE OF POSTGRADUATE EDUCATION
DISSERTATION MASTER’S PROGRAM OF ELECTRICAL AND
COMPUTER ENGINEERING
UTILIZING MUTUAL EXCLUSIVITY FOR THE
IDENTIFICATION OF CANCER DRIVER GENE MODULES
DISSERTATION
Prepared By
Rafsan Ahmed
Student ID: 181212003
Dissertation Advisors
Assoc. Prof. Dr. Hilal Kazan
APPROVAL/NOTIFICATION FORM
ANTALYA BILIM UNIVERSITY
INSTITUTE OF POST-GRADUATE EDUCATION
Rafsan Ahmed, a M.Sc. student of Antalya Bilim University, Institute of Post Gradu-ate Education, Electrical and Computer Engineering owning student ID 181212003, suc-cessfully defended the thesis/dissertation entitled ”Utilizing Mutual Exclusivity for the Identification of Cancer Driver Gene Modules”, which he prepared after fulfilling the re-quirements specified in the associated legislation, before the jury whose signatures are below.
Academic Tittle, Name-Surname, Signature
Thesis Advisor: Assoc. Prof. Dr. Hilal Kazan ,...
Thesis Co-Advisor: Prof. Dr. Cesim Erten ,...
Jury Member: Assoc. Prof. Dr. Nurcan Tunc¸ba˘g ,...
Jury Member: Asst. Prof. Dr. Shahram Taheri ,...
Jury Member: Asst. Prof. Dr. Deniz Genc¸a˘ga ,...
Director of The Institute: Prof. Dr. Ibrahim Sani Mert ,...
Date of Submission : 28 / 08 / 2020 Date of Defence : 10 / 09 / 2020
¨
OZET
KARS¸ILIKLI DIS¸LAMA KULLANILARAK KANSER S ¨
UR ¨
UC ¨
U GEN
MOD ¨
ULLERININ BULUNMASI
B¨uy¨uk kanser kohortlarından alınan genomik analizler, sadece mutasyon profillerine dayalı olarak s¨ur¨uc¨u genlerin tanımlanmasını engelleyen mutasyonel heterojenlik prob-lemini ortaya c¸ıkarmıs¸tır. Bu sorunu c¸ozmenin bir yolu, genlerin fonksiyonel mod¨ullerde birlikte hareket etti˘gi bilgisini kullanmaktır. Mevcut protein-protein etkiles¸im a˘glarında bulunan ba˘glantı bilgisi, genlerin mutasyon frekansları ve kanser mutasyonlarının mutual exclusivity ozelli˘gi ile birlikte el alınarak kanser s¨ur¨uc¨u mod¨ullerinin etkin bir s¸ekilde bulunması ic¸in kullanılabilir.
Bu tezde, protein-protein etkiles¸im a˘glarında mevcut olan ba˘glantıları, kars¸ılıklı dıs¸lama ve kapsam bilgileriyle birles¸tirerek ayrıt a˘gırlıkları tanımlayan ve daha sonra bu a˘gırlıkları kullanan MEXCOwalk adında bir rastgele y¨ur¨uy¨us¸ algoritması onerilmektedir. MEXCOwalk TCGA pan-kanser verileri ¨uzerinde bilinen kanser genlerini bulma, normal ve t¨umor orneklerini sınıflandırma ve belirli kanser t¨urleri ic¸in zenginles¸mis¸ mutasyon profillerine sahip gen setlerini mod¨ul olarak tanımlama ac¸ıarıindan var olan yontemler-den daha iyi performans gostermektedir. Ayrıca, MEXCOwalk pan-kanser verilerinde nadiren mutasyona u˘gramıs¸ kanser genlerini tespit etmede de bas¸arılı olmus¸tur. Tezin, ikinci kısmında, mevcut kars¸ılıklı dıs¸lama bulma algoritmalarını de˘gerlendirme amacıyla a˘g merkezli yenilikc¸i bir yontem gelis¸tirilmis¸; iyi c¸alıs¸an kars¸ılıklı dıs¸lama bulma algorit-malarının c¸ıkıları MEXCOwalk ayrıt a˘gırlıklarında kullanıdı˘gında performansın daha da iyiles¸ti˘gi gozlemlenmis¸tir.
ABSTRACT
UTILIZING MUTUAL EXCLUSIVITY FOR THE IDENTIFICATION
OF CANCER DRIVER GENE MODULES
Genomic analyses from large cancer cohorts have revealed the mutational heterogeneity problem which hinders the identification of driver genes based only on mutation pro-files. One way to tackle this problem is to incorporate the fact that genes act together in functional modules. The connectivity knowledge present in existing protein-protein inter-action networks together with mutation frequencies of genes and the mutual exclusivity of cancer mutations can be utilized to increase the accuracy of identifying cancer driver modules.
We present a novel edge-weighted random walk-based approach that incorporates con-nectivity information in the form of protein-protein interactions, mutual exclusion, and coverage to identify cancer driver modules. MEXCOwalk outperforms several state-of-the-art computational methods on TCGA pan-cancer data in terms of recovering known cancer genes, providing modules that are capable of classifying normal and tumor sam-ples, and that are enriched for mutations in specific cancer types. MEXCOwalk identifies modules containing both well-known cancer genes and putative cancer genes that are rarely mutated in the pan-cancer data. We then take this approach one step further by devising a network-centric epistasis framework to evaluate the estimated values from ex-isting mutual exclusivity finding algorithms and applying these values to MEXCOwalk. We observe a significant improvement in the recovery of known driver genes.
DEDICATION AND ACKNOWLEDGMENT
I would like to thank my graduate studies supervisors Assoc. Prof. Dr. Hilal Kazan and Prof. Dr. Cesim Erten for their expert guidance and feedback during the course of this project. The motivation and support they provided through their mentorship not only steered me through this research but also helped pave my career.
I would also like to share my gratitutde towards my fellow M.Sc. researchers Aissa Houdjedj, Ilyes Baali, Ahmed Amine Taleb Bahmed and Yacine Marouf for their feed-back, criticism, cooperation and for creating a wonderful research environment in the lab. I would like to thank Evis Hoxha for developing the base of this research. I would also like to thank Cansu Yalc¸in for her encouragement.
Lastly, I would like to thank my family and friends for supporting me spiritually throughout my research. I would not be here without them.
This work and relevant publications have been supported by the Scientific and Tech-nological Research Council of Turkey (T ¨UB˙ITAK) - project 117E879 to H.K and C.E.)
Contents
1 Introduction 1 1.1 Contribution . . . 2 1.2 Thesis Organization . . . 3 1.3 Publications . . . 3 2 Background 4 2.1 Mutational Heterogeneity in Cancer . . . 42.2 Mutual Exclusivity . . . 4
2.3 A review of driver gene finding algorithms . . . 5
2.3.1 De novo methods . . . 5
2.3.2 Knowledge-based methods . . . 5
2.4 A review of statistical mutual exclusivity finding algorithms . . . 6
3 MEXCOwalk 9 3.1 Methods . . . 9
3.1.1 Problem Definition . . . 9 3.1.2 MEXCOWalk Algorithm . . . 11 3.2 Results. . . 16 3.2.1 Input Data. . . 16 3.2.2 Parameter Settings . . . 17 3.2.3 Static Evaluations. . . 18 3.2.4 Modular Evaluations . . . 19
3.3 Analysis of MEXCOWalk Modules . . . 22
4 Network Centric Epistasis Evaluation 26 4.1 Methods . . . 26
4.1.1 Problem definition . . . 26
4.1.2 Network-centric Epistasis Evaluation Framework . . . 26
4.1.3 Metrics for Network-centric Epistasis Evaluations . . . 27
4.1.4 Network-centric Epistasis Corrections in Relation to MLA . . . . 29
4.1.5 Relating MLA to Network-centric Epistasis . . . 30
4.2 Results. . . 31
4.2.1 Input Data. . . 31
4.2.4 Network-centric Epistasis in Identifying Driver Modules . . . 38
5 Conclusion 42
5.1 Conclusion . . . 42
5.2 Future Work . . . 43
A Supplementary 52
A.1 MEXCOwalk with different parameter settings . . . 52
A.1.1 Effects of Mutual Exclusivity Threshold θ . . . 52
A.1.2 Effects of min module size . . . 52
A.2 Network-centric epistatic evaluation framework with control group X1
and X2for mutation threshold 20 . . . 55
A.3 Percentage significance finding of different cancer types . . . 58
A.4 AUROC for different cancer types . . . 66
INSTITUTE OF POSTGRADUATE EDUCATION ELECTRICAL
AND COMPUTER ENGINEERING MASTERS PROGRAM WITH
THESIS
ACADEMIC DECLARATION
I hereby declare that this master’s thesis titled ”Utilizing Mutual Exclusivity for the Iden-tification of Cancer Driver Gene Modules” has been written by myself under the academic rules and ethical conduct of the Antalya Bilim University. I also declare that the work at-tached to this declaration complies with the university requirements and is my work. I also declare that all materials used in this thesis consist of the mentioned resources in the reference list. I verify all these with my honor.
28/08/2020 Rafsan Ahmed
List of Figures
3.1 The fraction of recovered CGC genes for each total genes value is shown
with a ROC plot. AUROC values are written in parentheses for each
applicable method. . . 18
3.2 A) DMSS evaluations of output modules of MEXCOwalk, MEMCover,
Hotnet2, and Hierarchical Hotnet for increasing values of total genes. B) Average modules sizes in the outputs of MEXCOwalk, MEMCover,
Hotnet2, and Hierarchical Hotnet for increasing values of total genes. . . 20
3.3 A) CTSS evaluations of output modules of MEXCOwalk, MEMCover,
Hotnet2, and Hierarchical Hotnet for increasing values of total genes. B) MCAS evaluations of output modules of MEXCOwalk, MEMCover,
3.4 A) MEXCOWalk output modules when total genes = 100. Diamond shaped nodes correspond to CGC genes. Sizes of the nodes are propor-tional with mutation frequencies of corresponding genes. Edges within the module are colored black, whereas the edges between the modules are colored. Edge weights are reflected in the thicknesses of the line seg-ments. Color of a module denotes the cancer type with the strongest en-richment for mutations in genes of that module. The legend for the color codes are shown on the right. Each module is named with the largest de-gree gene in the module. B) Results of cancer type specificity and survival analyses. Rows correspond to modules and columns correspond to cancer types. Colors of the matrix entries indicate the significance of enrichment for cancer types in terms of Fisher’s exact test p-values. Stars indicate the
significance of log-rank test p-values in survival analyses. . . 23
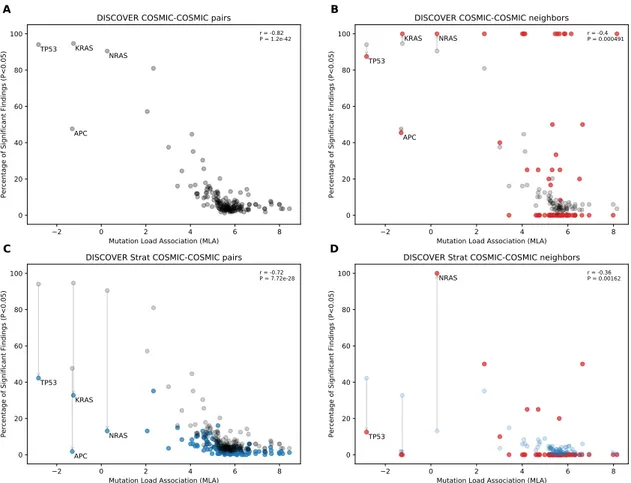
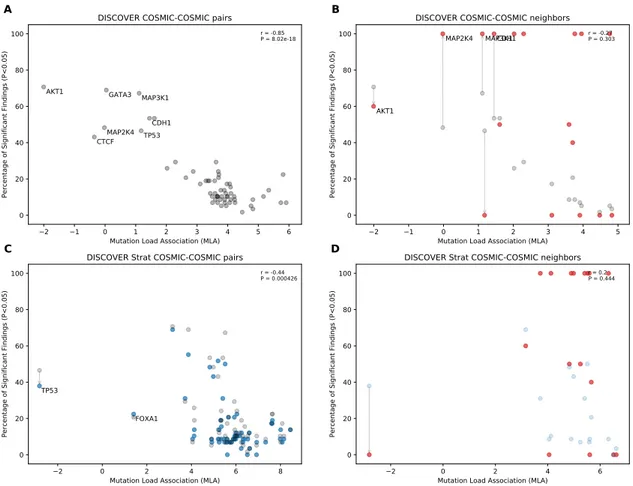
4.1 Comparison of mutual exclusivity results of DISCOVER and DISCOVER
Strat on COADREAD cohort (498 samples) (A) The scatterplot of per-centage significance of mutual exclusivity runs (p-value¡0.05) of DIS-COVER on COADREAD data where tests are performed between a CGC gene and all other CGC genes . (B) The scatter plot of percentage sig-nificance of mutual exclusivity runs of DISCOVER where tests are per-formed between a CGC gene and its PPI neighbors that are in CGC (red) compared with (A) in gray. (C) The scatterplot of percentage significance of mutual exclusivity runs of DISCOVER Strat where where tests are per-formed between a CGC gene and all other CGC genes (blue) compared with the results from (A) in gray. (D) The scatterplot of percentage sig-nificance of mutual exclusivity runs of DISCOVER Strat where tests are performed between a CGC gene and its PPI neighbors that are in CGC
4.2 Comparison of mutual exclusivity results of DISCOVER and DISCOVER Strat on BRCA cohort (1026 samples) (A) The scatterplot of percentage significance of mutual exclusivity runs (p-value¡0.05) of DISCOVER on BRCA data where tests are performed between a CGC gene and all other CGC genes . (B) The scatter plot of percentage significance of mutual ex-clusivity runs of DISCOVER where tests are performed between a CGC gene and its PPI neighbors that are in CGC (red) compared with (A) in gray. (C) The scatterplot of percentage significance of mutual exclusiv-ity runs of DISCOVER Strat where where tests are performed between a CGC gene and all other CGC genes (blue) compared with the results from (A) in gray. (D) The scatterplot of percentage significance of mutual ex-clusivity runs of DISCOVER Strat where tests are performed between a CGC gene and its PPI neighbors that are in CGC (red) compared with (C)
in blue. . . 37
4.3 The figure shows the area under the ROC curve for MEXCOwalk runs on
COADREAD t5 using the mutual exclusivity p-values as the MEX edge weight for each model and the filtered IntAct PPI network. In order to apply similar parameters to MEXCOwalk, number of edges assigned 0 weight is based on the density of the original MEXCOwalk run on HINT network. The original MEXCOwalk algorithm was run on COADREAD t5 with different threshold which are reflected through the model names.
Note that, t5 was used because t20 didn’t provide 2500 genes . . . 39
S1 Comparison of MEXCOwalk models with different mutual exclusion
score thresholds (θ ): 0.5, 0.6, 0.7, 0.8 and 0.9 A) ROC plots and AUROC values written in parentheses. B) Driver Modules Set Score (DMSS). C)
S2 Comparison of MEXCOwalk models with different min module size: 3, 6, 9, 12 A) ROC plots and AUROC values written in parentheses. B) Driver Modules Set Score (DMSS). C) Mutual Exclusion Score (MS). D)
Coverage Score (CS). . . 54 S3 BRCA . . . 58 S4 BLCA . . . 59 S5 COADREAD . . . 60 S6 LUAD . . . 61 S7 LUSC . . . 62 S8 SKCM . . . 63 S9 STAD . . . 64 S10 UCEC . . . 65
List of Tables
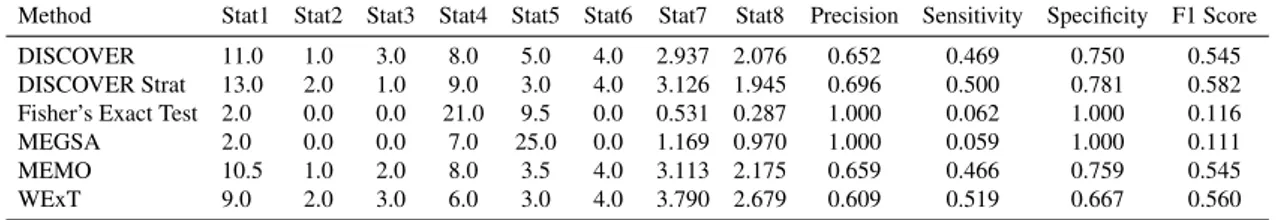
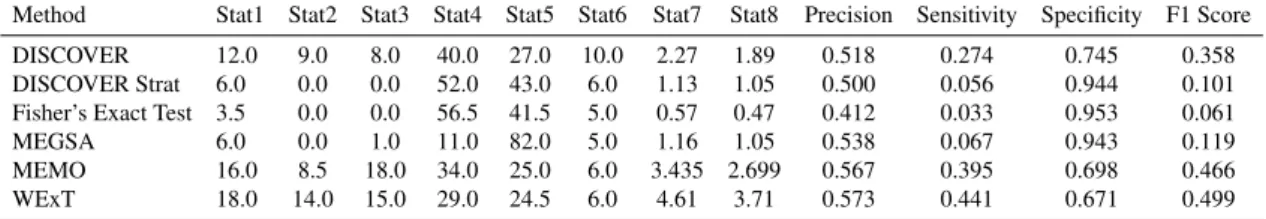
4.1 BRCA control group X1(34 COSMIC-COSMIC pairs) . . . 32
4.2 BRCA control group X2(9 COSMIC-COSMIC pairs) . . . 33
4.3 COADREAD control group X1(196 COSMIC-COSMIC pairs) . . . 33
4.4 COADREAD control group X2(107 COSMIC-COSMIC pairs) . . . 33
S1 BLCA control group X1(56 COSMIC-COSMIC pairs) . . . 55
S2 BLCA control group X2(24 COSMIC-COSMIC pairs) . . . 55
S3 LUAD control group X1(92 COSMIC-COSMIC pairs) . . . 55
S4 LUAD control group X2(59 COSMIC-COSMIC pairs) . . . 55
S5 LUSC control group X1(38 COSMIC-COSMIC pairs) . . . 56
S6 LUSC control group X2(22 COSMIC-COSMIC pairs) . . . 56
S7 SKCM control group X1(458 COSMIC-COSMIC pairs) . . . 56
S8 SKCM control group X2(313 COSMIC-COSMIC pairs) . . . 56
S9 STAD control group X1(140 COSMIC-COSMIC pairs) . . . 56
S11 UCEC control group X1(1356 COSMIC-COSMIC pairs) . . . 56
CHAPTER 1
1. Introduction
Cancer is defined as the uncontrolled growth of abnormal cells in the body. It is a complex disease that affects a large number of people in the world. Second only to car-diovascular disease, cancer is one of the leading causes of death in the world, killing approximately 10 million people annually. The reason behind the complex nature of can-cer is mutational heterogeneity, which suggests that different genes mutate in different tumors, making it difficult for a commmon targeted therapy.
Recent advances in high-throughput DNA sequencing technology have opened up a Pandora’s box which allowed several projects such as the TCGA [1] to construct and release genomic data from thousands of tumors. This further gave rise to the design of several computational approaches for the systematic detection of cancer-related somatic mutations - genetic mutations that are not inherited but acquired after an individual is born. These computational approaches focus on prioritizing independent genes to provide a genomic landscape that facilitates the identification of hypothesized cancer driver genes, referring to genes that are causally linked to oncogenesis [2,3,4,5]. However, mutational heterogeneity in cancer causes some genes to mutate in a large number of samples and the rest to mutate in fewer samples. This leads to something called a long tail phenomenon. If a certain computational approach for driver gene discovery is applied to such data without additional information, the majority of genes discoverd will be from the set of highly mutated genes and may have a bias against the genes in the long tail region.
Many recent computational methods integrate somatic mutation data with additional information in the form of interaction networks (e.g. protein-protein interaction network orPPI) or gene expression data. Since genes do not function alone but work interactively, focusing on funcional modules instead of individual genes allow us to get additional infor-mation. Although such gene rankings provide valuable insight regarding potential genes of interest, in many cases mutations at different loci could lead to the same disease [6]. This genetic heterogeneity may reflect an underlying molecular mechanism in which the cancer-causing genes form some kind of functional pathways or candidate driver mod-ules. Genomic data has shown that, many cancer driver genes are mutated in tumors with a small number of mutations [7]. In other words, certain genes belonging to the same pathway do not mutate together in the same tumor, since either of them can lead to onco-genesis. This phenomenon is called Mutual Exclusivity. This mainly occurs due to the selection pressure and fitness advantage on genes. Since it is established that driver genes tend to be mutually exclusive in the same tumor, mutual exclusivity can be concurrently used as additional information to identify driver gene modules from genomic data.
In this thesis we aim to first identify cancer driver modules from genomic data by utilizing mutual exclusivity and interaction data. We develop a novel cancer driver module finding algorithm, MEXCOwalk, that utilizes this information. Secondly, we develop a network-centric framework to evaluate existing algorithms for finding mutual exclusivity. We then apply the mutual exlusivity values estimated by these algorithm to MEXCOwalk to assess whether they improve over original MEXCOwalk.
1.1. Contribution
We provide an overview of the research contributions in this thesis towards the problem of driver module identification in cancer as well as comparing different mutual exclusivity finding algorithms and finding the best outcome. We provide a novel combinatorial opti-mization problem definition to detect driver modules in cancer. We then develop an algo-rithm, MEXCOwalk, that identifies such driver modules in cancer from genomic data, by utilizing mutual exclusivity and coverage information. Next, we look at existing mutual exclusivity finding algorithms and evaluate the methods based on a novel network-centric framework. Finally, we conduct a thorough evaluation of the results, first by compar-ing the results from MEXCOwalk against other driver gene module findcompar-ing algorithms,
followed by applying the estimated mutual exclusivity values from the existing mutual exclusivity finding algorithms to MEXCOwalk and evaluating the results.
1.2. Thesis Organization
The thesis is organized as follows:• In Chapter 2, we provide a review of cancer biology including mutual exclusivity and epistasis. We also review driver gene module finding algorithms and mutual exclusivity algorithms.
• In Chapter 3, we establish a formal problem definition in identifying driver gene modules and discuss the proposed algorithm, MEXCOwalk. We then present the results of MEXCOwalk in comparison to state-of-the-art driver gene module find-ing algorithms and discuss the key biological insights of the results.
• In Chapter 4, we establish a formal problem definition for evaluation of statistical mutual exclusivity finding algorithms. We then present the results from our pro-posed network centric evaluations of mutual exclusivity algorithms.
• Finally, in Chapter 5, we discuss the results and summarize the thesis.
1.3. Publications
• R. Ahmed, I. Baali, C. Erten, E. Hoxha, and H. Kazan, “MEXCOwalk: mutual exclusion and coverage based random walk to identify cancer modules,” Bioinfor-matics, vol. 36, pp. 872–879, 08 2019.
CHAPTER 2
2. Background
In this chapter, we aim to cover the fundamental computational and biological aspects behind the thesis.
2.1. Mutational Heterogeneity in Cancer
Cancer is a disease caused by the uncontrollable cell division of abnormal cells. This occurs due to the accumulation of somatic mutations in different genes that control cell proliferation. Mutational heterogeneity in cancer allows different tumors to have muta-tions in different sets of genes. Even different cancerous tumors in the same patient can have mutations in significantly different genes. This creates the afforementioned long tail phenomenonwhich is when we observe some genes having mutations in a large number of samples and the rest having mutations in fewer samples. Eventually when we attempt to discover cancer driver genes, a selection advantage is present for genes with large mu-tation frequency. Since the mumu-tational heterogeneity problem hinders the identification of cancer driver genes with low mutation frequency, additional information is required to discover such genes.
2.2. Mutual Exclusivity
Mutual exclusivity refers to the phenomenon that for a group of genes which exhibit evidence of shared functional pathway, simultaneous mutations in the same tumor are less frequent than is expected by chance [8]. When there is a mutation in a specific cancer driver gene, it is a causality of the presence of complimentary mutations in the
same pathway that act synergistically with that driver gene. Alternatively, multiple driver gene mutations in the same pathway is less likely to occur because they lead to the same functional effect [7]. Mutual exclusivity among genes generally arise from epistatic in-teraction, where the selection pressue is strong for a particular gene. However, mutual exclusivity can also arise from underlying biological properties, such as tumor subtypes.
2.3. A review of driver gene finding algorithms
Several computational methods have been suggested for the identification of candidate driver modules [9, 10, 11]. The module identification approaches as applied to cancer can be viewed in two broad categories based on the types of input data they employ: the de novo methods and knowledge based methods. Following sections contain brief descriptions of each method.
2.3.1. De novo methods
The de novo methods rely only on genetic data to discover novel genetic interactions, as well as cancer-related functional modules [12, 13, 14, 15]. Due to the large solution space such methods usually apply a prefiltering based on alteration frequency to reduce the inherent computational complexity which may reduce sensitivity by overlooking mod-ules involving rare alterations [9].
2.3.2. Knowledge-based methods
Knowledge-based methods, in addition to genomic data, incorporate prior knowl-edge in the form of pathways, networks and functional phenotypes to identify driver mod-ules. Such methods can be subcategorized based on the optimization goals set within the computational problem formulations they employ in defining the biologically motivated cancer driver module identification problem. The first subcategory consists of methods including Hotnet [16], Hotnet2 [17], Hierarchical Hotnet [18] which utilize the fact that a driver pathway tends to be perturbed in a relatively large number of patients. These methods informally optimize the coverage of the modules as identified by the mutation frequencies of the comprising genes over a cohort of samples constitutes an informal optimization goal. Heat-diffusion over an interaction network that diffuses the mutation frequencies throughout the network is a common attribute in these methods. The resulting
diffusion values are then employed to extract modules exhibiting a large degree of con-nectedness as formulated with an appropriate graph-theoretical connectivity definition, usually the strong connectivity.
The second subcategory of knowledge-based module identification methods incorpo-rate an appropriate definition mutual exclusion in their computational problem formula-tions. Several cancer module identification methods incorporate this observation in the employed combinatorial optimization problem definitions. In MEMo, maximal clique extraction in a similarity graph derived from an interaction network or functional relation graph is used and the maximal cliques are postprocessed taking into account the mu-tual exclusivity results [19]. In Babur et al. [20] a method based on seed-and-growth on a network, where the growth strategy is determined with respect to a suitably defined mutual exclusion score is proposed to identify pan-cancer modules using TCGA data. Be-With proposes an ILP formulation that combines interaction density within a module and several mutual exclusion definitions as a maximization goal [21]. The ILP formulation incorporates constraints in the form of desired number of modules and maximum num-ber of genes per module. MEMCover combines pairwise mutual exclusion scorses with confidence values of interactions in the network [22]. To maximize high-confidence in-teractions, mutual exclusion, and coverage simultaneously; heavy subnetworks covering every disease case at least k times are found following a greedy iterative seed-and-growth heuristic.
2.4. A review of statistical mutual exclusivity finding algorithms
As discussed previously, many computational methods aim to utilize mutual exclusivity for precision medicine and targeted therapy. Some statistical mutual exclusivity tests are based on the assumpton that genes’ alterations across tumors are identically distributed. We choose five popular statistical mutual exclusivity methods: DISCOVER [23], Fisher’s Exact Test, WExT [24], MEMO [19] and MEGSA [25]. Each of these methods outputs a p-value for each gene pair, where a small p-value indicates that the mutation profiles of the corresponding gene pair exert a much smaller overlap and thus larger mutual exclusivity than it would be expected by chance.DISCOVER is a statistical independence test that utilizes tumor specific alteration prob-abilities, which is in contrast with many existing tests that consider identically distributed events. The method is able to detect significant mutual exclusivities without increasing the false positive rate. WExT is a weighted exact test that aims to find highly signifi-cant mutual exclusivities by considering per-event and per-sample mutation probabilities. Unlilke the other mutual exclusity finding algorithms, WExT employs a highly accurate saddlepoint approximation was used to calculate the p-values for pairwise mutual exclu-sivity without going through computationally expensive permutations tests. The MEMO algorithm uses mutual exclusivity to identify candidate drivers networks. For pairwise mutual exclusivity, a bipartite graph of patients and genes is constructed from the mu-tation data. An edge swapping method is applied and the results are compared with the original graph to derive p-values for pairwise mutual exclusivity. The algorithm was reimplemented from scratch to get pairwise mutual exclusivity and fit our data. Follow-ing MEMO [19], the edges from the binary matrix were swapped 100*edges times and this permutation was done 10000 times for each cancer type. MEGSA is a framework that extends pairwise analysis and searches for MEGS (Mutually Exclusive Gene Sets). The pairwise mutual exclusivity p-values for MEGSA are calculated applying chi-square cumulative probability less than or equal to the value of the log likelyhood calculated by the funestimate function.
Some statistical mutual exclusivity tests are based on the assumption that genes’ alter-ations across tumors are identically distributed. Among the approaches considered in this study Fisher’s Exact Test and MEGSA [25] belong to this category. However it has been observed that the number of alterations per tumor can vary quite considerably, even in tumors of the same type; colorectal tumors with microsatellite stability have a median of 66 non-synonymous mutations, but colorectal tumors with microsatellite instability have a median of 777 mutations [24]. It has been shown that under such settings the mutual exclusivity tests relying on identical alteration probabilities across tumors may lead to reduced sensitivity for mutual exclusivity analysis [23]. The effects of varying alteration probabilities on pairwise mutual exclusivity calculations have been formalized within the context of the so-called mutation load confounding (MLC) in a recent study by van de
Haar et al. [7]. MLC is a correlation between the number of statistically significant mu-tual exclusivity findings and the mutation load association (MLA) of a gene, where logis-tic regression is used to compute MLA as a standardized score of association between the mutation likelihood of each gene and the mutation load, that is the genome-wide number of somatic mutations observed in a tumor. Note that negative MLA values correspond to higher mutation frequencies in tumors with low mutation loads, whereas positive values correspond to higher mutation frequencies in tumors with high mutation loads. Strong negative correlations between the MLA of a gene and the number of statistically signif-icant pairwise mutual exclusivities have been observed, implicating the finding that the more negative a gene’s MLA, the higher the number of other genes that show mutual exclusivity with that particular gene [7].
However, such a negative correlation does not always imply true epistasis since a gene highly mutated in tumors wih low mutation loads, naturally has a better chance of form-ing mutually exclusive pairs with other genes. Thus extra sources of information are necessary to filter out the pairs with true epistasis relations among a set of statistically significant pairwise mutual exclusivities postulated by some exclusivity test. van de Haar et al. [7] make use of the subtype information for such a purpose and show that the muta-tion load confounding can be reduced by correcting via tumor subtype stratificamuta-tion. Such a correcton greatly reduces the number of gene pairs reported to show mutual exclusivity, especially for pairs that include genes with low MLA. A major drawback is the absence of subtype information for many tumors.
CHAPTER 3
3. MEXCOwalk
In this chapter, we provide a formal definition of the cancer driver gene module dis-covery problem and discuss our proposed algorithm MEXCOwalk. We then compare the results of MEXCOwalk on pan-cancer data against existing state of the art driver gene module finding algorithms.
3.1. Methods
The following sections include a detailed description of the methods for MEXCOwalk.
3.1.1. Problem Definition
We provide a novel combinatorial optimization problem definition to detect driver modules in cancer. Such a definition is not only important for algorithmic purposes but also to serve as a measure of performance for alternative methods suggested for the prob-lem.
Let Sidenote the set of samples for which gene giis mutated. Let G = (V, E) represent
the PPI network where each vertex ui∈ V denotes a gene gi whose expression gives rise
to the corresponding protein in the network and each undirected edge (ui, uj) ∈ E denotes
the interaction among the proteins corresponding to genes gi, gj. Henceforth we assume
that gidenotes both the gene and the corresponding vertex in G.
as,
MEX(M) = |
S
∀gi∈MSi|
∑∀gi∈M|Si|
and the coverage of M as,
CO(M) = | S ∀gi∈MSi| |S ∀gi∈VSi| .
Let P = {M1, M2, . . . Mr} be a set of modules. Let RS(Mq) denote the relative size of a
module Mq with respect to the total size, that is RS(Mq) = |∪ |Mq|
∀Mt ∈PMt|. We define the
mu-tual exclusion score and the coverage score of a set of modules, so that each module Mq
contributes its share proportional to its relative size RS(Mq) for the former, whereas for
the latter the contribution of Mq is proportional to the normalized value of 1 − RS(Mq).
Intuitively, a large module with high mutual exclusion score should be rewarded, since as the size of the module increases the chances of achieving better mutual exclusion de-crease. Analogously, a small module with high coverage score should be rewarded. Thus we define the mutual exclusion score of P as,
MS(P) =
∑
∀Mq∈P
RS(Mq) × MEX (Mq).
The coverage score of P is defined as
CS(P) =
∑
∀Mq∈P 1 − RS(Mq) ∑∀Mt∈P1 − RS(Mt) ×CO(Mq), if |P| > 1 and CS(P) = CO(M1), if |P| = 1.For a graph H and a set Mqof genes, let H(Mq) denote the subgraph of H induced by
the vertices corresponding to genes in Mq.
Cancer driver module identification problem: Given as input a PPI network G, Si for
each gene gi, integers total genes, and min module size, find a disjoint set of modules P
that maximizes the driver module set score defined as,
DMSS(P) = MS(P) ×CS(P) (3.1)
and that satisfies the following:
1. For each Mq∈ P, G(Mq) is connected.
2. |S
3. min∀Mq∈P|Mq| = min module size.
Theorem 1. Cancer driver module identification problem is NP-hard.
Proof. The transformation is from Set Packing which is shown to be NP-complete. In the Set Packing problem, given a collection C of finite sets and a positive integer K ≤ |C|, the problem is to find out whether C contains at least K mutually disjoint sets. The problem is NP-hard even when the size of each set is at most 3, which can easily be extended to the setting where the size of each set is exactly 3. Given an input to the Set Packing problem within this setting in the form of K and C such that for each S ∈ C, |S| = 3, we generate Gas a complete graph on |C| vertices, corresponding to the set of genes, such that each finite set in C corresponds to a set of samples Sifor which gene giis mutated. We set both
total genesand min module size to K. The answer to the Set Packing problem is Yes, if and only if the maximized score of the cancer module identification problem is exactly
3×K |S
∀gi∈VSi|.
3.1.2. MEXCOWalk Algorithm
Since the problem is computationally intractable we provide a polynomial-time heuristic approach based on vertex and edge-weighted random walks on special graphs that incorporate mutual exclusion and coverage information as vertex and edge weights in the H.Sapiens PPI network. The pseudocode of our method is provided in Algorithm1. There are three main steps of the algorithm, each of which is described in detail in the following subsections.
3.1.2.1. Weight Assignment with MEX and CO
Given a PPI network G = (V, E), we first construct a weighted graph Gw that
contains properly defined weights for vertices and edges. For each gi∈ V we
assign a weight, w(gi) = CO({gi}), thus the weight corresponds to the mutation
frequency of a gene. It represents the heat to be diffused from that vertex during the random walk procedure.
Algorithm 1 MEXCOwalk
Input: PPI network G = (V, E), Si for each gene gi, integers total genes, min module size and threshold θ with 0 < θ ≤ 1.
Output: Set of driver modules P.
//1. Weight Assignment with MEX and CO construct Gwby assigning a weight to each gi∈ V, e ∈ E
//2. Edge-Weighted Random Walk
construct Gd by applying weighted-random walk on Gw
//3. Constructing Set of Driver Modules //Initial Candidate Modules
repeat
P= SCC(Gd)
remove Mq∈ P with |Mq| < min module size
remove min-weight edge from Gd
until |S
∀Mq∈PMq| == total genes
//Split-and-extend on Large Modules split size= max∀Gd(Mq)outdeg(Gd(Mq)) for each Mq∈ P with |Mq| > split size do
remove Mqfrom P and let L = {Gd(Mq)}
//Split
while L not empty do
remove Gcfrom L and let v0be max outdegree vertex in Gc
remove IN(v0) from Gcand insert it into lea fqor seedq
for each Mj∈ SCC(Gc) do
insert Mj into one of L, lea fq, or seedq
//Extend
for each Miin lea fqdo
merge Miwith appropriate Mj∈ seedq
formulate it so as to mimic the optimization goal defined in the problem def-inition. One option could be to define the weight solely in terms of the gene pair gi, gj. However such a simple weighting scheme may not be sufficient in
practice, since the co-occurrence of a pair in a module increases the chances of the genes in their neighborhoods to coexist in the same module as well. This is especially important for the contribution of mutual exclusion in the edge-weight, as pairwise mutual exclusion values are almost always close to 1. In or-der to reflect these observations we consior-der an edge-weighting scheme where contribution of mutual exclusion is computed within the vertex neighborhoods. More specifically, let Ne(gi) denote the extended neighborhood of gi, that is
Ne(gi) =S∀(gi,gj)∈Egj∪ {gi}. The contribution of mutual exclusion to the edge
weight, MEXn(gi, gj) is the average of MEX (Ne(gi)) and MEX (Ne(gj)). Thus
the weight of an edge (gi, gj) is defined as,
w(gi, gj) = MEXn(gi, gj) ×CO({gi}) ×CO({gj}).
The contribution of coverage is computed as a product so as to reduce the chances of a single gene with large coverage dominating the weights of incident edges. Furthermore, it allows the algorithm to favor more balanced coverages among equal-sized modules; coverage of 100 patients with a module containing a pair of genes, one covering 99 and the other only 1, is less preferable than a module with a pair where each gene covers 50 patients. Finally we note that, to further strengthen the impact of mutual exclusion on edge-weights, we intro-duce a threshold θ , so that for pairs with MEXnscore less than θ , edge weights
are assigned to 0.
3.1.2.2. Edge-Weighted Random Walk
Once Gwis constructed after vertex and edge weight assignments, we apply an
insulated heat diffusion process on Gw that can also be described as a random
walk with restart on the graph. The random walk starts from a gene gs. At each
time step, with probability 1 − β , the random surfer follows one of the edges incident on the current node with probability proportional to the edge weights.
is called the restart probability. The transition matrix that corresponds to this process is defined as follows:
Ti j = w(gi,gj) ∑kw(gk,gj), if (gi, gj) ∈ E 0, otherwise
Ti j can be interpreted as the probability that a simple random walk will transi-tion from gjto gi. The random walk process can then be described as a network
propagation process by the equation, Ft+1= (1 − β )T Ft+ β F0, where Ft is the
distribution of walkers after t steps and F0 is the diagonal matrix with initial
heat values, that is F0[i, i] = CO(gi). One strategy to compute the final
distri-bution of the walk is to run the propagation function iteratively for increasing t values until Ft+1 converges [26]. Another strategy, which we chose to employ
in our implementation, is to solve this system numerically using the equation, F= β (I − (1 − β )T )−1F0 [17]. The edge-weighted directed graph Gd is con-structed by creating directed edge [gi, gj] with weight F[i, j], for every pair i 6= j.
We note that the idea of random walks with restart has been employed in the context of cancer module identification in previous work [16, 17, 27, 28, 18]. However as the concept of edge weights is absent, the transition probabilities in those studies are only based on the degrees of the vertices. In our case, the transition probabilities reflect the edge weights which in turn model the contribution of a pair of genes to the maximization score, when placed in the same module. Similar to the previous methods employing heat diffusion we assign β = 0.4.
3.1.2.3. Constructing Set of Driver Modules
We have two main steps. We employ strongly connected components (SCC) as a primitive in both of the steps, similar to Hotnet2 and Hierarchical Hot-net. We first create an initial set of candidate modules. For this, we iteratively remove the smallest weight edge from Gd, add the strongly connected compo-nents (SCC) of Gdinto initial module set P, and remove all modules of size less
than min module size from P, until the total number of genes in P decreases to total genes.
Next we process large candidate modules via a split-and-extend procedure, where large modules to be thus processed are determined by a network prop-erty of the initial modules. We define the split size to be the outdegree of any vertex in any of the subgraphs induced by the modules. Any initial candidate module Mq of size greater than the split size goes through the split-and-extend
procedure.
The idea is to first extract seed modules that satisfy certain size and connec-tivity criteria, and extend them with small leaf modules. Given a directed graph Gc, let IN(v0) denote the isolated neighborhood of v0in Gc, that is w ∈ IN(v0), if
and only if w ∈ Ne(v0) and for any directed edge [w, x] or [x, w], x ∈ Ne(v0). The
split phase of a module Mqconsists of removing IN(v0) from Gd(Mq), where v0
is the vertex with largest degree in Gd(Mq). Assuming its size is not less than
min module size, IN(v0) is a seed module to be extended in the next phase, oth-erwise it is a leaf module that is to be attached to an appropriate seed module. The remainder of Gd(Mq) goes through a SCC partitioning. Any resulting
com-ponent of size larger than the split size goes through the same split process, any component of size less than min module size becomes a leaf module, and any other component in between these two sizes becomes a seed module. In the extend phase, each leaf module is merged with the seed module with which it has maximum number of connections in Gd(Mq).
We note that the graph Gd and the original PPI network G may differ, even when we consider the undirected version of Gd for comparison. Since the
de-cisions made by the module construction step described in this subsection are based on the connections in Gd, it should be noted that the extracted modules
may not exactly satisfy Constraint 1, that is the connectivity constraint of our main problem. However this should be considered a benefit rather than a draw-back. It is well-known that PPI networks are incomplete and contain many
solely on network topology have been suggested previously. Many such meth-ods are unsurprisingly based on random walks and have been shown to perform quite well on PPI networks including those of the H.Sapiens [29, 30]. Thus the directed graph Gd, especially after dilutions via minimum weight edge
re-movals, not only embeds mutual exclusion and coverage information as relevant to cancer module identification, but also is indirectly a smoothed version of the original PPI network G.
3.2. Results
We implemented the MEXCOWalk algorithm in Python. We compare MEXCOWalk results against those of three other existing knowledge-based cancer driver module identi-fication methods: Hotnet2 [17], MEMCover [22], and Hierarchical Hotnet [18]. The first two benchmark algorithms are chosen as representatives of their respective subcategories; Hotnet2 is one of the most popular benchmark methods based on optimizing coverage via a heat-diffusion heuristic and MEMCover is a popular algorithm among those optimizing mutual exclusion as well as coverage via a greedy seed-and-growth heuristic. Hierarchi-cal Hotnet is chosen as a third benchmark method, as it is one of the most recent cancer driver module identification methods.
3.2.1. Input Data
All four methods, including MEXCOWalk, assume same type of input data in the form of mutation data of available samples and a H.Sapiens PPI network. We employ so-matic aberration data from TCGA, preprocessed and provided by [17]. The preprocessing step includes the removal of hypermutated samples and genes with low expression in all tumor types. After the filtering, the dataset contains somatic aberrations for 11,565 genes in 3,110 samples. The mutation frequency of a gene giis calculated as the number of
sam-ples with at least one single nucleotide variation (SNV) or copy number alteration (CNA) in gi divided by the number of all samples. As for the H.Sapiens PPI network, we used
the HINT+HI2012 network [17]. This is a combination of two interactome databases: HI-2012 prepublication data in human HI2 Interactome database2 (HI2012) [31] and high quality interactomes database (HINT) [32]. We execute each of the four algorithms on the largest connected component of this combined network that consists of 40,704 inter-actions among 9,858 proteins.
3.2.2. Parameter Settings
Regarding MEXCOWalk, we have settings for three parameters: the mutual exclu-sion threshold θ , the total genes, and the min module size. We examine the distribution of MEXn scores of all edges to determine a meaningful range of values for the mutual
exclusion score threshold θ and conclude that only settings of θ ≥ 0.5 are in that range. We present results for θ = 0.7, as this setting provides the best results in terms of our main optimization goal defined in Equation 3.1. The results with other threshold values of 0.5, 0.6, 0.8, 0.9 are available in the Supplementary. Regarding the total genes pa-rameter, within the scope of the evaluations discussed in the main document, we view it as the main independent variable; we obtain the results of each evaluation under the settings total genes = 100, 200, . . . , 2500. Finally, we set min module size to 3 for the results discussed in the main document, as this constitutes a nontrivial mimimum module size compatible with the problem definition. Further results applying to the settings of min module size= 6, 9, 12 are presented in the Supplementary Document.
For Hotnet2, we obtain results for varying values of total genes = 100, 200, . . . , 2500, with the default value of min module size = 3. We present results of Hierarchical Hotnet with the default setting of its clustering parameter δ , which outputs modules of size greater than one, with a total of 806 genes. Since some of these modules may contain modules with two genes, we generate a filtered version as well, where all such modules are removed, resulting in modules with a total of 554 genes. In what follows, we refer to the former version as HierHotnet v1 and the latter version as HierHotnet v2.
For MEMCover, mutual exclusion scores are obtained from type-restricted permutation test with all pan-cancer samples, that is the TR test. Because confidence scores are not available for HINT + HI2012 network, we set the confidence score of all edges to 1 when calculating the edge weights for the MEMCover model. We set the coverage parameter k to its default value of 15. MEMCover introduces a parameter, f (θ ), that is used to control the trade-off between the output number of modules and the average weights within each module. It indirectly controls the module sizes; the smaller f (θ ), the larger the modules output by MEMCover in general. We consider three settings for the MEMCover algo-rithm, referred to as MEMCover v1, MEMCover v2, and MEMCover v3, respectively.
For the first one, we assign f (θ ) = 0.584, which is achieved by setting θ parameter (not to be confused with the θ we employ in MEXCOWalk) to 40%, as recommended in the original paper. For the second one, we assign f (θ ) = 0.03, which is the setting that min-imizes the percentage of size one and size two modules. Finally, the last one corresponds to the setting where f (θ ) = 0.03 and all modules of size < 3 are removed. To obtain re-sults with varying total genes from 100 to 2500 we consider the modules formed by the first total genes many genes output by each version, since the order MEMCover outputs the modules reflects the algorithm’s quality preferences. Values of total genes larger than 1600 are not available for MEMCover v3 as it outputs 1684 genes in total.
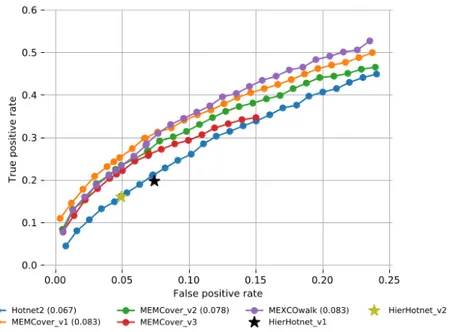
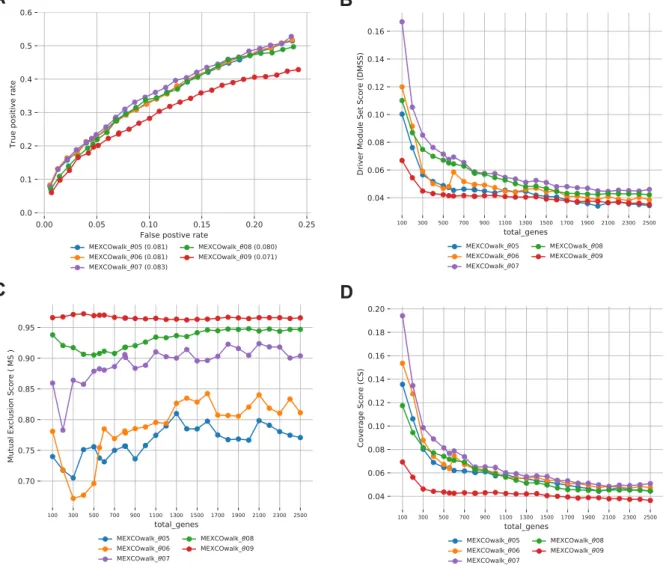
Figure 3.1: The fraction of recovered CGC genes for each total genes value is shown with a ROC plot. AUROC values are written in parentheses for each applicable method.
3.2.3. Static Evaluations
Most of the existing driver module identification methods employ static evaluations, where the union of the genes in all the modules are compared against a reference set of cancer genes. Such evaluations measure the capability of an algorithm in dissecting cancer-related genes throughout the modules it provides, without regard for the specific modularity of the output. COSMIC Cancer Gene Census (CGC) database [33] is one such reference containing 616 genes with mutations that have been causally implicated in cancer. For consistency with previous work, our first evaluation compares the algorithms
based on their ability to recover these known cancer genes. Figure3.1plots the Receiver Operating Characteristic (ROC) curves of the set of genes in the union of modules each algorithm provides with respect to the CGC genes. MEMCover v1 and our model has the same Area Under the ROC (AUROC) value of 0.083. MEMCover v2 ranks the third. Although the areas are not comparable, MEMCover v3 outputs provide worse TP rates than those of MEMCover v2. Finally, Hotnet2 and Hierarchical Hotnet recover fewer known cancer genes than the rest of the methods.
3.2.4. Modular Evaluations
Most cancer driver module identification studies evaluate their output modules via analysis methods including functional enrichment, survival analysis, or literature verifi-cation. However in general these evaluations are not systematic due to lack of evaluation metrics that quantify these types of analysis and as such are not amenable for comparisons among alternatives. Without such metrics it is not possible to provide a fair judgment of different methods as far as the quality of the modules is of concern, and not just the quality of the static gene set. We provide three modularity-based metrics and evaluate the output module sets of alternative methods based on these metrics.
3.2.4.1. Driver Module Set Score
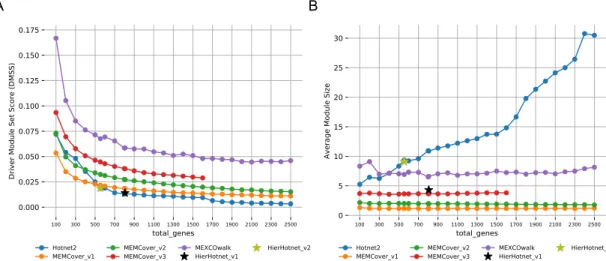
Our first evaluation metric is the main optimization goal of the cancer driver module identification problem, that is the driver module set scores (DMSS) de-fined in Equation3.1. Fig. 3.2-A shows that MEXCoWalk discovers modules that have better DMSS values than the module sets of all the other methods. The difference is much more dramatic for smaller total genes values such as 100 and 200. Those of Hierarchical Hotnet and Hotnet2 are among the worst, especially for settings of total genes > 500. MEMCover v1 performs worse than the two other MEMCover versions, as it provides many size 1 and size 2 modules. This finding demonstrates another merit of the DMSS definition; if there are many small modules, assuming the mutual exclusion does not de-crease substantially by enlarging the modules, then our optimization score func-tion prefers outputs with larger modules. Consider for instance, the following
A B
Figure 3.2: A) DMSS evaluations of output modules of MEXCOwalk, MEMCover, Hotnet2, and Hierarchical Hotnet for increasing values of total genes. B) Average modules sizes in the outputs of MEXCOwalk, MEMCover, Hotnet2, and Hierarchical
Hotnet for increasing values of total genes.
of a total of y samples. The output consisting of a set of modules each contain-ing one gene has a DMSS of x/y. On the other hand, assumcontain-ing a MEX score of m for every pair of genes, the output with any pair of genes per module has a DMSS of 2m2x/y. This implies that the latter is a more preferable module set than the former, as long as m >p1/2. It corresponds to the case where upto almost 58% of samples covered by a gene to be in the intersection of samples covered by another gene.
Analyzing the outputs of the methods with respect to the average module sizes in Fig.3.2-B, we can observe that all MEMCover versions, especially v1 and v2, provide module sets with very small average module sizes; for almost all values of total genes, MEMCover v1 provides an average size of almost 1.2 genes per module, MEMCover v2 provides an average of almost 1.9 genes per module, and MEMCover v3 provides an average of almost 3.7 per mod-ule. MEXCOWalk provides module sets with average sizes ranging between 6.5 and 9, whereas Hotnet2 module sizes significantly increase proportional to total genes. The range of average module size values for Hotnet2 is approxi-mately between 5 and 30.
A B
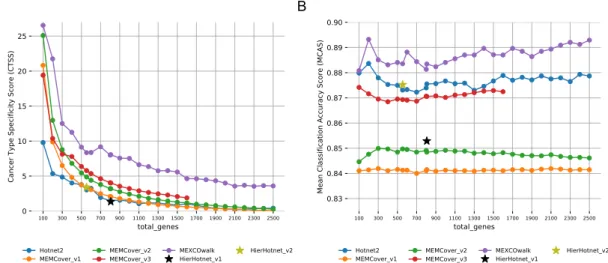
Figure 3.3: A) CTSS evaluations of output modules of MEXCOwalk, MEMCover, Hotnet2, and Hierarchical Hotnet for increasing values of total genes. B) MCAS evaluations of output modules of MEXCOwalk, MEMCover, Hotnet2, and Hierarchical
Hotnet for increasing values of total genes.
Our second modularity-based evaluation metric is defined with respect to cancer type specificity. We test an output module set in terms of enrichment for muta-tions in a specific cancer type using Fisher’s exact test. For a module M, let SM
denote the set of patients where at least one of the genes in M is mutated. For a cancer type t, let SMt denote the subset of patients in SMdiagnosed with cancer
type t. Assuming ntdenotes the number of patients of cancer type t in the whole
dataset, we calculate the Fisher’s exact test with the following entries in the con-tingency table in row-major order:|SMt|, nt− |SMt|, ∑t06=t|SMt
0
|,∑t06=tnt0− |SMt 0
|. We use the Bonferroni method for multiple testing correction.
Let P = {M1, M2, . . . Mr} be a set of modules. For each module Mq∈ P, the
described process results in a p-value for every cancer type t, denoted with pqt.
We define the cancer type specificity score of P as the average − log of best p-value per module. More formally,
CT SS(P) =∑Mq∈P− log(min∀t(pq
t))
Fig.3.3-A shows the CTSS scores of the module sets provided by the meth-ods under consideration. Compared to the other methmeth-ods, MEXCOWalk pro-vides a larger CTSS value for every setting of total genes, indicating that the output modules are strongly enriched for particular cancer types. We also ob-serve that module sets of MEMCover versions perform better than those of Hotnet2 and Hierarchical Hotnet.
3.2.4.3. Mean Classification Accuracy Score
We examine the predictive value of an output set of modules in classifying tumor and normal samples of TCGA pan-cancer data consisting of 12 cancer types. For this, we employ k-nearest-neighbor classifier using Euclidean dis-tance with k = 1, where the features are the expression values of the set of genes in a module. To evaluate the predictive performance of a module Mq, we
use 10-fold stratified cross-validation accuracy, denoting it with Acc(Mq, c) for
a fold c. We can then define the Mean Classification Accuracy Score of a set of modules P as,
MCAS(P) = ∑Mq∈P∑
10
c=1Acc(Mq, c)
10 × r (3.3)
The plots of the MCAS scores of the module sets of all four methods for varying total genes are provided in t Fig. 3.3-B. MEXCOwalk consistently achieves the top accuracy for all settings of total genes, implying that MEX-COwalk modules can more accurately perform tumor/normal classification than the other methods. Interestingly, Hierarchical Hotnet performs worse than Hot-net2. Among MEMCover models, MEMCover v3 shows a better performance than MEMCover v1 and MEMCover v2, in contrast to their relative perfor-mances in recovering known cancer genes.
3.3. Analysis of MEXCOWalk Modules
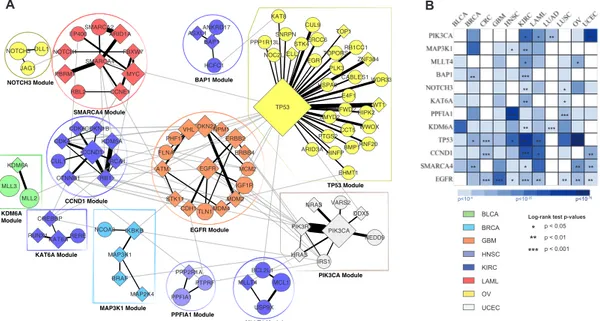
Fig.3.4-A shows the 12 modules that MEXCOWalk identifies when total genes is set to 100. The sizes of the modules range between 3 and 31, and their coverage values range between 5% to 50%. Note that the edges correspond to the PPI network edges, whereas
the weight of an edge is the smaller of the weights of the corresponding directed edges from Gdas computed through edge-weighted random walk and thus represents the degree
of mutual exclusivity and coverage assigned by MEXCOWalk.
BLCA BRCA GBM HNSC KIRC LAML OV UCEC p < 0.05 p < 0.01 p < 0.001 *** ***
Log-rank test p-values
B * * ** * * * ** ** ** ** ** ** ** ** ** ** ** ** ** *** *** *** *** *** *** *** *** *** *** *** *** ** * * * * * * * * * p<10-70 p<10-25 p<10-4 PIK3CA DDX5 NRAS PIK3R1 IRS1 EHMT1 NEDD9 HRAS VARS2 IGF1R ATM TLN1 RB1 STK11 MCM2 CDH1 EGFR MDM2 MDM4 BRCA1 PPP2R1A USP9X MLLT4 BCL2L1 PPFIA1 MCL1 PTPRF MLL3 CTNNB1 RERE MLL2 RUNX1 KDM6A KAT6A CREBBP CUL1 MAP2K4 IKBKB NCOA3 MAP3K1 BRAF BMP1 HIPK2 HINFP ARID3A PTGS2CCT5 SMYD2RFWD2 WWOX RNF20 TP53 EGR1 ELL NOC2L STK4ERCC6 CUL9 KAT8 RBL2 DLL1 JAG1 EP400 NOTCH3 CDK6 NOTCH1 PBRM1 CDK4 WT1 TOP1 PLK3 CABLES1 HSPA9 WDR33 RB1CC1 ZNF384 TOPORS E4F1 CDKN2A ERBB4 PHF17VHL NPM1ERBB2 FLNA MYC ARID1A SMARCA2 SMARCA4 FBXW7 CCND1 CCNE1 KDM5A CDKN1B HCFC1 ASXL1 PPP1R13LSNRPN ANKRD17 BAP1 NOTCH3 Module CCND1 Module EGFR Module PIK3CA Module SMARCA4 Module KAT6A Module KDM6A Module MAP3K1 Module PPFIA1 Module MLLT4 Module BAP1 Module TP53 Module A
Figure 3.4: A) MEXCOWalk output modules when total genes = 100. Diamond shaped nodes correspond to CGC genes. Sizes of the nodes are proportional with mutation frequencies of corresponding genes. Edges within the module are colored black, whereas the edges between the modules are colored. Edge weights are reflected in the thicknesses
of the line segments. Color of a module denotes the cancer type with the strongest enrichment for mutations in genes of that module. The legend for the color codes are shown on the right. Each module is named with the largest degree gene in the module. B) Results of cancer type specificity and survival analyses. Rows correspond to modules
and columns correspond to cancer types. Colors of the matrix entries indicate the significance of enrichment for cancer types in terms of Fisher’s exact test p-values. Stars
indicate the significance of log-rank test p-values in survival analyses.
Many of these modules are part of well known cancer-related pathways such as those centered at EGFR, TP53, PIK3CA, and CCND1. Analyzing the interactions between the modules, EGFR module can be seen as an important hub module between many important modules such as the TP53 module, CCND1 module, and the PIK3CA module; without the EGFR module these three modules would almost be isolated in the induced subgraph. The EGFR module contains several known cancer genes many of which are related to cell cycle control: VHL, CDKN2A, NPM1, ERBB2, ERBB4, MDM2, MDM4, STK11, CDH1, ATM. Seven cancer types are enriched for mutations in this module with GBM being the most significant enrichment; Fisher’s exact test p-value is = 4.9e − 20. Indeed,
already used for GBM treatment [34]. However, resistance to these agents is a major problem suggesting that treatment strategies might benefit from targeting multiple genes in this module. This module also contains TLN1, which is not one of the known cancer genes listed in CGC. However it is mutated in 104 patients across 10 cancer types and it has previously been associated with tumorigenecity and chemosensitivity [35, 36]. We investigate whether the genes in this module are predictive of patient survival profiles by calculating a risk score for each patient as in [37] and [38]. When we divide the GBM patients into two as training and test sets, the low-risk and high-risk thresholds that we identify from the training set are successful in stratifying the patients into low-risk and high-risk groups in the test set; the log-rank test p-value= 0.0004 (Fig.3.4-B).
Our TP53 module includes 30 interactors out of 213 available in the HINT+HI2012 PPI network. TP53 shares the highest edge weight with WT1, which is a transcription factor that has roles in cellular development and cell survival. Another gene which has a large edge weight is CUL9. It is altered in 48 patients out of a total of 3110 samples, which would possibly make it easy to miss through single-gene tests.
The PIK3CA module identifies several genes in the PI3K pathway whose deregulation is critical in cancer development and progression [39]. The module provides a chance to observe the importance of incorporating mutual exclusion in MEXCOWalk. Among all the interactions presented in the induced subgraph of 100 genes in all 12 modules, the one between PIK3CA and PIK3R has the largest weight. These genes are mutated in 602 and 155 patients respectively, although the overlap between the two patient sets is only 18 indicating the high mutual exclusivity between the pair of genes.
The CCND1 module is yet another fairly known cancer driver module [40, 41]. Other than EGFR, it is the module that contains the most reference genes; all 9 genes in the module, except CUL1, are listed in the reference CGC database. It is shown that the mutations, amplification, and expression changes of these genes, which alter cell cycle progression, are frequently observed in a variety of tumors and contribute to tumorigene-sis [41,40]. Indeed, we find significant association of this module with patients’ survival outcome in CRC, KIRC, LAML and UCEC types (Fig.3.4-B).
random walk to compensate for the incomplete edges in the PPI network data. MLL3 gene does not have interactions with MLL2 and KDM6A in the original PPI network. Nevertheless, the heat diffussion process of MEXCOWalk diffuses a large enough heat due mainly to the network topology, the coverage, and the mutual exclusion values of the pairs. As a result the three genes are connected with large edge weights in Gd, demonstrat-ing the quality of MEXCOWalk modules even with missdemonstrat-ing interaction data, as verified by the the predicted interaction between MLL3 and KDM6A [42].
CHAPTER 4
4. Network Centric Epistasis Evaluation
We provide a description of the overall framework for the network-centric epistasis evaluations and briefly summarize the statistical mutual exclusivity tests under study.
4.1. Methods
The following sections include a detailed description of the methods for network-centric epistatic evaluation.
4.1.1. Problem definition
Statistical mutual exclusivity algorithms employ many different approaches to com-pute pairwise mutual exclusivity. However, a standard approach for evaluation of such methods do not exist. The results from these methods may falsely display a strong mu-tual exclusivity among pairs. To overcome this, we develop a network-centric epistasis evaluation framework based on the pairwise interactions among driver genes.
4.1.2. Network-centric Epistasis Evaluation Framework
The overall framework has two main components. The first one consists of def-initions of statistics and metrics employed in the network-centric epistasis evaluations. Such metrics should properly quantify the gains attained by a network-centric approach of discerning pairwise epistasis relations from among those provided as a result of em-ploying any appropriate pairwise mutual exclusivity test on a given cohort. The second component is inspired by the recent work of [7], where the effects of mutation load asso-ciations on the set of statisticaly significant findings of pairwise mutual exclusivities are
depicted through subtype-stratified analyses. We follow a similar methodology with our network-centric approach to verify whether the use of interactome information provides similar advantages in epistasis corrections of pairwise mutual exclusivity findings as the subtype-stratification idea suggested by [7] .
4.1.3. Metrics for Network-centric Epistasis Evaluations
Assuming that cancer driver genes in the same pathway are more likely to show mutually exclusive mutation profiles, we utilize the interactome to devise a new strategy for evaluating the mutual exclusivity methods and the effects of the interactome informa-tion on quantifying true epistasis. The steps of the evaluainforma-tion framework are described in pseudocode as shown in Algorithm 2. Let G ,C ,T ,c denote respectively the input PPI network, the employed cohort, the statistical mutual exclusivity test undergoing the network-centric epistasis evaluations, and the type of the control group to be employed. Let NCGC(gi) denote the set of CGC genes that are in the neighborhood of the node
cor-responding to gene giin the PPI networkG . Corresponding to each CGC neighbor gj of
the gene gi, we randomly select a gene gr from a control groupXc(gi), and compute 12
statistics, Stat1. . . Stat12, based on the − log-transformed p-values pi, j, pi,r as computed
by the mutual exclusivity test T . To obtain robust results, the selection of the random genes from the control group is repeated 100 times and the median values of these 100 instances are taken into account.
With regard to the computed statistics, Stat1. . . Stat6compare the significance of CGC
gene gi’s mutual exclusivity with a neighbor CGC gene against its mutual exclusivity
with a random gene from the control group. For instance, for each reference CGC gene gi, Stat1 counts the number of instances where a CGC neighbor gene shows significant
mutual exclusivity with gi, whereas a random gene from the control group does not. Stat7
simply sums up the − log-transformed p-values of all CGC gene pairs gi, gjthat are
inter-acting in the PPI network. Stat8 calculates the same sum but the p-values are computed
with respect to the random genes from the control group, rather than the interacting CGC genes. Stat9 computes the number of significantly mutually exclusive CGC gene pairs
Algorithm 2 Network-centric Epistasis Evaluation Input: ≺G ,C ,T ,c
Output: Relevant Statistics of the mutual exclusivity testT ExecuteT on C
px,y: − log transformed p-value of gx, gy as output byT
for each gene giin CGC do
for t = 1 to 100 do for k=1 to 12 do
Ck= 0
for each gene gjin NCGC(gi) do
gr: randomly sampled gene fromXc(gi)
if pi, j> − log(0.05) > pi,rthen C1+= 1
else if pi, j > pi,r> − log(0.05) then C2+= 1
else if pi,r> pi, j > − log(0.05) then C3+= 1
else if − log(0.05) > pi, j> pi,r then C4+= 1
else if − log(0.05) > pi,r> pi, j then C5+= 1
else if pi,r> − log(0.05) > pi, j then C6+= 1
C7+= pi, j
C8+= pi,r
if pi, j> − log(0.05) then C9+= 1
else C10 += 1
if pi,r> − log(0.05) then C11+= 1
else C12 += 1
for k=1 to 12 do Cki = Cik∪Ck
for k=1 to 12 do
Statk+= median(Cki) Output Statk for k = 1 . . . 12
exclusive gene pairs where each gene pair is comprised of a reference CGC gene and a random gene from the control group. The number of such pairs is the same as those con-sidered for Stat9. Finally Stat12 counts the number of pairs found not to be significantly
mutually exclusive among the group of pairs considered for Stat11. Note that based on
the premise that cancer driver genes interacting in the PPI network are likely to exhibit epistasis, Stat9and Stat11, respectively correspond to True Positives and False Positives,
whereas Stat10 and Stat12, respectively correspond to the False Negatives and True
Neg-atives. Thus precision, sensitivity, specificity, and the F1 scores are computed based on these 4 statistics.
For the network-centric epistasis evaluations we employ two different definitions for the control groups. For the first one, the control group X1(gi) consists of CGC genes
that do not interact with gi in the PPI network. For the second one, X2(gi) consists of
neighbors of giin the PPI network that are not in CGC.
4.1.4. Network-centric Epistasis Corrections in Relation to MLA
Some statistical mutual exclusivity tests are based on the assumpton that genes’ alter-ations across tumors are identically distributed. Among the approaches considered in this study Fisher’s Exact Test and MEGSA [25] belong to this category. However it has been observed that the number of alterations per tumor can vary quite considerably, even in tumors of the same type; colorectal tumors with microsatellite stability have a median of 66 non-synonymous mutations, but colorectal tumors with microsatellite instability have a median of 777 mutations [43,24]. It has been shown that under such settings the mutual exclusivity tests relying on identical alteration probabilities across tumors may lead to reduced sensitivity for mutual exclusivity analysis [23]. The effects of varying alteration probabilities on pairwise mutual exclusivity calculations have been formalized within the context of the so-called mutation load confounding (MLC) in a recent study by [7]. MLC is a correlation between the number of statistically significant mutual exclusivity findings and the mutation load association (MLA) of a gene, where logistic regression is used to compute MLA as a standardized score of association between the mutation likelihood of each gene and the mutation load, that is the genome-wide number of somatic muta-tions observed in a tumor. Note that negative MLA values correspond to higher mutation
higher mutation frequencies in tumors with high mutation loads. Strong negative corre-lations between the MLA of a gene and the number of statistically significant pairwise mutual exclusivities have been observed, implicating the finding that the more negative a gene’s MLA, the higher the number of other genes that show mutual exclusivity with that particular gene [7].
However, such a negative correlation does not always imply true epistasis since a gene highly mutated in tumors wih low mutation loads, naturally has a better chance of form-ing mutually exclusive pairs with other genes. Thus extra sources of information are necessary to filter out the pairs with true epistasis relations among a set of statistically significant pairwise mutual exclusivities postulated by some exclusivity test. [7] make use of the subtype information for such a purpose and show that the mutation load con-founding can be reduced by correcting via tumor subtype stratification. Such a correcton greatly reduces the number of gene pairs reported to show mutual exclusivity, especially for pairs that include genes with low MLA. A major drawback is the absence of subtype information for many tumors. As part of our network-centric epistasis framework, we suggest that such a correction can be efficiently done with the interaction network data, rather than or better yet on top of the subtype information. For this purpose we calculate the correlation between the number of statistically significant pairwise mutual exclusiv-ity findings and the MLA for two settings; one where pairwise mutual exclusivities are sought between a CGC gene and all other CGC genes, and the other where a CGC gene is checked against only its PPI neighbors that are in CGC. The computations of the two settings are repeated with the subtype-stratified data as well, to see the added value of the network-centric epistasis corrections on top of the subtype-based corrections on statisti-cally significant pairwise mutual exclusivities.
4.1.5. Relating MLA to Network-centric Epistasis
van de Haar et. al. define Tumor Mutation Load (TML) for a single tumor sample as the sum of all mutations within that sample. They particularly focus on established tumor subtypes and claim that the mutations with low MLA that drive tumor subtypes may high mutual exclusivity and thus show epistatic interactions with a vast majority of other genes within the cohort. In order to display genetic dependencies they calculate a score called ”Mutation Load Association (MLA)” that indicates the strength of association between