TESTING DESTINATION IMAGE SCALE INVARIANCE
AMONG BRITISH, GERMAN AND RUSSIAN TOURISTS:
A MULTIGROUP CONFIRMATORY FACTOR ANALYSIS
Demet CEYLAN
1Antalya Bilim University, Faculty of Tourism, Antalya, Turkey
Beykan ÇİZEL
Akdeniz University, Faculty of Tourism, Antalya, Turkey
ABSTRACT
Researchers agree that destination image is a multi-dimensional and complex structure of attitude. Social psychology suggests that attitudes are composed of affective, cognitive, and conative components. This study contributes to literature with (i) scale development integrating 3 explanatory dimensions of destination image; (ii) utilization of item parceling technique enabling extended depth with sub scales and (iii) by providing supporting evidence with multigroup confirmatory factor analysis that this measurement scale is invariant thus applicable for 3 nationalities namely British, German and Russian tourist. This empirical study provides clarity to number and definition of dimensions with an integrated scale invariant for three nationalities. The survey is carried in summer 2017 at Antalya Airport with a total of 1495 British, German and Russian respondents visiting Antalya region for holiday purposes.
1Address correspondence to Demet Ceylan, Antalya Bilim University, Faculty of Tourism, Antalya, TURKEY. E-mail: [email protected]
Advances in Hospitality and Tourism Research (AHTR)
An International Journal of Akdeniz University Tourism Faculty ISSN: 2147-9100 (Print), 2148-7316 (Online)
Webpage: http://www.ahtrjournal.org/ 2018 Vol. 6 (2) 119-146 Keywords Destination image, Scale development, Multi-group confirmatory factor analysis, Mass tourism Article History Received 30 July 2018 Revised 18 September 2018 Accepted 20 September 2018
INTRODUCTION
Both tourism and hospitality sector decision makers and scholars acknowledge the value and importance of tourist destination’s image and its effects on destination perception, thus consecutive travel decisions (Echtner & Ritchie 1993; Beerli & Martín, 2004a; Bosque & Martín, 2008; Agapito et al., 2013). Destination image consists of information, impressions, ideas, feelings, emotional thoughts, expectations, anticipations and considerations an individual has about a place. (Aktas et al., 2003; Pearce, 2005; Ozdemir et al., 2012; Agapito et al., 2013; Stylos et al., 2017; Gursoy & Chi, 2018). There is ambiguity about number, definition and relation between the dimensions of destination image, since Gartner (1993) has suggested the attribute-based conceptualization of destination image consisting of 3 interrelated dimensions namely: cognitive, affective, and conative (Pike & Ryan, 2004; Baloglu & McCleary, 1999; Beerli & Martín, 2004a, 2004b; Echtner & Ritchie, 1993; Han & Hwang, 2016). Scholars agree on the importance of studying the dimensions of destination image one by one, in order to better understand the complexity of the whole. Michael et al (2018) emphasize that utilizing all three components provides a more nuanced understanding of interrelated contributors of destination image.
The three dimensional model of destination image proposed by Gartner (1993), is also supported by Social Psychologists’ three dimensions of attitude: cognitive, affective and conative (Allport, 1935; Hilgard, 1980; Aranson et al., 2010). Researchers in tourism widely adopted attitude based social psychology research techniques but not many researchers consider all three dimensions of attitude. Besides the limited number of studies covering all three dimensions, the consensus on the definition of conative component is not always reached (Pike, 2004; Echtner & Ritchie, 1993; Pike, 2007; Tasci et al., 2007; Han & Hwang, 2016). Researchers have rarely considered impact of nationality on destination image perception, although the limited research agree that the significance attributed to destinations vary between nationalities (Kozak, 2002; Beerli & Martin, 2004a; Bosque & Martin, 2008; Stylos et al., 2017). This empirical study targets to provide clarity to number and definition of these dimensions with an integrated scale.
Cognition is summation of what is known about destination. In other words, it comprises of knowledge, beliefs and awareness regardless of the amount and depth of information available. Most studies in tourism destination image analyze the cognitive component of destination image
based on physical and tangible attributes or the place (Beerli & Martin, 2004a; Pike & Ryan, 2004; Bosque & Martin, 2008; Stylos et al., 2017). Unlike cognitive component where destination image is a construct of reasoning, affective component is the emotional construct of destination image based on intangible attributes, feelings and emotions about a place. Conative component of image is about how tourist acts using this information and feelings in the form of consideration and willingness to act/react positively towards the destination (Gartner, 1993; Baloglu & McCleary, 1999; Beerli & Martín, 2004a, 2004b; Pike & Ryan, 2004; Bosque & Martín, 2008; Chen & Gursoy, 2001; Han & Hwang, 2016; Michael et al., 2018)
It is crucial to consider inseparable 3 dimensional structure in measuring destination image for a valid and reliable image perception measurement of any destination. The primary aim of this study is to develop and validate an integrated destination image measurement scale covering all three dimensions of destination image construct. Secondary aim is to implement multigroup confirmatory factor analysis to test the invariance of developed scale among three nationalities namely: British, German and Russian to assure wider application of the scale.
Importance of verified scale invariance when measuring destination image perception across nationalities is crucial not only for accuracy of destination image measurement, but also very important for legitimate evaluation of comparative perception differences. Invariance of scale assures that the scale measures the image perception across nationalities indifferently, thus any difference in destination image perception shall be attributed to nationality. Unfortunately, very limited researchers test the invariance of their scale before implementing it across nationalities. The scale development process shall be strictly followed including exploratory factor analysis and confirmatory factor analysis and as a further step to assure scale invariance, multigroup confirmatory factor analysis shall be applied to assure scale invariance. This research study has empirically proven the invariance of scale developed for British, Russian and German tourists and can be utilized by future research in other destinations with confidence.
LITERATURE REVIEW
Understanding the core concept of destination image has attained immense attention by practitioners and academicians in last few years. Analysis of destination image from different perspectives has contributed to a great understanding as how the destination image is formed; the
importance/performance of information sources; the implications of personal factors and motivations; the impact of tourists’ experience and familiarity with destination and/or with similar type of holiday making (Russel & Pratt, 1980; Fayeke & Crompton, 1991; Gartner, 1993; Echtner & Richie, 1993; Baloglu & McClearly, 1999; Baloglu, 2001; Baloglu & Mangaloglu, 2001; Beerli & Martin, 2004a, 2004b; Pike & Ryan, 2004; Agapito et al., 2013; Stylidis et al., 2017; Stylos et al., 2016, 2017; Michael et al., 2018).
Different researchers have described destination image from different perspectives. Russel and Pratt (1980) have tried to reveal the perceptual cognitive and affective meaning of tourist’s attribute to destination. They believed the initial response is affective and thus focused on developing an affective map of qualifications a tourist attributes to a destination. Their study suggested 4 vectors to map the affective positioning of a destination namely: Pleasant-Unpleasant; Relaxing-Distressing; Arousing-Sleepy; Exciting-Gloomy. Fayeke and Crompton (1991) suggest that the tourists who have never been to a destination still have some kind of information about the destination. By actually visiting the destination, tourist will develop a more complex image of it based on personal experience. Gartner (1993) has mainly focused on agents of destination image formation and suggested that destination image has three distinctly different, hierarchically ordered and interrelated dimensions namely: cognitive, affective and conative.
Baloglu and McClearly (1999) focused on destination image formation process affected by personal and stimulus factors, suggesting destination image is an attitudinal construct based on tourist’s representation of knowledge (cognitive), feelings (affective) and holistic (overall) impressions of a destination. Beerli and Martin (2004a; 2004b) have focused on understanding and conceptualizing the relationship between components of destination image. They have utilized semantic differential vectors developed by Russel and Pratt (1980) to measure affective component, but for cognitive component they have developed a comprehensive list of attributes to measure cognitive aspects of destination image. Pike and Ryan (2004) have combined cognitive, affective and conative dimensions of destination image in their study and stated that conative image can be assessed with intention or action due to its behavioral intent. Agapito et al. (2013) have considered three-dimensional structure as suggested by Gartner (1993) and defined conative component with 2 behavioral aspects; intention to revisit the destination; intention to recommend or positive word of mouth promotion
of the destination to others. Stylos et al. (2017) studied impacts of nationality on destination image perception of different nationalities draws attention to negligence of studies about conative component of destination image and emphasizes the interrelation between cognitive-affective-conative components of destination image. Stylidis et al. (2017) have examined the relationship between the cognitive, affective and overall image and distinct effect of each image component on overall image comparing two groups (residents and visitors) with multigroup confirmatory factor analysis.
Limited number of researchers has paid attention to implications of tourists’ country of residence (nationality) on image perception of the holiday destination they prefer (Kozak, 2002; Beerli & Martin, 2004a, 2008; Kozak & Martin, 2012; Stylos et al., 2017). Bosque and Martin (2008) suggest that culture (beliefs, values, habits, ideas and norms of persons) is a factor that could be used to filter the tourists’ perception of a destination. Kozak (2002) conducted his research to determine if motivational differences existed between tourists from the same country visiting two different geographical destinations (Mallorca and Turkey) and across those from two different countries (Germany and UK) visiting the same destination. Stylos et al. (2017) demonstrates that Russian and British tourists visiting Greece have different destination image perceptions of the same destination. Beerli and Martin (2004a) expressed that in order to understand the relationship between tourists' motivations and destination image, researchers must look deeper into tourists' level of experience and socio-demographic characteristics, social class and especially country of origin (German tourists represent 42% and British tourists represent 29% of total sample size of this study). Kozak and Martin (2012) have looked into tourist profiles from Russia and Germany to understand their impressions and intentions about visiting Turkey.
Beerli and Martin (2004a), mainly covering German (42%) and British (29%) in their sample size, have considered place of residence as a socio-demographic characteristic of tourists affecting their destination image perception. Similarly, the results of study by Stylos et al. (2017) covering cognitive, affective and conative dimensions of image perception of Russian and British tourists visiting Greece, confirm that there are significant differences between nationalities. Researchers have rarely considered impact of nationality on destination image perception (Kozak, 2002; Beerli & Martin, 2004a; Stylidis et al., 2017; Stylos et al., 2017). Even more rarely the researchers considered validating invariance of their scale across nationalities before using the scale to measure variances of different
nationalities. This study emphasizes utilization of structured scale development process including confirmation of model invariance across individual nationalities prior to utilizing scale as measurement instrument.
METHODOLOGY
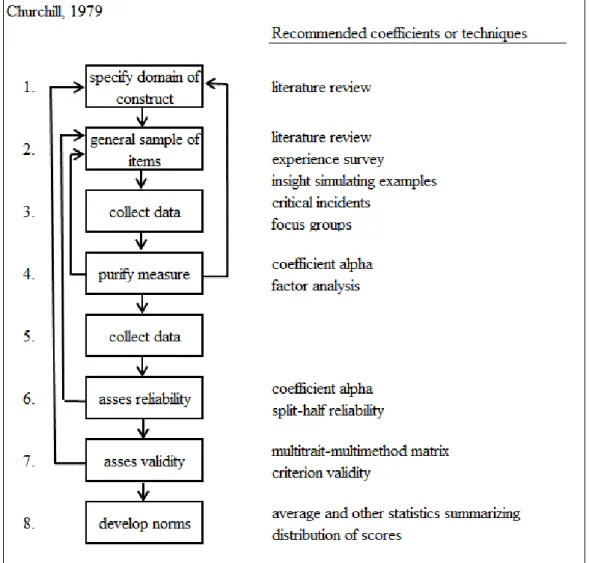
This study started with qualitative content analysis followed by quantitative research methods to develop destination image measurement scale. Scale development steps outlined by Churchill (1979) are used as guideline for developing a measurement scale to measure destination image based on three attitudinal components (cognitive, affective, conative).
Literature on cognitive destination image and attributes to use as measurement criteria is quite rich. The collection of attributes, elimination of duplications has led to development of a list with 90 attributes (Baloglu & McClearly, 1999; Beerli & Martin, 2004a, 2004b; Stylidis et al., 2017). Affective map of qualifications developed by Russel and Pratt (1980) and literature sources are used as the starting point of affective dimension scale development (Russel & Pratt, 1980; Baloglu & Brinberg, 1997; Baloglu & McClearly, 1999; Pike & Ryan, 2004; Stylidis et al., 2017). Unfortunately, conative dimension was almost ignored by most of researchers. However, review of few studies that included this component, led to development of an initial list of 6 items (Pike & Ryan, 2004; Pearce, 2005; Agapito et al., 2013; Stylos et al., 2016, 2017).
Following extensive literature review, the list of attributes was reviewed and scrutinized by an academic council consisting of researchers, faculty members of college of tourism in Antalya Bilim University and Akdeniz University. Following academic council review, the list of attributes was shared with tourism experts from Germany, Russia and UK as well as research department of Frankfurt airport operator FRAPORT. Qualitative interviews with tourism experts have provided deeper insight of the construct. “Don’t know” answer was added to questionnaire to avoid uninformed answers and/or missing data, as suggested by Pike (2007).
The study instrument was tested with two pilot studies. The primary pilot study involved experts from academia and industry, while second pilot study was conducted with 52 German and 58 Russian tourists at Antalya airport. Based on the results of these two pilot studies, the study instrument was purified. The purified study instrument was used for data collection in Antalya Airport between July-October 2017 with 1495 British, German and Russian tourists departing to these source markets. Mall intercept method was utilized to reduce coverage error of data collection. Similar to shopping malls, tourists act in groups in the airport. Research team, consisting of one of the authors of this study and research assistants at Antalya Bilim University, have approached to tourists waiting in the queue for check-in or waiting at the gate for boarding for flights departing to destinations in UK, Russia and Germany. Random sampling error was mitigated by larger sample size (maximum sampling error less than 4,6% for each nationality, 95% confidence, p=q). All data are collected under same conditions where respondents were assured that the participation was voluntary and the results will be anonymous. Tourists who agreed to participate were given a copy of the
questionnaire in their language on a clipboard and a pen to provide their responses on a 7 point Likert scale. Questionnaires typically took approximately 3-4 min to complete.
The data collected was randomly divided into two sub-samples. An exploratory factor analysis (EFA) was conducted on the first sub-sample and the second sub-sample was used to conduct confirmatory factor analysis (CFA) and multigroup confirmatory factor analysis (MGCFA). The validity and reliability of the destination measurement scale was reviewed prior to factor analysis.
RESULTS
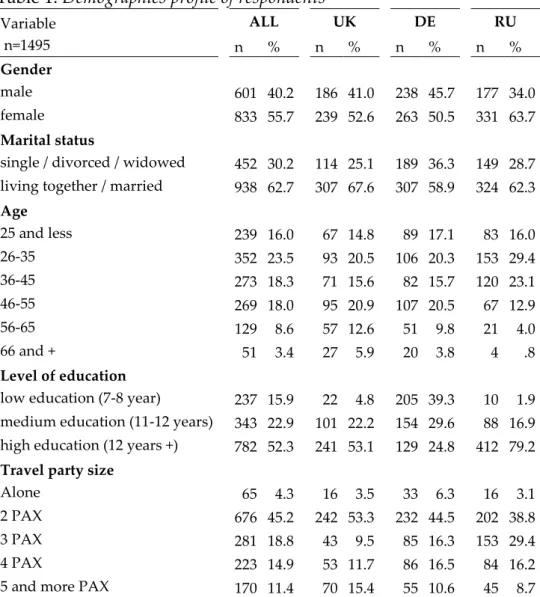
Table 1 summarizes the demographic profile of the main sample.
Table 1. Demographics profile of respondents
Variable ALL UK DE RU n=1495 n % n % n % n % Gender male 601 40.2 186 41.0 238 45.7 177 34.0 female 833 55.7 239 52.6 263 50.5 331 63.7 Marital status
single / divorced / widowed 452 30.2 114 25.1 189 36.3 149 28.7 living together / married 938 62.7 307 67.6 307 58.9 324 62.3
Age 25 and less 239 16.0 67 14.8 89 17.1 83 16.0 26-35 352 23.5 93 20.5 106 20.3 153 29.4 36-45 273 18.3 71 15.6 82 15.7 120 23.1 46-55 269 18.0 95 20.9 107 20.5 67 12.9 56-65 129 8.6 57 12.6 51 9.8 21 4.0 66 and + 51 3.4 27 5.9 20 3.8 4 .8 Level of education
low education (7-8 year) 237 15.9 22 4.8 205 39.3 10 1.9 medium education (11-12 years) 343 22.9 101 22.2 154 29.6 88 16.9 high education (12 years +) 782 52.3 241 53.1 129 24.8 412 79.2
Travel party size
Alone 65 4.3 16 3.5 33 6.3 16 3.1
2 PAX 676 45.2 242 53.3 232 44.5 202 38.8 3 PAX 281 18.8 43 9.5 85 16.3 153 29.4 4 PAX 223 14.9 53 11.7 86 16.5 84 16.2 5 and more PAX 170 11.4 70 15.4 55 10.6 45 8.7
Prior to EFA for cognitive, affective and conative dimensions, content based item parceling technique was used to construct 7 composite variables of cognitive dimension (natural resources, general infrastructure, tourist infrastructure, touristic attractions, economic factors, political factors and social environment). This technique is used in education, communication and psychology and recently Stylidis et al. (2017) have utilized this technique in tourism research for destination image measurement (Hall et al., 1999; Landis et al., 2000). This technique mitigates the potential risk for multicollinearity among indicators and decreases the model complexity, both leading to deterioration of goodness of fit (Bollen, 1989; Hall et al., 1999; Caplan, 2005; Matsugana, 2008; Hair et al., 2014; Stylidis et al., 2017).
Kaiser-Mayer-Olkin (KMO) adequacy of sample size for analysis and correlations between items was calculated as 0.941 which is greater than 0.90 indicating that the data set of n=745 is excellent for exploratory factor analysis (Kaiser, 1974). Bartlett’s test of sphericity tests validity and suitability of the responses indicate that the responses are from populations with equal variances at 95% level of significance (DeVellis, 2003). Reliability was confirmed with Cronbach alpha 0.891 indicating high strength (Cronbach, 1951).
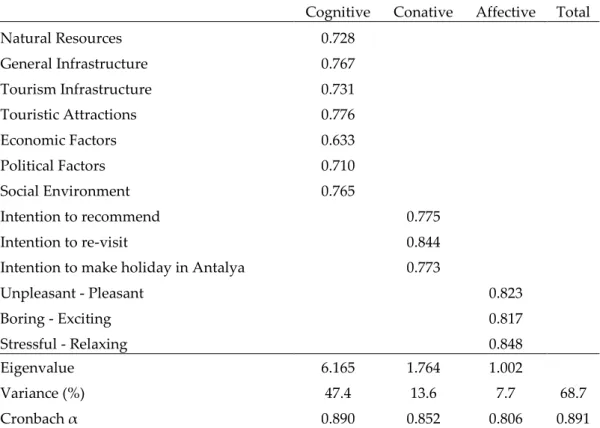
Table 2. EFA Factor structure (n=745)
Cognitive Conative Affective Total
Natural Resources 0.728 General Infrastructure 0.767 Tourism Infrastructure 0.731 Touristic Attractions 0.776 Economic Factors 0.633 Political Factors 0.710 Social Environment 0.765 Intention to recommend 0.775 Intention to re-visit 0.844
Intention to make holiday in Antalya 0.773
Unpleasant - Pleasant 0.823 Boring - Exciting 0.817 Stressful - Relaxing 0.848 Eigenvalue 6.165 1.764 1.002 Variance (%) 47.4 13.6 7.7 68.7 Cronbach α 0.890 0.852 0.806 0.891
Taking 7 cognitive parcels, 3 conative items and 4 affective items, EFA was performed by using principle component analysis and extraction method Eigen value greater than 1 and using varimax rotation. One affective item namely calm/lively was eliminated due to its low communality (0.274) and low correlation (between 0.082 and 0.344) with other items. The EFA conducted after excluding calm/lively affective item explains 68.7% of total variance with 3 dimensions (factors) as presented in Table 2.
Following exploratory factor analysis confirming that the destination image has 3 distinctive constructs such as cognitive, conative and affective, segregated from each other as three pillars of overall destination image; confirmatory factor analysis was conducted with statistical software that is generally used in social sciences to verify EFA results (Aksu et al., 2017).
The second half of 1495 questionnaire data set, consisting of 250 questionnaires from each nationality or 750 questionnaires in total, was used for this confirmatory factor analysis with maximum likelihood method enabling all three dimensions to inter-correlate. Data set has Cronbach alpha of 0.882; KMO value of 0.904 and Bartlet’s test of Sphericity is significant at 95% level confirming excellency of data set for factor analysis.
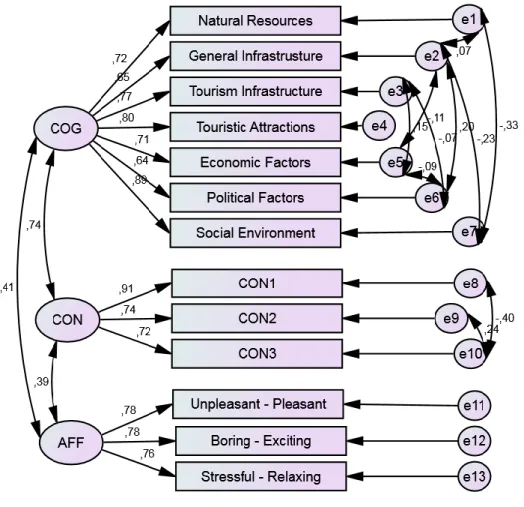
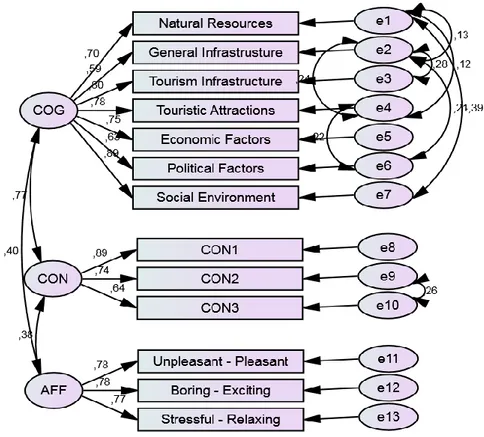
Measurement scale constructed with EFA was confirmed with CFA and all scale items/parcels were kept as is and presented in Figure 2. Measurement properties of 3 dimensional CFA model proposed in figure 2 were assessed by examining the fit indices. CFA Measurement Scale goodness of fit indices presented in Table 3 confirms that the fit between the model and observed data is high as per generally accepted benchmarks of acceptance such as: Chi square / degrees of freedom (CMIN/DF) <5; RMSEA< 0.08; CFI, GFI, NFI>0.90; AGFI> 0.85 (Bollen, 1989; Engel et al., 2003; Byrne, 2004; Schumacker & Lomax, 2004; Awang, 2012; Hair et al., 2014).
Figure 2. CFA measurement model (n=750)
Table 3. Goodness of Fit Indices for CFA model (n=750)
CMIN DF CMIN/DF RMSEA CFI GFI NFI AGFI
105.95 52 2.037 0.037 0.989 0.979 0.979 0.963
Following confirmation of measurement model with CFA, convergent and divergent validity of measurement scale were examined. The convergent validity of each dimension is assured with average variance explained (AVE) substantially greater than 0.50 as presented in Table 4 (Fornell & Larcker, 1981).
Table 4. Measurement properties for destination image measurement scale λ t values α CR AVE COGNITIVE 0.887 0.895 0.553 Natural Resources 0.720 20.94 General Infrastructure 0.647 18.78 Tourism Infrastructure 0.774 25.16 Touristic Attractions 0.798 26.12 Economic Factors 0.708 22.08 Political Factors 0.636 19.09 Social Environment 0.892 28.66 CONATIVE 0.818 0.833 0.628 Intention to recommend 0.905 25.56 Intention to re-visit 0.736 25.13 Intention to make holiday in Antalya 0.723 21.38
AFFECTIVE 0.815 0.817 0.598
Unpleasant - Pleasant 0.779 22.69 Boring - Exciting 0.779 22.75 Stressful - Relaxing 0.762 22.16
Note: Standardized factor loadings are all significant at p<0.01; AVE: average variance explained; CR: composite reliability, α= Cronbach's Alpha Coefficient
Discriminant validity of destination image measurement scale was examined by comparing AVE values vs. squared correlations between pairs of dimensions. The squared correlations were smaller than AVE assuring sufficient discriminant validity of measurement scale.
The purpose of this study is to develop and test an integrated measurement scale of destination image for 3 nationalities. MGCFA is considered as the most appropriate method to test for the reliability and validity (convergent, discriminant) of the study's latent constructs (cognitive, conative and affective image components) and to confirm model invariance across individual nationalities (Jöreskog, 1971; Vanderberg & Lance, 2000; Byrne, 2004). In order to assess measurement invariance, multi-group confirmatory factor analysis compares an unconstrained model to observed structure. Nested models are organized in a hierarchical ordering with decreasing numbers of parameters (or increasing degrees of freedom), which entails adding parameter constraints one at a time. These increasingly restrictive models are tested in terms of their fit of the data to the model. The MGCFA studies the invariance of measuring instrument developed and the latent constructs
by (1) configural invariance, (2) invariance in factor covariance and (3) invariance of factor loading pattern (Jöreskog, 1971; Vanderberg & Lance, 2000; Byrne, 2004; Hair et al., 2014).
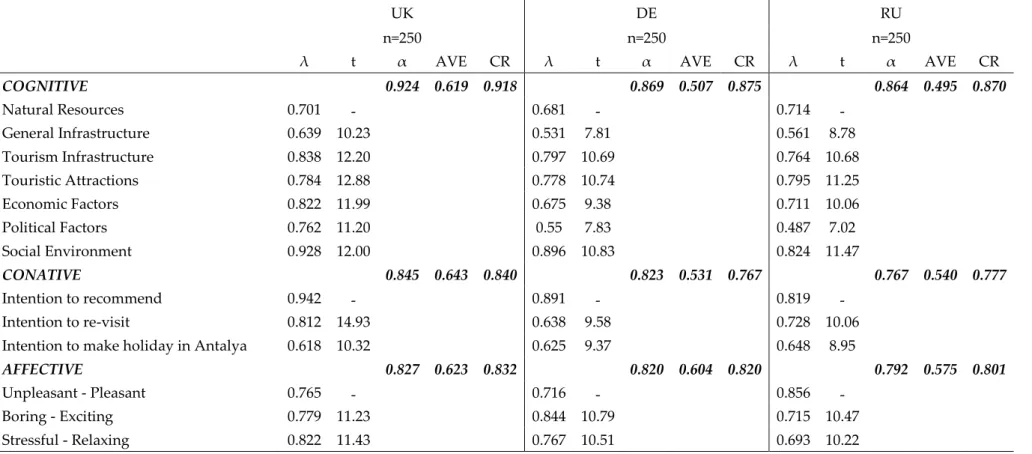
Figure 3. Multigroup CFA measurement model (n=750)
MGCFA is accepted to be the most powerful and versatile approach for testing measurement invariance in order to cross-validate the three-factor model across these three nationalities.
The fit indices presented in Table 6 confirms that the configural invariance of factorial structure is invariant for all three nationalities as all parameters of goodness of fit indices in each model confirms excellent fit values of CMIN/DF<5; RMSEA < 0.08; 0.90 <CFI, GFI, NFI; 0.85 <AGFI (Bollen, 1989; Engel et al., 2003; Byrne, 2004; Schumacker & Lomax, 2004; Awang, 2012; Miyamoto & Iwasaki, 2013; Hair et al., 2014; Hirschfeld & von Brachel, 2014).
Table 5. Descriptive statistics and correlations
n=750 M SD COG CON AFF
COG 5.595 0.839 1.000
CON 5.609 1.345 0.630 1.000
AFF 5.388 1.287 0.344 0.320 1.000
Factor covariance invariance metric test is the last step of confirmation for MGCFA. Metric invariance is assured with equivalence of factor loadings across 3 nationalities as presented in Table 7. Please take note that although the pattern of loading is same across all nationalities, each individual nationality has its own loading estimate. (Vanderberg & Lance, 2000; Hair et al., 2014). Correlation matrix in Table 6 confirms that each dimension is distinctly different from each other as the squared correlation is less than 0.397 as presented in Table 5 whereas AVE values for all three nationalities presented in Table 7 are greater than 0.495 which is evidence for discriminant validity for MGCFA.
Table 6. MGCFA Goodness of Fit Indices
MGCFA CMIN DF CMIN/DF RMSEA CFI GFI NFI AGFI Unconstrained 236.7 162 1.461 0.025 0.985 0.953 0.955 0.922 Measurement weights 291.0 182 1.599 0.028 0.978 0.944 0.945 0.916 Structural covariance 365.9 194 1.886 0.034 0.966 0.929 0.931 0.900 Measurement residuals 515.0 220 2.341 0.042 0.942 0.903 0.902 0.880
Table 7. MGCFA Measurement properties for destination image measurement scale
UK DE RU
n=250 n=250 n=250
λ t α AVE CR λ t α AVE CR λ t α AVE CR
COGNITIVE 0.924 0.619 0.918 0.869 0.507 0.875 0.864 0.495 0.870 Natural Resources 0.701 - 0.681 - 0.714 - General Infrastructure 0.639 10.23 0.531 7.81 0.561 8.78 Tourism Infrastructure 0.838 12.20 0.797 10.69 0.764 10.68 Touristic Attractions 0.784 12.88 0.778 10.74 0.795 11.25 Economic Factors 0.822 11.99 0.675 9.38 0.711 10.06 Political Factors 0.762 11.20 0.55 7.83 0.487 7.02 Social Environment 0.928 12.00 0.896 10.83 0.824 11.47 CONATIVE 0.845 0.643 0.840 0.823 0.531 0.767 0.767 0.540 0.777 Intention to recommend 0.942 - 0.891 - 0.819 - Intention to re-visit 0.812 14.93 0.638 9.58 0.728 10.06
Intention to make holiday in Antalya 0.618 10.32 0.625 9.37 0.648 8.95
AFFECTIVE 0.827 0.623 0.832 0.820 0.604 0.820 0.792 0.575 0.801
Unpleasant - Pleasant 0.765 - 0.716 - 0.856 -
Boring - Exciting 0.779 11.23 0.844 10.79 0.715 10.47
DISCUSSIONS AND IMPLICATIONS
This study is based on the social psychology theory that image is an attitude and attitude has three dimensions (cognitive, affective and conative). In line with social psychology theory, measurement scale integrates all three components and measurement scale is invariant for nationality differences. The result of this study provides empirical evidence that target of developing an integrated destination image measurement scale invariant to German, Russian and British nationalities is achieved.
This study demonstrates that (i) destination image is three dimensional, namely cognitive, conative and affective, (ii) utilization of item parceling technique enables extended depth with sub scales, and (iii) integrated measurement scale is confirmed with MGCFA assuring measurement invariance for tourists from three different source markets namely, British, German and Russian. Findings of this research and analysis methods used provide valuable insights to destination image literature and casts light on the path for future researchers.
The three dimensional structure of destination image provides holistic coverage of the attitude. Hilgard (1980) emphasizes inseparable nature of three dimensions of attitude in the study “Triology of Mind”. Similarly, Allport (1935) describes three dimensional structure of attitude as a whole. Leaving one dimension outside the scope or placing one dimension as end result rather than explanatory factor of destination image distorts the concept and can provide misleading measurement results and/or misinterpreted results. It is utmost important to cover all dimensions of attitude to measure destination image in order to achieve accurate results and their legitimate evaluation.
The scales developed without invariance test across groups are useful for measuring destination image perception of a homogenous group of respondents. But when a differentiating factor like nationality or place of residence is introduced as parameter, scale invariance becomes crucial for not only measurement accuracy but also legitimate evaluation of comparative differences across groups. Establishment of measurement invariance is prerequisite for conducting group comparisons (Vanderberg & Lance, 2000; Byrne, 2004). This scale has been confirmed to be invariant with empirical evidence for three nationalities enabling future researchers to utilize this scale with confidence. Bearing a holistic and integrated approach, utilization of structured methods of scale development and
confirmation of model invariance across nationalities brings this study to attention of scholars studying tourism destination image.
From hospitality industry practitioners’ and DMO’s point of view, this study clarifies the confusion and assures the framework on how to measure and comparatively understand destinations’ image from different nationalities’ point of view, which significantly affects the competitiveness of a destination’s position. It is important to note that hospitality sector practitioners should utilize all three components of destination image formation namely cognitive, affective and conative to have full scope of understanding. Although former studies partly or completely omitted conative component, this study demonstrates that conative component has the highest correlation rate with cognitive component. Taking mean scores of cognitive (5.595), conative (5.609) and affective (5.388) components out of Likert 7 scale; this study demonstrates that all three nationalities share significant positive destination image of Antalya as tourist destination.
LIMITATIONS AND FUTURE RESEARCH
This research was conducted at the airport with self-administered questionnaires bearing LK7 type questions in respective languages of the source markets during July-October 2017 with British, German and Russian tourists. Airports are known to bear several physical and psychological stress factors. The answer bias shall be tested under the light of (1) flight stress, (2) end of holiday depression, (3) fatigue of last day packing shall be tested by using the same questionnaire at hotels and touristic attractions to eliminate answering biases (if any) associated with airport/flight and going back to routine life in home country.
Antalya is located on south coastline of Turkey. Passenger traffic is highly seasonal and mainly between 1 April – 31 October. Dominating concept is all inclusive package tours. Sand, Sea, Sun (3S) tourism is the primary concept used for marketing of this destination. Antalya is mainly a mass resort tourism destination. The model and questionnaire of this research should be used with precaution for city destinations and free individual traveler destinations.
Current coverage of research includes British (non-continental European), German (central continental European) and Russia (north Eurasia) source markets. This coverage can be expanded to eastern, southeastern source markets and can also be implemented to domestic
tourist and test how further the coverage of developed measurement scale can be enlarged.
ACKNOWLEDGEMENT
Summary of this article is presented at 10th World Conference for Graduate Research in Tourism Hospitality and Leisure organized by Anatolia Journal. We would like to extend our thanks to organizers and jury of the conference for the "Outstanding Master’s Thesis Award" granted to our study.
We would like to take the opportunity to thank Antalya Airport Terminal Management Company and Frankfurt Airport Operator company FRAPORT for their non-monetary support and to Antalya Bilim University for field researcher man-power support.
REFERENCES
Agapito, D., Valle, P. O., & Mendes, J. C. (2013). The cognitive-affective-conative model of destination image: A confirmatory analysis. Journal of Travel & Tourism Marketing,
30(5), 471-481.
Aksu, G., Eser, M. T., & Güzeller, C. (2017). Açımlayıcı ve doğrulayıcı faktör analizi ile yapısal eşitlik modeli uygulamaları (Structural Equation Model Applications with Exploratory and Confirmatory factor Analysis). Ankara: Detay Yayıncılık.
Aktas, A., Aksu, A. A., & Cizel, B. (2003). Tourist profile research: Antalya region example 2001. Tourism Review, 58(1), 34–40.
Allport, G. W. (1935). Attitudes. In C. Murchison (Ed.), A Handbook of Social Psychology (pp. 798–844). Worcester, MA: Clark University Press.
Aranson, E., Wilson, T. D., & Akert, R. M. (2010). Sosyal Psikoloji (Social Psychology, translated by O. Gündüz). İstanbul: Kaktüs publications.
Awang, Z. (2012). Structural equation modeling using AMOS graphic. Kota Baharu. UITM Press.
Baloglu, S. (2001). Image variations of Turkey by familiarity index: Informational and experiential dimensions. Tourism Management, 22, 127-133.
Baloglu, S., & Brinberg, D. (1997). Affective images of tourism destinations. Journal of
Travel Research, 35(4), 11-15.
Baloglu, S., & McClearly, K. W. (1999). A model of destination image formation. Annals of
Tourism Research, 26(4): 868-897
Baloglu, S., & Mangaloglu, M. (2001). Tourism Destination Images of Turkey, Egypt, Greece, and Italy as Perceived by US-Based Tour Operators and Travel Agents.
Tourism Management, 22, 1-9.
Beerli, A., & Martin, J. D. (2004a). Tourists’ characteristics and the perceived image of tourist destinations: A quantitative analysis—a case study of Lanzarote, Spain.
Tourism Management, 25(5), 623-636.
Beerli, A., & Martin, J. D. (2004b). Factors influencing destination image. Annals of
Bollen, K. A. (1989). Structural equations with latent variables. NY: Wiley.
Bosque, I. R., & Martin, H. S. (2008). Tourist Satisfaction: A cognitive-affective model.
Annals of Tourism Research, 35(2), 551-573.
Byrne, B. M. (2004). Testing for multigroup invariance using AMOS Graphics: A road less traveled. Structural Equation Modeling: A Multidisciplinary Journal, 11(2), 272-300. Caplan, S. E. (2005). A social skill account of problematic internet use. Journal of
Communication, 55, 721-736.
Churchill, G. A. Jr. (1979). A paradigm for developing better measures of marketing constructs. Journal of Marketing Research, 16(1), 64-73.
Chen, J. S., & Gursoy, D. (2001). An investigation of tourists’ destination loyalty and preferences, International Journal of Contemporary Hospitality Management, 13(2), 79-85.
Cronbach, L. J. (1951). Coefficient alpha and the internal structure of tests. Psychometrika,
16, 297–334.
DeVellis, R. (2003). Scale development: Theory and application. New York, NY: Sage.
Echtner, C. M., & Ritchie, J. R. B. (1993). The measurement of destination image: An empirical assessment. Journal of Travel Research, 31(4), 3-13.
Engel, K. S., Moosbrugger , H., & Müller, H. (2003). Evaluating the fit of structural equation models: Tests of significance and descriptive goodness-of-fit measures.
Methods of Psychological Research Online, 8(2), 23-74.
Fayeke, P. C., & Crompton, J. L. (1991). Image differences between prospective, first-time and repeat visitors to the lower Rio Grande Valley. Journal of Travel Research, 30(2), 10-16.
Fornell, C., & Larcker, D. F. (1981). Evaluating structural equation models with unobservable variables and measurement error. Journal of Marketing Research, 18(1), 39-50.
Gartner, W. (1993). Image formation process. In M. Uysal & D. Fesenmaier (Eds.),
Communication and channel systems in tourism marketing (pp. 191–215). New York,
NY: The Haworth Press.
Gursoy, D., & Chi, C. G. (2018). The Routledge Handbook of Destination Marketing. London: Routledge.
Hair, J. F., Black, W. C., Babin, B. J., & Anderson, R. E. (2014). Multivariate data analysis (8th ed.). New Jersey: Pearson Education.
Hall, R. J., Snell, A. F., & Foust, M. S. (1999). Item Parceling Strategies in SEM: Investigating the Subtle Effects of Unmodeled Secondary Constructs.
Organizational Research Methods, 2(3), 233-256.
Han, H., & Hwang, J. (2016). Investigating healthcare hotel travelers’ overall image formation: Impact of cognition, affect, and conation. Tourism and Hospitality
Research, 18(3), 346–356.
Hilgard, E. R. (1980), The triology of mind: Cognition, affection and conation. Journal of
the History of the Behavioral Sciences, 16, 107-117.
Hirschfeld, G., & von Brachel, R. (2014). Multiple-group confirmatory factor analysis.
Practical Assessment, Research & Evaluation, 19(7), 1-12.
Jöreskog, K. G. (1971). Simultaneous factor analysis in several populations. Psychometrika,
36, 409-426.
Kaiser, H. (1974). An index of factor simplicity. Psychometrika, 39, 31–36.
Kozak, M. (2002). Comparative analysis of tourist motivations by nationality and destinations. Tourism Management, 23(3), 221-232.
Kozak, M., & Martin, D. (2012). Tourism life cycle and sustainability analysis: Profit-focused strategies for mature destinations. Tourism Management, 33, 188-194. Landis, R. S., Beale, D. J., & Tesluk, P. E. (2000). A comparison of approaches to forming
composite measures in structural equation modeling. Organizational Research
Methods, 3, 186–207.
Matsugana, M. (2008). Item parceling in structural equation modeling: A primer.
Communication Methods and Measures, 2(4), 260-293.
Michael, N., James, R., & Michael, I. (2018). Australia’s cognitive, affective and conative destination image: An Emirati tourist perspective. Journal of Islamic Marketing, 9(1), 36–59.
Miyamoto, T., & Iwasaki, K. (2013). Tourism appeal as the driver of a convention attendee’s destination loyalty: Insights from two Japanese regional conventions.
Retrieved April 6, 2018, from
https://www.researchgate.net/publication/276270716_Authentic_Tourism_Appeal_ as_the_Driver_of_a_Convention_Attendee's_Destination_Loyalty_Insights_from_t wo_Japanese_regional_conventions
Ozdemir, B., Aksu, A., Ehtiyar, R., Cizel, B., Cizel, R. B., & Icigen, E. T. (2012). Relationships among tourist profile, satisfaction and destination loyalty: Examining empirical evidences in Antalya Region of Turkey. Journal of Hospitality
Marketing & Management, 21(5), 506-540.
Pearce, P. L. (2005). Tourist behavior: Themes and conceptual schemes. UK, USA, Canada: Channel View Publications
Pike, S. (2007). Destination image questionnaires – the trial of a ‘don’t know’ option.
Journal of Travel and Tourism Research, Fall, 151-160.
Pike, S., & Ryan, C. (2004). Destination positioning analysis through a comparison of cognitive, affective, and conative perceptions. Journal of Travel Research, 42, 333-342. Russel, J. A., & Pratt, G. (1980). A description of the affective quality attributed to
environments. Journal of Personality and Social Psychology, 38(2), 311-322.
Schumacker, R. E., & Lomax, R. G. (2004). A beginner's guide to structural equation modeling (Second edition). Mahwah, NJ: Lawrence Erlbaum Associates.
Stylidis, D., Shani, A., & Belhassen, Y. (2017). Testing and integrated destination image model across residents and tourists. Tourism Management, 58, 184-195.
Stylos, N., Bellou, V., Andronikidis, A., & Vasilliadis, C. A. (2017). Linking the dots among destination images, place attachment, and revisit intentions: A study among British and Russian tourists. Tourism Management, 60, 15-29.
Stylos, N., Vasilliadis, C. A., Bellou, V., & Andronikidis, A. (2016). Destination images, holistic images and personal normative beliefs: Predictors of intention to revisit a destination. Tourism Management, 53, 40-60.
Vanderberg, R. J., & Lance, C. E. (2000). A review and synthesis of the measurement invariance literature: Suggestions, practices, and recommendations for organizational research. Organizational Research Methods, 3(1), 4-70.
APPENDICES