COMPARISON OF INTERNATIONAL
BACCALAUREATE PRIMARY YEARS PROGRAM
AND NATIONAL CURRICULUM PROGRAM 4
THGRADE STUDENT‟S MISCONCEPTIONS ON THE
TOPIC OF FRACTIONS
A MASTER‟S THESIS BY
EZGĠ ġENGÜL
THE PROGRAM OF CURRICULUM AND INSTRUCTION ĠHSAN DOĞRAMACI BILKENT UNIVERSITY
ANKARA MAY 2015 E Z Gİ Ş E NGÜL 2015
COM
P
COM
P
COMPARISON OF INTERNATIONAL BACCALAUREATE PRIMARY YEARS
PROGRAM AND NATIONAL CURRICULUM PROGRAM 4TH GRADE
STUDENT‟S MISCONCEPTIONS ON THE TOPIC OF FRACTIONS
The Graduate School of Education of
Ġhsan Doğramacı Bilkent University
by Ezgi ġengül
In Partial Fulfillment of the Requirements for the Degree of Master of Arts
In
The Program of Curriculum and Instruction Ihsan Bilkent University
Ankara
ĠHSAN DOĞRAMACI BILKENT UNIVERSITY GRADUATE SCHOOL OF EDUCATION
COMPARISON OF INTERNATIONAL BACCALAUREATE PRIMARY YEARS
PROGRAM AND NATIONAL CURRICULUM PROGRAM 4TH GRADE
STUDENT‟S MISCONCEPTIONS ON THE TOPIC OF FRACTIONS Ezgi ġengül
May 2015
I certify that I have read this thesis and have found that it is fully adequate, in scope and in quality, as a thesis for the degree of Master of Arts in Curriculum and Instruction.
--- Asst. Prof. Dr. Ġlker Kalender
I certify that I have read this thesis and have found that it is fully adequate, in scope and in quality, as a thesis for the degree of Master of Arts in Curriculum and Instruction.
---
Assoc. Prof. Dr. Erdat Çataloğlu
I certify that I have read this thesis and have found that it is fully adequate, in scope and in quality, as a thesis for the degree of Master of Arts in Curriculum and Instruction.
---
Asst. Prof. Dr. Semirhan Gökçe
Approval of the Graduate School of Education
---
iii
ABSTRACT
COMPARISON OF INTERNATIONAL BACCALAUREATE PRIMARY YEARS
PROGRAM AND NATIONAL CURRICULUM PROGRAM 4TH GRADE
STUDENS‟ MISCONCEPTIONS ON THE TOPIC OF FRACTIONS
Ezgi ġengül
M.A., Program of Curriculum and Instruction Supervisor: Assistant Prof. Dr. Ġlker Kalender
May 2015
The purpose of this study was to compare the misconceptions of fractions in IB Primary Years Program (IBPYP) to the misconceptions of fractions of Ministry of National Education (MoNE) 4th grade students. To measure this, the three most popular subtopics of fractions covered in 4th grade mathematics curriculum were selected. These subtopics were (1) partitioning, (2) ordering and (3) addition. Then, nine questions for each subtopics were developed. Accordingly, a fractions test that included 27 items total was developed and used in this research. Analyses were conducted to determine if different curricula cause any response patterns. Analysis showed that only 7 out of 27 items were answered statistically differently by the IBPYP and MoNE students. PYP students had higher correct answer and lower misconception rates in 6 out of these 7 items. However, in general, the correct answer and wrong answer patterns seemed to have no substantial difference across the two curricula. Also, the results proved that some fractions subtopics were more challenging for students than others. Some suggestions about how to address misconceptions were made in the present study.
Key words: Mathematics education, misconceptions, fractions, IBPYP, MoNE primary mathematics education.
iv
ÖZET
ULUSLARARASI BAKALORYA PROGRAMI VE MĠLLĠ EĞĠTĠM BAKANLIĞI ĠLKÖĞRETĠM PROGRAMLARININ ĠLKÖĞRETĠM 4.SINIF ÖĞRENCĠLERĠNĠN
KESĠRLER KONUSUNDAKĠ KAVRAM YANILGILARINA DAYANARAK KARġILAġTIRILMASI
Ezgi ġengül
Yüksek Lisans, Eğitim Programları ve Öğretim Tez Yöneticisi: Yrd. Doç. Dr. Ġlker Kalender
Mayıs 2015
Bu çalıĢmanın amacı Uluslararası Bakalorya Ġlk Yıllar Programı (UBĠYP) ve Milli Eğitim Bakanlığı (MEB) 4. sınıf öğrencilerinin kesirler konusunda sahip oldukları kavram yanılgılarını karĢılaĢtırmaktır. Bu amaçla, 4. sınıfta kesiler konusunda iĢlenen 3 alt baĢlık (1) kesirlerin bölümlere ayrılması, (2) kesirlerin sıralanması ve (3) kesirlerin toplanması olarak belirlenmiĢ ve her bir alt baĢlık için 9 soru
geliĢtirilmiĢtir. Buna bağlı olarak, toplamda 27 sorudan oluĢan bir Kesirler Testi ortaya çıkmıĢtır. Ġki farklı müfredatın öğrencilerinin kavram yanılgıları arasında anlamlı bir fark olup olmadığını anlamak için analizler yapılmıĢtır. Fakat
araĢtırmanın sonunda 27 sorudan yalnız 7 tanesi istatistiksel olarak farklı cevap oranlarına sahip olduğu belirlenmiĢtir. Bu 7 sorunun 6„sında UBĠYP öğrencileri MEB öğrencilerinden daha yüksek doğru cevap ve daha düĢük kavram yanılgısı oranları göstermiĢtir. Yine de genel olarak doğru ve yanlıĢ cevaplar arasında ciddi bir fark gözlenmemekle beraber, bazı alt baĢlıkların diğerlerine oranla daha az doğru cevap oranlarına sahip olduğu gözlemlenmiĢtir. AraĢtırmada ayrıca kavram yanılgılarının tespit ve önlenmesi konusunda bazı öneriler sunulmuĢtur.
Anahtar Kelimeler: Matematik eğitimi, kavram yanılgıları, kesirler, IB Ġlk Yıllar Programı ve Milli Eğitim Bakanlığı Ġlköğretim matematik eğitimi
v
TABLE OF CONTENTS
ABSTRACT ... iii
ÖZET... iv
TABLE OF CONTENTS ... v
LIST OF TABLES ... viii
LIST OF FIGURES ... ix CHAPTER 1: INTRODUCTION ... 1 Introduction ... 1 Background ... 2 Problem ... 4 Purpose ... 5 Research questions ... 6 Significance ... 6
CHAPTER 2: REVIEW OF RELATED LITERATURE ... 8
Introduction ... 8
Misconceptions ... 9
The significance of misconceptions ... 10
Sources of misconceptions... 11
The significance of fractions ... 12
vi
Examining some specific misconceptions on fractions ... 15
Misconceptions on partitioning ... 16
Misconceptions on ordering... 18
Misconceptions on add tops-add bottoms ... 19
Differences between PYP and MoNE schools ... 20
How do MoNE and PYP curricula handle fractions? ... 22
How are MoNE and PYP different in teaching fractions?... 29
Summary ... 30 CHAPTER 3: METHOD ... 33 Introduction ... 33 Research design ... 33 Context ... 33 Participants ... 34 Instrumentation ... 34
Method of data collection ... 38
Method of data analysis ... 39
CHAPTER 4: RESULTS ... 42
Introduction ... 42
The overview of categories ... 42
Misconceptions on partitioning ... 47
Misconceptions on ordering ... 52
vii
Review of all items according to percentage ranks ... 62
Summary ... 66
CHAPTER 5: DISCUSSION ... 68
Introduction ... 68
Discussion according to misconception categories ... 69
Discussion of misconceptions on partitioning ... 69
Discussion of misconceptions on ordering ... 73
Discussion of misconceptions on add tops-add bottoms ... 76
Discussion in terms of PYP and MoNE curricula ... 79
Implications for practice ... 80
Implications for further research ... 81
Limitations ... 81
REFERENCES ... 83
APPENDICES ... 92
Appendix A-Instrument (English) ... 92
Appendix B- Instrument (Turkish) ... 97
Appendix C- Instrument with the actual item numbers ... 102
viii
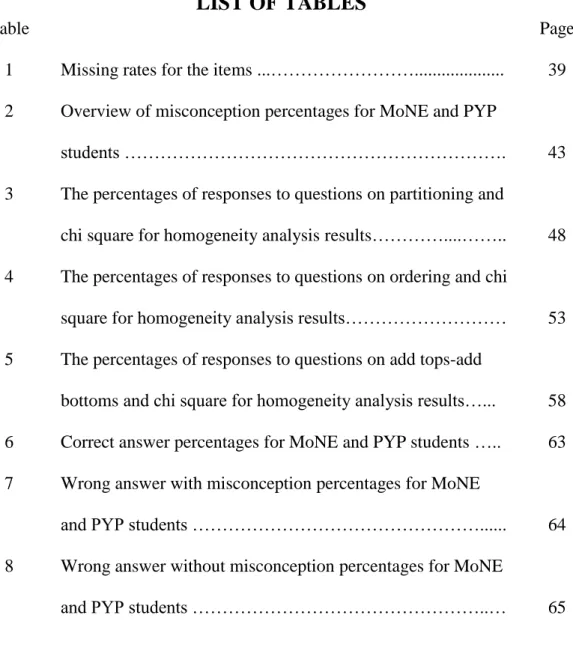
LIST OF TABLES
Table Page
1 2
Missing rates for the items ...………... Overview of misconception percentages for MoNE and PYP students ………. 39 43 3 4 5 6 7 8
The percentages of responses to questions on partitioning and chi square for homogeneity analysis results…………....…….. The percentages of responses to questions on ordering and chi square for homogeneity analysis results……… The percentages of responses to questions on add tops-add bottoms and chi square for homogeneity analysis results…... Correct answer percentages for MoNE and PYP students ….. Wrong answer with misconception percentages for MoNE and PYP students ………... Wrong answer without misconception percentages for MoNE and PYP students ………..…
48 53 58 63 64 65
ix
LIST OF FIGURES
Figure Page
1 Example of a misconception on partitioning ………….………. 16
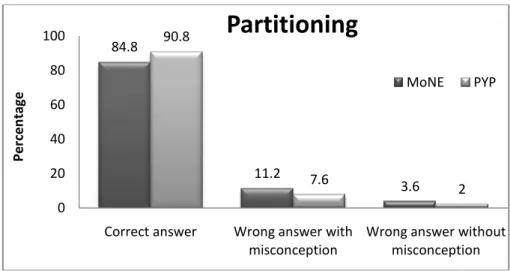
2 3 4 5 6 7 8 9 10 11
Correctly and incorrectly partitioned shapes ………...…... Comparison of response patterns for partitioning category… Comparison of response patterns for ordering category……..
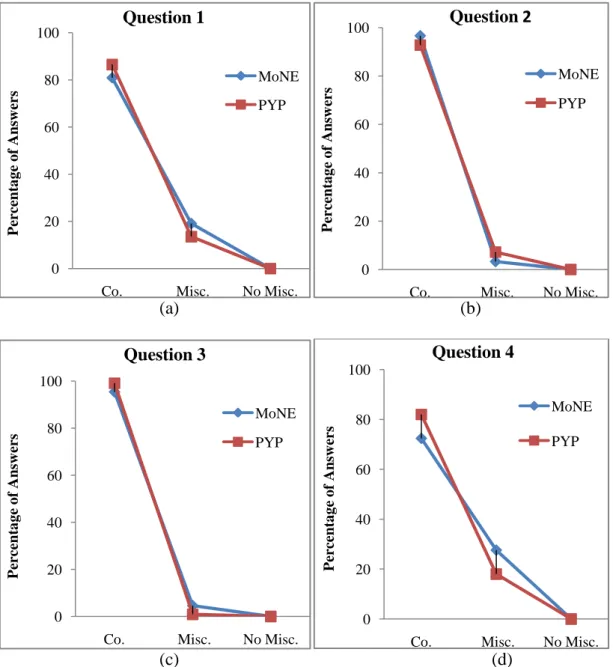
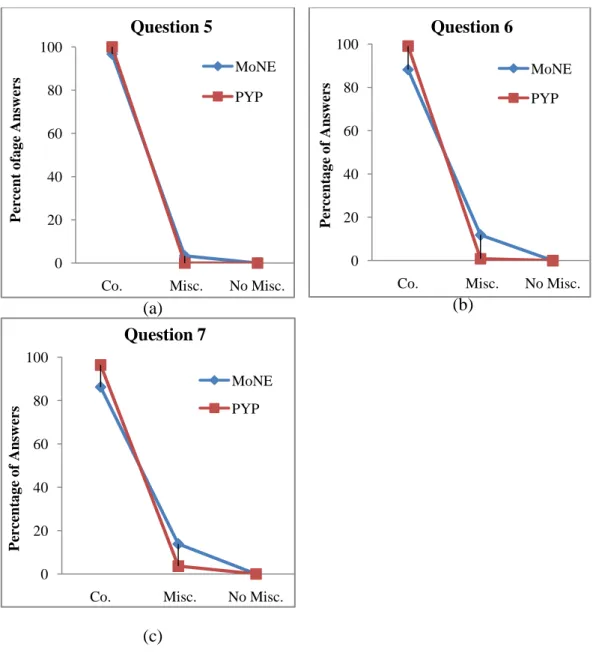
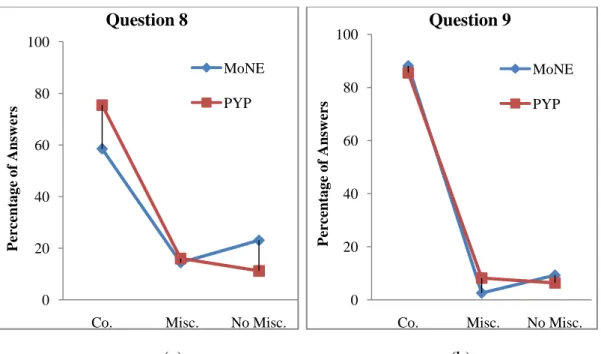
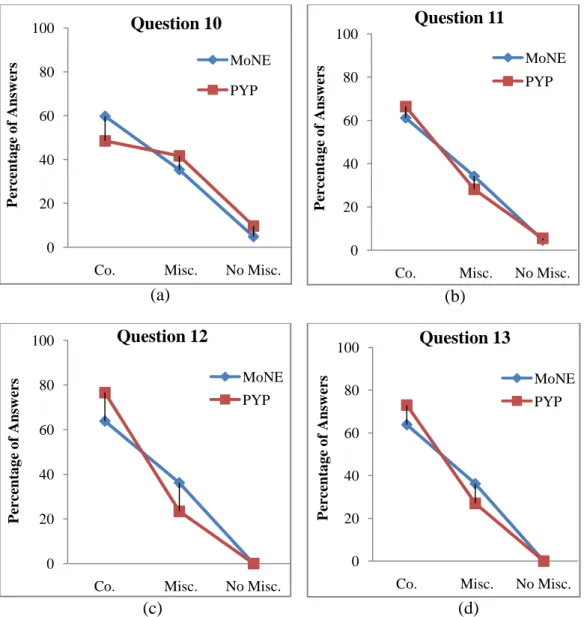
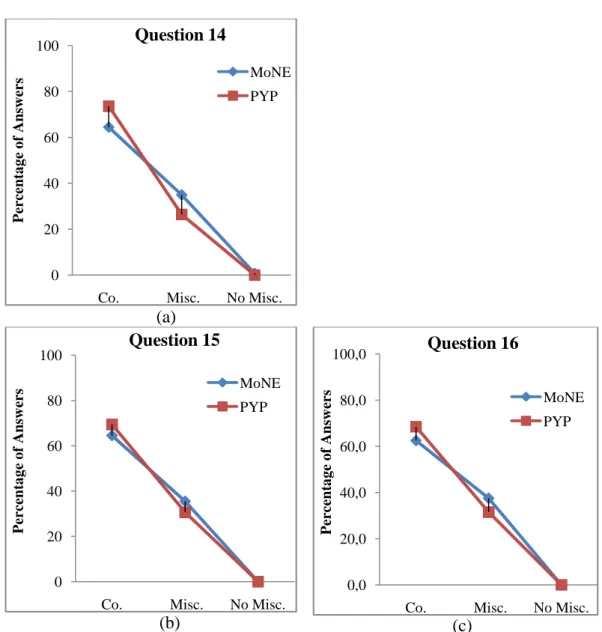
Comparison of response patterns for add tops-add bottoms category………... (a) Line graph of answers for question 1, (b) line graph of answers for question 2, (c) line graph of answers for question 3 (d) line graph of answers for question 4……….. (a) Line graph of answers for question 5, (b) line graph of answers for question 6,(c) line graph of answers for question 7 (a) Line graph of answers for question 8, (b) line graph of answers for question 9……… (a) Line graph of answers for question 10, (b) line graph of answers for question 11, (c) line graph of answers for question 12 (d) line graph of answers for question 13……….. (a) Line graph of answers for question 14, (b) line graph of answers for question 15, (c) line graph of answers for question 16………. (a) Line graph of answers for question 17, (b) line graph of answers for question 18……… (a) Line graph of answers for question 19, (b) line graph of
17 45 45 46 49 51 52 55 56 57
x
12
13
answers for question 20 (c) Line graph of answers for question 21, (d) line graph of answers for question 22, (e) Line graph of answers for question 23, (f) line graph of answers for question 24……….. (a) Line graph of answers for question 25, (b) line graph of answers for question 26 (c) Line graph of answers for question 27………
59
1
CHAPTER 1: INTRODUCTION
Introduction
Students‟ misconceptions can be simply defined as the partly incorrect or incomplete ideas that contradict with the scientific facts and are resistant to change (Steinle & Stacey, 2003; Leonard et al., 2014).Students‟ misconceptions have been one of the intensively studied research areas in mathematics education. They are mostly considered as one of the severe obstacles to students‟ complete learning. Research studies show that late correction of misconceptions of fundamental mathematics or science concepts could inhibit learning. Also, not correcting a misconception can make it more persistent in time (Strike, 1983; Micheal, 2002). Due to this, the diagnoses and the prevention of students‟ misconceptions are crucial in order to reach accurate and complete teaching and learning.
Fractions is one of the most important mathematics topics as it has wide real life reflections and connections with other mathematical and scientific concepts (Keijzer & Terwel, 2001; McLeod & Newmarch, 2006). In order for students to be able to apply fractions to real life and to other more advanced mathematical concepts, they should first be able to grasp fractions. Since the topic fractions is the first attempt of primary school students to work beyond whole numbers, students tend to apply their whole numbers knowledge to fractions (Hasemann, 1981; Baroody & Hume, 1991). For example, students might think that bigger denominator means bigger value. Such overgeneralization can cause misconceptions.
2
In Turkish schools, fractions teaching starts in second grade. Primary school students are taught according to the Ministry of National Education (MoNE) curriculum in Turkish schools today. On the other hand, International Baccalaureate Primary Years Program (IBPYP), which is an internationally recognized program, introduces fractions in the first year of education. The approach of the two curricula to fractions learning also differs in other ways. So, the frequencies and types of misconceptions can be observed differently for two different curricula.
Background
Students‟ misconceptions have been one of the most intensively studied research areas in mathematics education because of their roles in interference with the meaningful and permanent learning of students (Köse, 2008). According to Çardak (2009) the source of misconceptions is generally the students‟ own interpretations or bias, and misconceptions often contradict with the reality. Before entering the formal education children already have their own perception of scientific ideas, which are based on their earlier experiences in life. These pre-existing experiences might lead them to develop partially formed and incorrect ideas about concepts and hence pre-existing knowledge becomes one of the most common reasons why students develop misconceptions (Johnston & Gray, 1999; Henriques, 2002
).
Various researchers agreed on the severe function of misconceptions as obstacles to learning (Keijzer & Terwel, 2001; Yoshida & Sawano, 2002). For example, Çardak (2009) claimed that if misconceptions are not identified or not prevented, they can inhibit students‟ learning about related concepts. In a similar vein, Michael (2002) argued that one of the most important problems with misconceptions is that they are often persistent and severely prevent students‟ ability to learn the concept.
3
Misconceptions should be detected and corrected to supply better learning. Due to this, teachers should be aware of possible misconceptions students tend to exhibit. Knowing which stages of development or which part of curriculum are more likely to bring out misconceptions will give the opportunity to plan lessons accordingly and correct misconceptions if they still arise (Chick & Baker, 2005).
Fractions are often considered as one of the least popular mathematics topics by students at primary level. A high number of students find the concept of fractions challenging since the notation is quite different, and the operations in fractions require particular procedures that they often carry without enough reasoning (Lee, 2008).
After students complete their learning with whole numbers, they next move on to the number set that encompasses the whole numbers, which is the rational numbers (Hasemann, 1981; Baroody & Hume, 1991). Rational numbers are introduced with fractions and decimals, which have quite different notations and logic than whole numbers (Brown, 1993, Moss & Case, 1999). As students build their fractions learning on their prior knowledge of whole numbers, misconceptions could arise. Some of the commonly seen misconceptions are:
Failing to understand the value of fractions as a part of a whole so, believing
the denominators and nominators of fractions are separate whole numbers,
Thinking that the shapes that are not equally-partitioned can define fractions,
Failing to determine a common denominator in addition, subtraction or
ordering hence adding, subtracting or ordering the denominators and nominators separately (Schifter, Bastable, & Russell, 1999; McNamara & Shaughnessy, 2010; Van de Walle et al., 2010, p. 287).
4
Some of these misconceptions could be predicted by teachers and they might help teachers to develop better lesson plans. In order to do this, teachers should be aware of the most common misconceptions of students, why and how these misconceptions occur and how they can be reduced or prevented.
Fractions teaching differs for MoNE and PYP curricula. The first confrontation with fractions and the way fractions are taught can alter from one curricula to another. So, this difference can affect the learning as well. This study attempted to figure if different curricula have an effect on the misconception rates.
Problem
In today‟s world, the increasing role of globalization requires countries and
educational organizations to revise their systems and make improvements to educate more people who are culturally and internationally aware (International
Baccalaureate Organization, 2007). Hence more schools around the world have started to implement international education programs such as International General Certificate of Secondary Education (IGCSE) or IB to be recognized globally (Dağlı, 2007; AteĢ 2011).
In Turkey there are 20 schools as of April 2015 that implement IBPYP and they are all private schools (www.ibo.org). Here, it should be also noted that students who attend private schools tend to have higher socio-economic background than those who attend public schools (OECD, 2012). Besides the existing difference in the philosophy and the educational approach of IBPYP to MoNE program, the quality of education in IB schools is also the result of being privately managed. From this point of view, literature needs more research about the effects of different educational approaches and different curricula on the quality of teaching and learning.
5
Even though students‟ misconceptions have been addressed by several researchers, most of them preferred to work on the diagnoses and the prevention of
misconceptions. However, very few of these studies attempted to focus on
misconceptions in a comparative manner between different curricula. For this reason, this study attempted to use misconceptions as a tool to compare MoNE and PYP curricula‟s education qualities. To this end, this study focuses on the comparison of the types and the frequencies of misconceptions that students who are taught with two different curricula have in the topic fractions.
Purpose
The main purpose of this study was to compare the fraction misconceptions of MoNE and PYP 4th grade students and figure out if students from the two curricula showed different misconceptions patters. Also by comparison, research attempted to observe how frequent the misconceptions. The reason behind choosing 4th grade in particular was because the primary school is an important period in students‟
mathematical development in which students decide if they like mathematics or not. This grade is also significant since the first misconceptions are formed and they start to influence the following years such as middle school and high school years
(Keazer, 2004). This study aimed to identify the first forms of misconception types before students build upon their primary fractions knowledge.
For this purpose, the most frequent misconceptions that students might have on topic of fractions were identified from the related literature and they were categorized under three sub-categories; misconceptions on partitioning, misconceptions on ordering and misconceptions on add tops-add bottoms. These misconceptions were also adapted to 4th grade students by considering the outcomes of the topic of
6
fractions in both curricula. With regards to all these, a fractions test was developed by the researcher. With the aid of the results, the effects of the applied curricula on students‟ misconceptions are expected to be revealed. Yet, the present study only focused on the differences in misconceptions regarding fractions. Results should not be generalized to compare the two curricula in general.
This study also aimed to compare the frequencies of selected types of
misconceptions without necessarily comparing the curricula. By doing that, research attempted to find out what particular sub-headings of fractions students most struggle with.
Research questions This study will address the following questions:
Do 4th grade students‟ misconceptions on the topic of fractions vary across
MoNE and PYP curricula?
Among some specific misconceptions on the topic of fractions, what are the
most common ones that 4th grade students struggle with regardless of their curriculum?
Significance
Examining students‟ misconceptions provides chance to demonstrate students‟ understanding of a concept. On one hand, students‟ correct answers may not necessarily indicate their perceptions on a target topic completely because students can show a correct understanding by simple memorization of procedures or
definitions. On the other hand, misconceptions point out the lack of knowledge or inappropriate connections (Li, 2006). If these misconceptions are identified and corrected, then the teaching and learning become more meaningful. The resolution of
7
students‟ misconceptions leads to a more effective learning (Keazer, 2004). So, being aware of the fractions misconceptions enable teachers to be more careful.
Even though misconceptions are one of the major fields in mathematics education, there are a few studies that used misconceptions as a comparison tool. Due to this reason, this study aimed to fill this gap to some degree.
Moreover, in mathematics education, most students encounter challenges in grasping the concept of fractions (Lee, 2008). Since fractions are connected with many other algebraic topics such as number theory, greatest common divisor, least common denominator, and prime factorization, the misconceptions on fractions can function as an obstacle to learn all these related topics as well (Van de Walle et al., 2007, p. 319). Therefore, it is important to address students‟ misconceptions in the topic of fractions before they move on to other related topics. After the determination of problems and gaps in students‟ thinking, the suggestions can be given
retrospectively.
Predicting the misconceptions of students on fractions will allow teachers to develop better lesson plans and hence provide a better learning and teaching even before any misconception occurs. For this reason, the study aims to contribute to literacy by addressing this critical point.
Furthermore, comparison of students taught with two different curricula are expected to give significant information for stakeholders such as policy makers,
8
CHAPTER 2: REVIEW OF RELATED LITERATURE
Introduction
Students‟ misconceptions have been one of the most intensively studied research areas in mathematics education. Mathematics educators have defined misconceptions at the K-12 levels as the obstacles that prevent meaningful and permanent learning of a concept (Keijzer & Terwel, 2001; Yoshida & Sawano, 2002).
It is not a matter of debate that children already have developed their own perception about the world. Hence they already have some scientific knowledge before they actually start to receive formal education in classrooms (Henriques, 2002). This knowledge can and does affect their learning process in schools. In particular, it affects negatively if the knowledge is incorrect and resistant to change (Black & Lucas, 1993).
Misconceptions might guide researchers and teachers to understand the perceptions of students, how their minds work and what kind of connections they make while learning (Steinle & Stacey, 2003). Knowing how a student‟s mind works will eventually make the teacher‟s work easier. Due to this, teachers should pay special attention to find out students‟ possible misconceptions. In order to help teachers face with misconceptions sooner and more effective, the research studies that focus on misconceptions are of great importance (Wallace, 2007). Therefore, the aim of this literature review is pointing out the role of misconceptions in education, how misconceptions might be observed particularly in mathematics education and the most common misconceptions on the topic of fractions.
9
Misconceptions
Misconceptions could be described as one of the leading factors that prevent
students‟ meaningful and permanent learning. They do not match the scientific facts but instead contradict. Most of the time misconceptions are developed by individuals themselves often based on their own interpretations or bias (Johnston & Gray, 1999; Henriques, 2002; Çardak, 2009). Since they are substantial barriers against learning, the majority of studies carried out in the field of mathematics education now focus on students‟ misconceptions.
Even though misconceptions seem naive, they are actually extremely complex and have deeper effects on students‟ learning than expected (Wescott & Cunningham, 2005). They are widespread in formal education and considerably resistant to change. If they are not identified or if they continue for long term, misconceptions may prevent students‟ learning about related concepts (Çardak, 2009). Moreover, some students‟ misconceptions can spread to others while working in groups.
However, some researchers believe misconceptions are not always so severe and might be a natural step in learning. For example, Swan (2001) pointed out,
“Frequently, a „misconception‟ is not wrong thinking but is a concept in embryo or a local generalization that the pupil has made. It may in fact be a natural stage of development” (p. 154). From this point of view, misconceptions could also be
considered a chance to elicit students‟ progress in learning and the way they perceive new information. This might lead us to think that misconceptions are not always critical obstacles to learning but also could be considered as a tool to elicit students‟ ways of perceiving new information and connect new knowledge with the old one.
10
Research evidence also indicates that the resolution of students‟ misconceptions leads to effective learning (Swan, 2001).
Whether misconceptions prevent meaningful learning or it is a natural step in improvement, it still needs to be understood to use them in the students‟ favor while teaching and planning.
The significance of misconceptions
If misconceptions go unnoticed, the new concepts that are built upon the previous ones will be incomplete or inaccurate. Even the increase of misconceptions on connected concepts might cause the sense of inadequacy and hence mathematics anxiety (Keazer, 2004).As a result, teachers need to know how a new learner‟s mind might work in order to promote deep and long-lasting learning. Being aware of what kind of misinterpretations might occur, gives teachers the opportunity to treat
misconceptions and hence rebuild the mathematical understanding of students (Chick & Baker, 2005).
Moreover, Chen, Kirkby and Morin (2006) argued that teachers do not often spare time to identify students‟ misconceptions and since more often they focus on what kind of questions they may encounter while teaching, they do not pay attention to the ones they do not confront. A study that was conducted by Sadler, Sonnert, Coyle, Cook-Smith and Miller (2013) showed a surprising result. In a test that teachers took, they were asked to give both correct answers for questions and the most possible incorrect answers that students might give. Most of the teachers gave correct answer to questions while most of them failed to identify students‟ possible incorrect answers.
11
Yet, it is hard for teachers to diagnose misconceptions. How do teachers know that students have misconceptions or students are simply wrong? When teachers ask a question and encounter an odd or unexpectedly wrong answer they cannot conclude that students have misconceptions. However, if the same odd and unexpected, wrong answers follow the questions within a similar context, then teachers could suspect that there might be a possible misconception on this topic (Michael, 2002; Ball, Hill & Bass, 2005).
Sources of misconceptions
Misconceptions may occur for a variety of reasons. Some researchers agree that students‟ misconceptions are originated from their prior learning they informally developed before entering formal education. These early experiences, which can be considered as a natural development phase, lead children to have their own ideas about the outcomes of scientific facts (Johnston & Gray, 1999; Henriques, 2002; Çardak, 2009). Hence the observations and experiences that they bring into classrooms eventually can interfere with the formal education in schools.
Furthermore, Hanuscin (2007) claimed that misconceptions can occur when learner mixes more than one concept. As relations between the concepts in science and mathematics are inevitable, learners can develop their own links that might be incomplete or inaccurate and these links can eventually cause misconception.
Another possible scenario that has been suggested is that the common words that are used both in everyday life and in scientific concepts can cause misinterpretation and hence misconception (Hanuscin, 2007). So, misconceptions can arise from verbal confusion too.
12
Furthermore, Barrass (1984) and Kajander & Lovric (2009) claimed that textbooks might also be responsible to compound students‟ misconceptions about concepts. Especially when considering their major roles in education, as a significant tool for students to study and do homework and for teachers to see what to cover and how, the misconceptions they possibly raise become significant. The researchers claimed that textbooks have great potential to help students learn while they also have serious weaknesses and obvious mistakes.
Misconceptions also might oocur due to the pace of work, the slip of a pen, the lack of attention or knowledge or a misunderstanding. Apart from that, students‟
misconceptions may be reinforced by the lack of prior knowledge. Skelly and Hall (1993) stated that
If the learner‟s prior knowledge needed to process new information is
incomplete, the knowledge gaps will result in confusion, inaccurate reasoning, and eventually in the formation of misconceptions. If the learner‟s prior knowledge structure contains misconceptions, these can cause further faulty reasoning and incorrect concept formation (p.1504).
The significance of fractions
Many students may wonder why learning fraction is essential in particular when they are first introduced. Fractions are considered important also because it is the first experience of a mathematical concept after learning the simple algebraic rules such as addition, subtraction, multiplication and division (Hasemann, 1981; Baroody & Hume, 1991; Mack, 1995, Lappan et al., 1998). If possible misconceptions about fractions are considered and the lessons are planned accordingly, students feel confident and comfortable with their learning of fractions. Hence, this successful experience of gaining a new concept in mathematics with comfort helps positively to their confidence and approach to mathematics. Even though the significance of
13
misconceptions for teaching and learning are made explicit, the necessary attention is still not given.
The introduction of fractions could be considered as the first experience of students with a new mathematics concept beyond simple arithmetic operations (Mack, 1995). The topic of fractions is first introduced by the Ministry of National Education (MoNE)curriculum as early as second grade and it is taught through all grades up to grade 7. Because of its connection with other algebra topics, students should feel comfortable with their understanding of fractions in order to become capable of learning other related topics (D‟Ambrosio & Mewborn, 1994, Chick, Tiemey & Storeygard, 2007). For example, understanding the concept of fractions would enable students to comprehend some of the essentials of number theory, such as greatest common divisor, least common denominator, and prime factorization (Bauman & Sauer, 1995; Burns, 2000). Predicting the misconceptions of students on fractions will allow teachers to develop better lesson plans and hence provide a better learning and teaching even before any misconception occurs (Stigler & Hiebert, 1999).
In addition to its connection with other topics, there are also several real life situations that people need to use their fraction knowledge. Fractions are used in a variety of examples from real life such as recipes, splitting costs, balancing budgets, and even in the world of sport. Due to this, students should be able to gain the ability of reasoning on fractions (Keijzer & Terwel, 2001; Parker, 2004).
Challenges in learning fractions
Most students have difficulty to grasp the abstract symbols, terminology and visual representations of fractions (Saxe et al., 2005; Lee, 2008). The lack of correct and complete understanding of fractions might cause the difficulties with fractional
14
computation, decimal and percentage learning and other algebraic concepts that use fractions as a tool (Tatsouka, 1984). Hanson (1995) claims that one of the main reasons students have difficulty to understand fractions is because they tend to memorize formulas and algorithms instead of understanding the logic behind them.
Another significant reason why fractions are considered confusing is that they break the rules students learned about whole numbers up to that point. Whole numbers are increased as they multiplied but for simple fractions the situation is quite the reverse. Other than that, students also have difficulty to understand the notation of fractions. This notation, one number over another, is quite different than whole numbers. So, this can be another reason of whole numbers‟ influence on fractions. Students naturally think the nominator and denominator of fractions are separate whole numbers (Small, 2008). So, they often carry out operations separately for nominators and denominators. This problem takes its source from not recognizing that
denominators define the size of shares and nominators represent how many of these
shares are considered. To avoid this problem, the values like 3
4should not be taught as “three over four” but instead “three fourths” should be used (Siebert & Gaskin, 2006).
Students also find it challenging to learn basic characteristics of fractions such as order or equivalence (Lamon, 1999; Yoshida & Sawano 2002). Both concepts are basic concepts of fractions curriculum. Even though most students do not have any difficulties in dealing with real numbers they can feel confused when fractions are
15
involved. For example, when students are asked to order the fractions 1 3 and 1 4they can say 1 4 is greater than 1
3because 4 is greater than 3 (Nunes et al., 2006). In
addition to ordering, the addition of fractions might seem challenging to some students. When they are asked to add two fractions they may add the denominators without making denominators equal.
Teachers need to make students realize that fractions are different from real numbers or natural numbers. Emphasizing that the denominators and nominators are not separate values instead they are used to represented a part of a whole is crucial for working with fractions (Steinle & Stacey, 2004). Constructing meaningful problem stories can be useful to overcome this problem. Visual representations that show how a whole is divided into pieces and how they are named, added or multiplied might also work with fractions (Ball, 1993; Streefland, 1993).
Examining some specific misconceptions on fractions Fractions is one of the leading topics in both MoNE and PYP curricula. Since fractions learning is core for many other topics in algebra and in other areas of subjects, fractions teaching starts with grade two and continues through almost all grades until high school (IBO, 2009; MEB, 2009). Among many subtopics of fractions the specifically partitioning, ordering and addition were examined for this research as these topics are both core for fractions teaching and are common for PYP and MoNE 4th grade fractions curricula.
16 Misconceptions on partitioning
Dividing a shape into equal-sized parts is called partitioning. Since the part-whole relationship is the core of the fractions teaching, fractions are generally introduced first with examples in which a part of a whole is shaded.
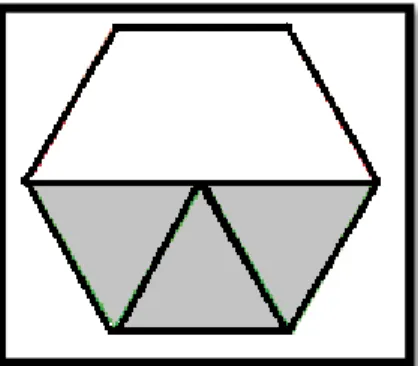
Siebert and Gaskin (2006) suggested that students‟ fractions misconceptions often arise from not being able to understand the relationship between nominator and denominator but instead believing they are separate two real numbers. In order to correct this thought, partitioning should be taught as “creating smaller, equal-sized amounts from a larger amount” or “making copies of smaller amount and combining them to create a larger amount” (p.395).Students tend to skip the importance of equal partitioning and think that unequally partitioned shapes or areas can also describe fraction (Empson, 2001; Cramer & Whitney, 2010). For example, for the below
shape students may think the shaded region describes 3
4rather than 1
2of the whole (Van de Walle et al., 2012, p. 292).
Figure 1. Example of misconception on partitioning
Due to this, students should learn the part-whole relationship and so, the focus should be on equal parts. These parts can have same shape or a different shape that has the same size, because too often students conclude that equal shares might not be the same shape, which is not correct (Van de Walle et al., 2012, p. 296).
17
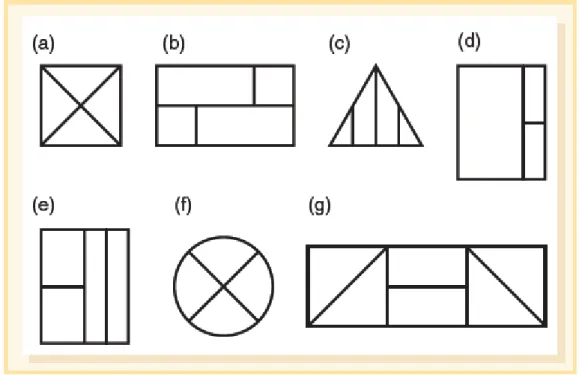
An activity that explains this situation clearly have examples that are (1) same shape, same size; (2) different shape, same size; (3) different shape, different size; and (4) same shape, different size. Examples in number (1) and (2) are for the equally partitioned fractions while the examples in number (3) and (4) are for the parts that are not equivalent. A student whose partitioning knowledge is proper and complete should distinguish the figures that are correctly partitioned into four from the ones that are not partitioned equally (Van de Walle et al, 2012, p. 296).
Figure 2. Correctly and incorrectly partitioned shapes (Van de Walle et al., 2012, p. 297)
The figures for the category (1) same shape, same size are figures (a) and (f) while the ones for category (2) different shape, same size are figures (e) and (g). These four figures should be selected as correct shares by students who learn partitioning well. On the other hand, the figures for the category (3) different shape, different size, were figures (b) and (c) and the figures for the category (4) same shape, different size, were the figure (d) were the ones that were not accurately partitioned. The
18
students, who think one of these three figures illustrates the correct share, apparently have misconceptions on partitioning.
Another part-whole problem that leads misconception on partitioning is that students
seeing three green and four blue counters think 3
4of counters are green (Bamberger, Oberdorf, &Schultz-Ferrell, 2010). This problem again takes its roots from not understanding completely what whole means and how a fraction describes a part of the whole with the aid of numerator and denominator.
Students should be told that partitioning fractions means dividing the whole into equal parts. Clearly explaining that the operations such as ordering, adding, or subtracting can be only carried out when two wholes are divided into same sized parts are crucial. To be able to comprehend what partitioning really means, the practices should be done on all kind of possible examples, not only on a pizza
(McNamara & Shaughnessy, 2010). Area, length and sets should be used to diversify the examples. For partitioning a set, a class, counters, playing cards, marbles can be used while with length model partitioning a rope, a rode, or a ruler might work. For the area model, which is mostly the case, partitioning a pizza, a rectangular garden, etc. can be used.
Misconceptions on ordering
Being able to tell which fraction is greater is another aspect of number sense with fractions. Students have strong mind set about numbers such as thinking larger numbers mean more. This is valid for positive whole numbers such as 5 > 4. Since students overgeneralize the whole numbers rules, they fail to understand the relative
19
While ordering fractions students tend to think the bigger the number on the bottom, the bigger the fraction gets. As a result of this, students order unit fractions wrongly.
For instance, they conclude that 1
6is bigger than 1
2 (Nunes et al., 2006).
To prevent this, students should be told that the more parts there are in the
denominator the smaller each portion will be. However, this logic should be given with plenty of visual representations and examples without having students to memorize the procedure that the bigger the denominator the smaller the fraction (Ball, 1993; Martinie & Bay-Williams, 2003). Teaching ordering with such rules
could make students overgeneralize and conclude that 1
6 is bigger than 5
10because 6 is smaller than 10 (Cramer, Wyberg, & Leavitt, 2008).
Also, not limiting the problems only with circle pieces but also using other context, models and mental imaginary may help students to enrich their understanding and they could be away from the risk of being too reliant on model (Bray & Abreu-Sanchez, 2010). Instead, deepen the problems with real world contexts that are meaningful to them is more useful. For example, asking students if they would rather
have 1
2of marbles, 1
4of marbles, or 1
10of them. Letting them partition the marbles and then answer would make them realize the relationship between the denominator size and function size (Siegler et al., 2010).
Misconceptions on add tops-add bottoms
Another misconception that leads students to think that fractions are added together by adding the top numbers together and then adding the bottom numbers together. This misconception again takes it sources from the whole numbers knowledge
20
influencing fractions (Lappan & Mouck, 1998; Cramer & Whitney, 2010). Students who have strong conceptual understanding of equivalence can easily move between
fractions such as 1 2 3 4 5, , , ,
2 4 6 8 10etc. and adjust the fractions in order to make addition (Taber, 2009).
Teachers should focus more on part-whole concept instead of giving the rule of it right away. Students should be told that only the same sizes can be added or
subtracted which implies that the denominators of the fractions should be equal first Using manipulative, modeling can help students to see which parts are equal and which parts are not (Mack, 2004; Cramer & Henry, 2002; Bamberger et al., 2010).
Comparing the addition with multiplication may be one of the reasons students get confused. Some students compare adding with multiplication and think why does the denominator stay same while adding and why does it multiply while multiplying (Huinker & DeAnn, 2002).
To prevent this misconception from occurring, students should be told that different denominators represent different sized shares and when we want to add or subtract different shares there won‟t be any equality. Students could be encouraged with questions like “Two fifths plus one fifths is how many fifths?” to think about the meaning of the denominator. Especially, doing that exercise before moving on unlike denominator would be helpful (Mack, 2004).
Differences between PYP and MoNE schools
In an increasingly globalized and rapidly changing world, the need for educated people who can think universally, culturally aware and competent to engage with other people increases as well (www.ibo.org). This leads schools all around the
21
world to start to implement international education programs besides their national education programs in order to be recognized at international level (Dağlı, 2007; AteĢ 2011). Due to this, starting from 1997 some Turkish schools started to implement PYP (Primary Years Program) which is one of the three programs that IBO (The International Baccalaureate Organization) offers as if January 2014. There are 19 schools in Turkey that offer PYP education and they are all private schools (www.ibo.org). PYP is designed for students aged 3 to 12. PYP is a program that creates intellectual challenges for students and aims to develop the whole child as an inquirer both inside and outside the school, to prepare them in their future career (International Baccalaureate Organization, 2007; www.ibo.org).
A study that was conducted in 2014 in Australia concluded that IB PYP students exhibit higher performance when comparing the national average in nationwide science tests (Campbell et al., 2014).
The distinction between national schools and private schools should also be
investigated in terms of their education approaches, socio economic states of students and family backgrounds of their students.
Why do families in Turkey pay fees for private school, instead of sending their children to public schools? Dinler & Subası (2003) and Cinoglu (2006) stated that an increasing number of people prefer private schools since the education quality is higher due to the relationship between the market economy and education. They also pointed out that public schools are run by government bureaucracies so they cannot choose their curriculum or their teachers. Teachers have permanent status on public schools. On the other hand private schools feel obligated to monitor their own quality since parents as customers always monitor and judge the process. So private schools
22
give great importance choosing the best for their schools in terms of teachers‟ quality, educational materials etc. Furthermore, researchers claim that since teachers in private schools do not have permanent status in schools, they are more concerned with their high performance when comparing with public school teachers.
Furthermore, for most of the countries, PISA results generally show that private schools are more advantageous than public schools in terms of student success (OECD, 2012). So as identified, the result of this study may eventually be affected by the quality distinctions of public (MoNE) and private (PYP) schools.
How do MoNE and PYP curricula handle fractions?
To be able to compare the results of the two curricula and hence make an
interpretation about them, we need to know how the two curricula that we worked on handle the topic of fractions in their own frames. It is significant to learn how 4th graders‟ fraction teaching has developed throughout the grades 1 to 4.
Fractions in MoNE curriculum
The below information aimed to show how many teaching objectives and lesson hours were spared for fractions and how much percentage of whole curriculum was occupied by fractions (MEB, 2009). The below information was gathered from the curriculum framework of MoNE that was published in 2009. There have been some changes in the curriculum in 2013. However, the changes were applied to first graders and have followed them through consecutive years. So, in the time the data were collected, fourth graders were not affected by the changes. Due to this reason, new changes in the curriculum were not considered in the research.
23
Teaching Objectives:
1. Students can explain the whole, half and the quarter.
3rd grade: 4 teaching objective, 10 lesson hours, percentage in whole curriculum: 7%
Teaching Objectives:
1. Students can partition a whole into equal parts and can express parts as the fractions.
2. Students can obtain fractions whose nominator is less than the denominator (proper fractions) by using natural numbers up to 2 digits.
3. Students can compare at most 3 fractions whose denominators are natural numbers up to 2 digits.
4. Students can identify any part of the whole that is expressed by a proper fraction.
4th grade: 13 teaching objective, 27 lesson hours, percentage in whole curriculum: 19%
Teaching Objectives:
1. Students can name the fractions as proper, improper, or mixed fractions whose nominators and denominators are natural numbers with up to 2 digits. 2. Students can place the fractions whose nominators and denominators are
natural numbers with up to 2 digits on the number line. 3. Students can compare fractions.
24
4. Students can compare at most 4 fractions whose denominators are the same and the nominators are different from smallest to largest or from largest to smallest.
5. Students can compare at most 4 fractions whose nominators are the same and the denominators are different from smallest to largest or from largest to smallest.
6. Students can identify any part of the whole that is expressed by a proper fraction.
7. Students can add up two fractions whose denominators are same.
8. Students can subtract a fraction from another whose denominators are same. 9. Students can work out real world problems that include addition and
subtraction on fractions.
10. Students can express a decimal number when a whole is divided into 10 or 100 equal parts.
11. Students can express decimal numbers by using decimal point.
12. Students can name the whole part and the decimal part of decimal numbers 13. Students can compare up to 2 decimal numbers by using <, > or = signs.
Fractions in PYP curriculum
Even though in MoNE curriculum the scope and sequence is clear in terms of grade levels and teaching objectives for each grade, the PYP sequence does not offer such information. According to International Baccalaureate Primary Years Program mathematics program (IB, 2009), the mathematics skills that students are expected to gain are split into different developmental processes that are called phases. Those phases that learners go through are not directly related with age and grade levels, so they are not linear. Also the way that PYP curriculum handles mathematics topics is
25
different than MoNE‟s too. Primary school mathematics content is also split into five strands: numbers, measurement, data handling, shape and space and pattern and function. Since the topic fractions are dealt in chapter numbers, we are going to examine this chapter with its phases and learning outcomes.
Fraction teaching starts from phase 2. In this phase, students are expected to have an understanding of fractions as a part of a whole, to model fractions with part-whole relationship, and to use fraction names on a daily life base. In the following phase, in phase 3, students are able to understand the relation between fractions and decimals, model equivalent fractions and decimal fractions to hundredths and beyond. Also they are expected to model, read, write, compare and order fractions, and use them in real life situations. Also they learn to carry out basic operations, addition,
subtraction, multiplication and division with fractions and solve problems involving fractions operations. Finally for the phase 4, students learn the relationship of
fractions with decimals and percentages, they model, compare, read, write, order and convert fractions into decimals and percentage. They use mental and written
strategies to solve problems that include fractions, decimals and percentages. The detailed explanations, the conceptual understanding and the learning outcomes of each phase were also given below.
An earlier mathematics programme which was published by International
Baccalaureate in 2003 gives more detailed teaching objectives with their targeting age groups. Unlike the MoNE curriculum report, the total lesson hours and number of teaching objectives were not specified for PYP framework. Also instead of grade levels, the objectives are given according to the age groups. The details are as following:
26
Age group: 3-5 years
There is no fraction teaching between these ages.
Age group: 5-7 years
1. Read and write the time to the hour, half hour and quarter hour:
How can knowing about fractions help us to tell the time.
Age group: 7-9 years
1. Compare fractions using manipulative and using fractional notation:
Can different fractions be equal?
How can we know when one fraction is greater than, smaller than or
equal to another?
2. Model addition and subtraction of fractions with the same denominator:
How can we add and subtract fractions?
3. Use mathematical vocabulary and symbols of fractions: numerator, denominator, equivalence:
How do mathematicians write fractions?
What is a numerator?
What is a denominator?
4. Understand and model the concept of equivalence to 1: two halves = 1, three thirds = 1:
27 What is equivalence?
Can you show fractions equivalent to 1?
What patterns do you see in equivalence to 1?
Age group: 9-12 years
1. Read, write and model addition and subtraction of fractions with related denominators:
What is a fraction?
How does a fraction relate to a whole number?
How is a fraction represented?
How can we add and subtract fractions of different sizes?
2. Read, write and model improper fractions and mixed numbers:
What is an improper fraction?
What is a mixed number?
How are improper fractions and mixed number connected?
3. Compare and order fraction:
How do we know that a fraction is smaller/bigger than another?
How can two fractions be compared?
28
4. Model equivalency of fractions: 2/4 = ½
Why are these two fractions the same?
What patterns do you see in equivalent fractions?
5. Simplify fractions:
Why do we simplify fractions?
What mathematical understandings do we use to simplify fractions?
6. Use the mathematical vocabulary of fractions: improper, mixed number:
What is the language of fractions?
How is the language of fractions connected to other mathematical
language?
7. Read, write and model the addition and subtraction of decimals to the thousandths:
What is the connection between fractions and decimals?
How is a decimal a fraction?
How does addition and subtraction work with decimals?
How is this connected to what you know about place value?
8. Read, write and model multiplication and division of decimals (with reference to money):
29
What happens to the values when they are multiplied/divided by
multiples of 10?
9. Round decimals to a given place or whole number:
Why do we want to round to decimal places?
When do we need to be less precise/more precise?
10. Read, write and model percentages:
What is a percentage?
To what do percentages relate?
What are real-life examples of percentages?
Why are percentages used in mathematics?
11. Interchange fractions, percentages and decimals:
How are percentages, fractions and decimals related?
Why can there be an interchange between there?
How can we work out how much we are saving when buying sales
articles?
How are MoNE and PYP different in teaching fractions?
Some differences between the way MoNE and PYP curriculum handle fractions attract the attention. Some of these points are as following:
30
1. PYP curriculum starts teaching fractions earlier than MoNE curriculum. While MoNE introduces fractions firstly in second grade (at the age of 8) PYP students first encounter fractions at the age of 5-7.
2. In the first steps of fractions, PYP curriculum focuses on using the real life context such as telling the time as a tool to teach wholes, halves and quarters while there is no such a stress on MoNE curriculum.
3. Throughout the whole PYP framework, there are engaging and compelling questions that guide teachers such as “What is equivalence?”, “Can you show fractions equivalent to 1?” or “What patterns do you see in equivalence to 1?” On the other hand, MoNE curriculum gives no specific emphasis on the “equivalence to 1” concept and prefers to indicate this objective as “Students can explain wholes, halves and the quarters.”
4. PYP curriculum framework specifies the terms such as patterns, modeling and manipulative which are essential and significant on fractions teaching while MoNE only shares objectives and gives no suggestions about how to teach.
It should be also indicated that the curriculum cannot be the only parameter that affects teaching quality. Besides, teacher‟s effort, family interventions and support, schools environment, etc. are some of the other factors that might affect the correct and permanent learning.
Summary
In this chapter related literature on some topics were investigated such as, what a misconception is, how and why it occurs, why it is important to work on them, some specific types of misconceptions and why they were preferred to be investigated, the
31
importance of fractions in the curricula, how PYP and MoNE schools can differ in terms of curricula content and other factors. Common results received from the related literature can be summarized as:
1. Misconceptions in mathematics exist and prevent students‟ permanent and meaningful learning (Johnston & Gray, 1999; Swan, 2001;
Henriques, 2002; Wescott & Cunningham, 2005; Çardak, 2009). The diagnosis and correction of misconceptions are important to prevent math anxiety and to promote deep and long lasting learning (Keazer, 2004; Chick and Baker, 2005).
2. Fractions are considered significant because of their connection with other algebraic topics and the wide applications in real life (D‟Ambrosio & Mewborn, 1994; Mack, 1995; Keizjer & Terwel, 2001).
3. Fractions are also known as one of the topics that students tend to develop misconceptions about. In particular the attempt of applying whole number knowledge can cause fractions misconceptions (Saxe et al., 2005; Nunes et al., 2006; Lee, 2008; Van de Walle et al, 2010, p. 287).
4. Some specific sub topics of fractions such as partitioning, ordering and addition are the common topics that 4th grade MoNE and PYP students are taught (MEB, 2009; IBO, 2009).
5. MoNE and PYP curricula have some distinctions in their philosophies and objectives (MEB, 2009; IBO, 2009; OECD, 2012; Campbell et al., 2014). Private and public school difference is also another factor that might affect the variation between these the two curricula (Dinler & Subasi, 2003; Cinoglu, 2006). This variation between PYP and MoNE curricula might affect their education quality as well.
32
Based on the literature given in this chapter, significance of investigating the level of misconception of students who are taught with two different curricula was
33
CHAPTER 3: METHOD
Introduction
This chapter describes the strategy of analysis and provides details about the design, sampling and participants. Chapter also explains how the researcher developed the instrument to detect the misconceptions of MoNE and PYP students taught at 4th grade. The information about the data collection from MoNE and PYP schools is also described. Finally, data analysis explains how the difference between MoNE and PYP students‟ response patterns were investigated.
Research design
The present study only used a one-lesson-hour fractions test that was developed by the researcher to gather the quantitative data concerning the target sample. Due to this, it could be considered that the study uses cross-sectional design and provided a „snapshot‟ of the frequencies and characteristics of misconceptions that 4th
grade students had (Babbie, 1990; Creswell, 2003). The test that was used to collect quantitative data included 27 items, 9 items from each of the three categories of misconceptions, and the items in the test included both multiple choice items and open-ended problems that included real word context such as cake and pizza slices.
Context
The present study was carried out at 4 schools in Ankara, Turkey. Among these four schools, two schools were private schools; Bilkent Laboratory and International School (BLIS) Ihsan Doğramacı Foundation Bilkent Primary School. Other two schools were public schools; National Education Foundation Batıkent Primary
34
School and Batıkent Primary School. The two private schools chosen for the present study were two of the only three PYP schools in Ankara. As for the two MoNE schools are concerned, they were chosen with the convenience sampling from all the schools situated in Batıkent, Ankara because of the ease of access.
It should also be noted that private schools and public schools may have some differences with regard to the students‟ profile. Students who attend private schools tend to have higher socio-economic background than those who attend public schools (OECD, 2012). With a few exceptions, in most of the PISA-participant countries and economies, including Turkey, more advantaged students seem to be attending privately managed schools (OECD, 2012).
Participants
The research was conducted in April 2013 with 4th grade students from 4 schools (n=264). Among these 264 students, 112 were PYP students while 152 were MoNE students. 37 students participated from BLIS. Also, 75 students tested from I.D.F Bilkent Primary School. 58 students participated from N.E.F Batıkent Primary School and 23 of them were female and 35 of them were male. Additionally, 94 students that were tested from Batıkent Primary School consisted of 45 female and 49 male students. As their educational policy, two PYP schools did not prefer to share the additional gender information about students.
Instrumentation
For the present study, a fractions test was developed to measure students‟ misconceptions on the topic of fractions. Partitioning, ordering and addition on fractions were included in the test since these sub-topics were the only ones that were covered by both MoNE and PYP curriculum at 4th grade level. The items were
35
chosen after considering the related literature on misconceptions, MoNE and PYP textbooks. In particular, questions that students most tend to be mistaken were included in the test. Within this period, the book Elementary and Middle School
Mathematics: Teaching Developmentallyby Van de Walle, Karp and Bay-Williams
provided handful tips with educational research studies and served as the main resource.
The misconceptions test that was developed by the researcher was shown to be valid based on expert opinions as well as quantitative analysis. The items 12 to 16 were used for validity analysis. Percentage of students who had misconceptions in at least 4 out of 5 items was found to be % 75.7. Students who provided responses with misconceptions in at least 3 items out of 5 had a percentage of 79.6. High level of misconceptions was detected by similar items. So, this can be considered as evidence for validity of instrument.
As for the expert reviews, the test was firstly checked by an expert who was a mathematics teacher. The expert who reviewed the instrument was experienced in primary school mathematics. He had a PhD degree in mathematics teaching and also was working as a mathematics teacher trainer at university. He advised to include fraction questions related to the sets, area and length to enrich the variety. He also suggested using active voice in question statements and supporting some questions with pictures. He also reviewed the language to make items clearer to students.
The items were also checked by another expert who works as a primary school mathematics teacher and a coordinator at a PYP school. She corrected some parts that caused contradictions, for example asking first about cakes and then about brownies, etc. She also asked to take the conversion in the last question out since
36
asking „pounds‟ to be changed to „kilograms‟ would be irrelevant for a test that evaluated the misconceptions on the topic of fractions.
The test was composed of 27 items with all the sub-items. The number of the items was 35 at first; however it was reduced based upon the advice of the same expert who has experience in both primary school and university. After his feedback, considering the age group and the possible concentration time for this age group, the number of items was decreased to 27. Because of their young age, students might have developed anxiety or boredom towards the large number of items. So the sub-items were created and only the leading sub-items were numbered. So, from the students‟ point of view, there were only 13 items in the test which was actually a more
appropriate number of items for 4th grade students. When the test was finished, students actually solved 27 items in total with the sub questions as well.
So, Appendix A and B represent the tests that students went through (English and Turkish versions respectively). Besides, Appendix C is the one that readers should follow since it includes the actual item numbers separately as the researcher used while analyzing the data.
Since the research was planned to be conducted both in Turkish public schools and private PYP schools that use English as a medium of education, the instruments Turkish and English versions were needed. The instrument was firstly prepared in English and 3 expert views were taken to validate the instrument‟s English version. The experts were all teachers, two mathematics and one statistics, who are fluent in English and also have teaching experience in both languages. The expert views made some corrections related to the comprehensibility of the language used in the
37
add/drop changes were done. For example, changing pumpkin pie to apple pie since pumpkin pie would be too irrelevant to Turkish culture.
After this step, the researcher translated the instrument into Turkish for MoNE students. The Turkish version was checked out by one of the other expert, who was a native English and Turkish mathematics teacher. The necessary changes were done through the feedback and the developed Turkish instrument was sent to other two experts who had also given feedback on the English version. They were asked to check the coherence between the Turkish and English version. Again, some changes were made with the aid of feedback and both Turkish and English instruments took their final forms. The English Fractions Test can be found in Appendix A, and the Turkish Fractions Test is in Appendix B.
27 items in the test were divided into three misconception categories as partitioning, ordering and addition. These sub-categories were determined from the related
literature with regards to common objectives of MoNE and PYP curricula. However, the test did not contain any headings or parts that specify the categories in order not to interfere with students‟ thinking.
The first category among the 27 items, partitioning category, aimed to measure whether students know the importance of equal partitioning or not. Students, who failed to learn this, tend to think that a shape can be divided into non-equal-sized pieces and these pieces can state a fraction (Empson, 2001; Cramer & Whitney, 2010). Students were given 9 items for this category and asked to find out which figures express the given fraction values. The students who chose the non-equal-sized figures were considered as having a misconception on partitioning.
38
For the second category, ordering category, 9 items were developed. These 9 items aimed to measure students‟ understanding of ordering on fractions whose nominators are equal but denominators are different. The fractions that students were asked to order did not include the fractions that have the different denominators since 4th grade objectives did not include it either in MoNE or PYP curricula. Since students attempt to continue with whole number ordering conception, they tend to choose the fraction with bigger denominators as the greater one among the fractions with equal nominators and different denominators (Nunes et al., 2006; Cramer, Wyberg, & Leavitt, 2008; Van de Wall et al., 2010, p. 300).
The third and the last category, add tops-add bottoms category, was included since most students carry out operation in fractions as they did in whole numbers (Lappan & Mouck,1998; Cramer & Whitney, 2010). Since they attempt to add fractions as they add whole numbers they may skip the fact that addition fractions do not mean adding the denominators of fractions straightforwardly. Similar with other two categories, 9 items were designed for this category.
Method of data collection
The participants of MoNE schools were administered the test developed by the researcher. In both MoNE schools, firstly the administration and teachers of the school have been informed about the required permissions granted by MoNE. Having permission from class teachers to take over one lesson hour for each class, the test was administered by the researcher in one class after another. Students in each class were briefly informed about the aim, content, significance and the privacy of the study. The students were told that the results of the test will not be shared with teachers or parents. In all classes of MoNE schools students finished in almost 30
39
minutes. For the two PYP schools, the administrator and class teachers decided to deliver the test themselves. They were also asked to briefly inform students about the aim, content, significance and the privacy of the study as well. They were also asked to give students 30 minutes to complete the test. The administered tests were taken back by the researcher afterwards.
Method of data analysis
After the data were collected from 4 schools, they were transferred into SPSS to carry out the necessary analyses. The curriculum types were coded as MoNE and PYP curriculum. All the students who participated to the study were asked to
complete the whole test, yet there were some missing responses which were kept and any treatment was not done on data. Since the missing rates for the responses were not so high, no statistical procedure was conducted to handle them. Table 1shows the missing data numbers and percentages for every item.
Table 1
Missing rates for the items Item # Number of missing responses % of missing responses Item # Number of missing responses % of missing responses 1 0 0 15 0 0 2 0 0 16 0 0 3 0 0 17 6 2.3 4 0 0 18 12 4.6 5 0 0 19 1 0.4 6 0 0 20 1 0.4 7 0 0 21 1 0.4 8 10 3.8 22 2 0.8 9 2 0.8 23 1 0.4 10 16 6.1 24 1 0.4 11 1 0.4 25 10 3.8 12 0 0 26 13 4.9 13 0 0 27 9 3.4 14 1 0.4