improvement using high concentration of hydrochloric acid and high
temperature
Article in Fresenius Environmental Bulletin · June 2006
CITATION 1 READS 124 3 authors, including: Ibrahim Sahin 8PUBLICATIONS 57CITATIONS SEE PROFILE Nuri Nakiboğlu Balikesir University 19PUBLICATIONS 154CITATIONS SEE PROFILE
DETERMINATION OF ARSENIC BY CATHODIC
STRIPPING VOLTAMMETRY: SENSITIVITY
IMPROVEMENT USING HIGH CONCENTRATION
OF HYDROCHLORIC ACID AND HIGH TEMPERATURE
İbrahim Şahin1, Nuri Nakiboğlu2 and Zeki Tünay2
1Balıkesir University, Necatibey Education Faculty, Chemistry Education Division, 10145 Balıkesir, Turkey 2Balıkesir University ,Science and Art Faculty, Chemistry Department, 10145 Balıkesir, Turkey
SUMMARY
A sensitivity improvement for arsenic determination in the presence of copper by cathodic stripping voltammetry, using a high concentration of hydrochloric acid (3 mol/L)
and high cell temperature (40 oC), is described. The
opti-mum conditions were established, and LOD and LOQ for determination of As(III) were calculated from the calibra-tion curve to be 7 ng/L and 22 ng/L, respectively. The accu-racy of the method was checked by analyzing a certified reference material (LGC 6010-Hard Drinking Water). The method was applied to drinking water samples in Balıkesir city of Turkey.
KEYWORDS:
arsenic, cathodic stripping voltammetry, drinking water.
INTRODUCTION
Arsenic in nature is present in both organic and inor-ganic forms, and arsenic contamination risks of food, plants, air and drinking water have been increased by human activi-ties. Toxicity of arsenic is dependent on its chemical form. It is generally accepted that soluble inorganic arsenicals are more toxic than the organic ones, and As(III) is more toxic than As(V). Both the EPA and International Agency for Research on Cancer (IARC) have classified inorganic arse-nic as a known human carcinogen. On the other hand, it has been considered as an oligo-element with unknown physio-logical function because of its presence in living organisms [1]. But, there is no conclusive evidence of arsenic essen-tiality in humans, while it is an essential nutrient for ani-mals, such as minipigs, goats, chicken, hamsters and rats [2]. The World Health Organization (WHO) standard for
arsenic is 10 µg/L for drinking water, and those in Canada, the European Union and Australia are 25 µg/L, 10 µg/L and 7 µg/L, respectively [3]. According to the Agency for Toxic Substances and Disease Registry (ATSDR), provi-sional minimal risk levels of arsenic are 5 and 0.3 µg/kg/day for acute and chronic oral exposure, respectively [1, 2]. Therefore, it is important to have simple, cheap, sensitive and accurate methods for the determination of arsenic in different samples.
Arsenic levels have been determined by a wide variety of methods, such as ultraviolet (UV) spectrometry, atomic absorption spectrometry (AAS); mainly coupled to hydride generation (HG-AAS) or electro-thermal atomization in graphite furnace (ET-AAS), atomic emission spectrometry (AES), generally with inductively coupled plasma (ICP-AES), inductively coupled plasma-mass spectrometry (ICP- MS), atomic fluorescence spectrometry (AFS), X-ray spec-trometry, neutron-activation analysis (NAA) [6, 7], and stripping techniques including anodic stripping voltam-metry (ASV) [7-12], cathodic stripping voltamvoltam-metry (CSV) [7, 14-21] and stripping potentiometry [22]. However, it is well-known that stripping techniques present low invest-ment and maintenance costs with good precision, accuracy and sensitivity. Therefore, arsenic determinations in water, food and some plant samples have been recently made using stripping techniques [7-22]. Among these techniques, CSV is the most sensitive one. Holak [13] developed a CSV technique for the determination of As(III) in the presence of Se(IV), forming inter-metallic compounds in acidic me-dia and depositing them on the hanging mercury drop elec-trode (HMDE) [13]. It has been also described a similar one in different studies using Cu(II) in various concentra-tions instead of Se(IV), and applied to water samples [14-17]. Furthermore, CSV procedures have been used for the determination of As(V) in acidic medium containing man-
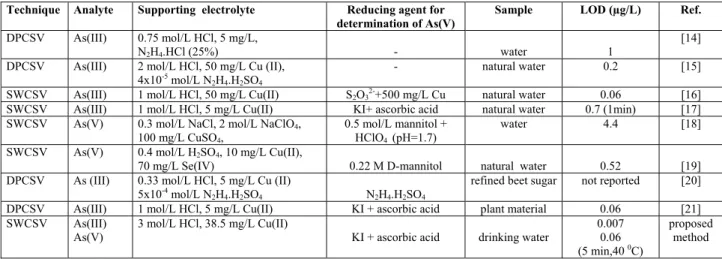
TABLE 1 - Some CSV methods for the determination of As in various samples. Technique Analyte Supporting electrolyte Reducing agent for
determination of As(V) Sample LOD (µg/L) Ref.
DPCSV As(III) 0.75 mol/L HCl, 5 mg/L,
N2H4.HCl (25%) - water 1
[14]
DPCSV As(III) 2 mol/L HCl, 50 mg/L Cu (II),
4x10⁻⁵ mol/L N
2H4.H2SO4
- natural water 0.2 [15]
SWCSV As(III) 1 mol/L HCl, 50 mg/L Cu(II) S2O32-+500 mg/L Cu natural water 0.06 [16]
SWCSV As(III) 1 mol/L HCl, 5 mg/L Cu(II) KI+ ascorbic acid natural water 0.7 (1min) [17]
SWCSV As(V) 0.3 mol/L NaCl, 2 mol/L NaClO4,
100 mg/L CuSO4,
0.5 mol/L mannitol + HClO4 (pH=1.7)
water 4.4 [18]
SWCSV As(V) 0.4 mol/L H2SO4, 10 mg/L Cu(II),
70 mg/L Se(IV) 0.22 M D-mannitol natural water 0.52 [19]
DPCSV As (III) 0.33 mol/L HCl, 5 mg/L Cu (II)
5x10⁻⁴ mol/L N
2H4.H2SO4 N2H4.H2SO4
refined beet sugar not reported [20]
DPCSV As(III) 1 mol/L HCl, 5 mg/L Cu(II) KI + ascorbic acid plant material 0.06 [21]
SWCSV As(III) As(V)
3 mol/L HCl, 38.5 mg/L Cu(II)
KI + ascorbic acid drinking water
0.007 0.06 (5 min,40 0C)
proposed method DPCSV: Differential Pulse Cathodic Stripping Voltammetry, SWCSV: Square Wave Cathodic Stripping Voltammetry, LOD: Limit of Detection
nitol and Cu(II) [18], or mannitol, Cu(II) and Se(IV) [19]. A few CSV applications reported on As analysis in refined beet sugar and plant material, in the presence of Cu(II) [20, 21]. Some arsenic CSV determination methods with differ-ent detection limits are summarized in Table 1, with regard to different experimental conditions in the various samples. The main purpose of this work was to investigate whether the sensitivity of CSV arsenic determination can be further improved by changing critical experimental pa-rameters, such as copper concentration, hydrochloric acid concentration, cell temperature, deposition potential, and deposition time. Indeed, this sensitivity could be improved by using a high HCl concentration at high cell temperatures.
MATERIALS AND METHODS Apparatus and Reagents
Voltammetric measurements were carried out with a Radiometer Pol 150 Polarographic Analyzer, connected to a MDE 150 polarographic stand, controlled with a PC via Trace Master 5 software. HMDE was used as working
electrode, whereas a platinium rod and a Ag/AgCl, KClsat
elec-trode were used as auxiliary and reference electrodes, respectively. Hexadistilled mercury (Radiometer-Copen- hagen) was used for HMDE throughout the study.
The As(III) stock solution (1000 mg/L) was prepared
by dissolving 0.132 g As2O3 (Riedel, Germany) in 1 L
water, and that of As(V) (1000 mg/L) from a Titrisol am-pule (Merck, Darmstadt, Germany). Both solutions were
stored at 4 0C. The required standard solutions were
pre-pared daily by dilution of the stock solutions. Hydrochlo-ric acid (Merck) and sulphuHydrochlo-ric acid (Merck) were used for acidification without further purification. The other chemi-cals used throughout the study were of analytical grade. Hydrazinium sulfate was used to prevent oxidation of As(III) to As(V) and prepared daily. All the solutions were prepared with deionized water having the resistivity of 18.2 MΩ.
Various trademark drinking waters were collected from the market in Balıkesir city of Turkey. Surface water sam-ples were collected from the Dam Lake`s water treatment plant, at the input (untreated) and output (treated) in
Balıke-sir city of Turkey, and stored at 3 0C in 250 mL
polyethyl-ene bottles.
The flasks were cleaned by soaking them in 4 mol/L nitric acid solution for 24 h, and then excessively washing them with deionized water.
Procedure
In all experiments, aliquots of the standard solutions were transferred to voltammetric cell, and then, different amounts of the reagent solutions were added and the vol-ume was completed to 10 mL with deionized water. In all
measurements, 4x10⁻⁵ mol/L hydrazine sulfate was used
to protect the oxidation of As(III) to As(V) during deposi-tion step. The jacketed voltammetric cell was put into place
and temperature adjusted to 40 0C using a thermostat. Then
stripping was carried out using square wave mode after deposition step. All measurements were done in the pres-ence of dissolved oxygen, without nitrogen purging to shorten the analysis time [17]. For the analysis of samples, the test solution was placed in a voltammetric cell and di-luted to 10 mL with deionized water after addition of HCl,
Cu2+ and hydrazine sulfate, to give final concentrations of
3 mol/L, 38,5 mg/L and 4x10⁻⁵ mol/L, respectively. A new
mercury drop was extruded and arsenic deposited as inter-metallic compound at –400 mV for 300 s. The other in-strumental conditions were set as follows, SW frequency: 25 Hz, pulse amplitude:-50 mV, step amplitude:1 mV, step duration: 0.04 s, scan rate: 25 mV/s, stirring rate: 800 rpm, and waiting time: 20 s.
For determination of As(V) in drinking water, it was reduced to As(III) using a KI and ascorbic acid mixture as
reducing agent. For this purpose, 1 ml of conc. H2SO4 and
the mixture of KI and ascorbic acid (final concentrations
solution was allowed to stand for 10 min, in order to com-plete the reduction. This solution was analyzed as stated above by using As(V) standard solution for calibration.
RESULTS AND DISCUSSION
It has been reported that square wave (SW) voltage modulation is more sensitive than either differential pulse and linear sweep [15]. Therefore, SW voltage mode was used for experiments. The effect of SW frequency was also investigated for our experimental conditions. For this pur-pose, SW frequency was varied in the range between 2.5-200 Hz. The peak currently increased with SW frequency, but peak-broadening and signal noise were observed at frequencies higher than 25 Hz. Therefore, 25 Hz was se-lected as optimum frequency for subsequent experiments.
In previous studies, the methods using various
con-centrations of hydrochloric acid (CHCl) and copper (II) (CCu)
for As determination by CSV have been reported (see Table 1). As it can be seen in Table 1, these methods have different detection limits. Therefore, the critical parame-ters were re-optimized to improve the sensitivity.
Influence of hydrochloric acid concentration
Hydrochloric acid is the most suitable and widely used supporting electrolyte in electrochemical stripping deter-mination of arsenic. It is well-known that the use of higher HCl concentrations increase the stripping signals of
arse-nic [8, 15, 22]. HCl concentration (CHCl) was varied to
obtain the optimum one, and the results are shown in Fig-ure 1. Three plateaus indicating the probable formation of a stable Cu-As inter-metallic compound were observed. The
peak current has increased dramatically with CHCl after the
second plateau, then increased slightly giving a maximum at 3 mol/L, and finally decreased. A positive shift in peak
potential (~25 mV) was observed at increased CHCl levels
from 1 mol/L-3 mol/L. Baseline deterioration and signifi-cant peak-broadening affecting the analysis were not
ob-served at higher CHCl.
The effect of deposition potential
The other significant parameters affecting accuracy
and sensitivity of the method are deposition potential (Ed),
deposition time (td), and copper concentration (CCu). In
previous studies, these parameters were suggested to be
dependent on each other, and CCu oppositely proportinal
to td [15, 16].
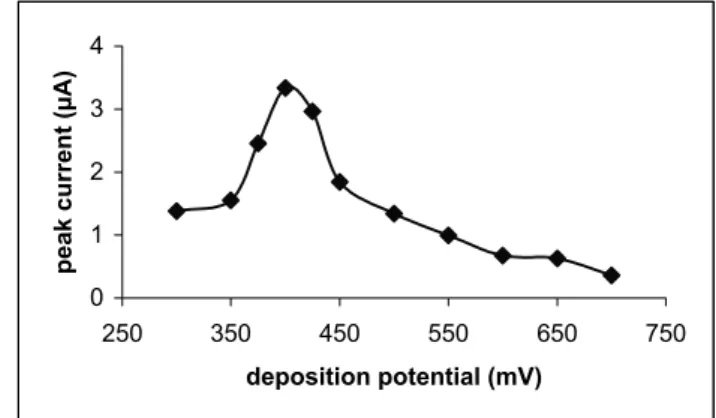
Figure 2 illustrates the variation of peak current as a
function of Ed. It can be seen that the peak current was
in-creased with Ed, a maximum at –400 mV, and then
de-creased at more negative values. This current decrease has been attributed to the reduction reaction of As(0) to arsine being faster than the reaction between arsenic and copper. It has also been reported that As-Cu inter-metallic com-pound in different stoichiometry is the other factor decreas-ing the peak current at more negative potential [15]. In
our study, we observed a shift in peak potential, when the
variation of Ed was performed sequentially in the same
solution, whereas no shift was observed by changing the solution for each measurement. These observations suggest that the reaction between arsenic and copper is not plete, and the stoichiometry of As-Cu intermetallic
com-pound depends on time as well as Ed. (-400 mV was chosen
for optimum Ed, which is the same given in literature).
0 2 4 6 8 0 1 2 3 4 5 Concentration of HCl (M) pe ak c ur re nt ( uA )
FIGURE 1 - The variation of peak current as a function of HCl concentration: As(III) 20 µg/L, CuCl2 40 mg/L, hydrazine sulfate 4x10⁻⁵ mol/L, Ed = -400 mV, td 60 s, cell temperature 22.9 (±0.1 0C), and stirring rate 800 rpm.
0 1 2 3 4 250 350 450 550 650 750 deposition potential (mV) pea k current (µ A)
FIGURE 2 - The variation of peak current as a function of deposition potential: As(III) 10 µg/L, HCl 3 mol/L, CuCl2 40 mg/L, hydrazine sulfate 4x10⁻⁵ mol/L, td 60 s, cell temperature 22.9 (±0.1 0C). The effect of copper concentration
The variation of peak current with Cu(II)
concentra-tion (CCu) is shown in Figure 3. The peak current increased
with CCu, and reached a maximum at 37.5-40 mg Cu(II)/L.
Current decreasing and leveling-off was observed, when
CCu was further increased. Therefore, optimum CCu was
selected to be 38.5 mg/L. Different CCu values have been
selected in several studies, such as 5 mg/L [14, 17, 20, 21], and 50 mg/L [15, 16]. Furthermore, we also observed that
the CCu value, corresponding to the maximum peak current,
depends on Ed.
The effect of deposition time and cell temperature
It was reported that a decrease in peak current and some changes in voltammograms, such as potential shift towards
negative values and peak-broadening resulting in splitting, are observed for longer deposition times [17], and addition-ally, similar effects occur when copper concentration is in-creased. These alterations have been attributed to a change in the stoichiometry of As-Cu deposits at the electrode sur-face. Figure 4 shows the variation of peak current as a
func-tion of td for an initial CCu.of 38.5 mol/L The peak current
has increased with td giving a maximum at 60 s, then
de-creased and remains constant at further inde-creased deposi-tion times. It was also observed from the studies performed
for different CCu and td values that the optimum td depends
on CCu. Therefore, the selection of these parameters is
important to obtain good precision and sensitivity.
0 2 4 6 8 10 0 10 20 30 40 50 60 Concentration of Cu(II) (mg/L) peak cu rr en t ( uA )
FIGURE 3 - The variation of peak current as a function of Cu(II) concentration: As(III) 20 µg/L, HCl 3 mol/L, deposition potential -400 mV, hydrazine sulfate 4x10⁻⁵ mol/L, deposition time 60 s, and cell temperature 22.9 (±0.1 0C). 0 0,5 1 1,5 2 0 20 40 60 80 100 120 140 160 depositon time pea k current ( uA )
FIGURE 4 - The variation of peak current as a function of deposition time: As(III) 5 µg/L, HCl 3 mol/L, CuCl2 38.5 mg/L, deposition potential -400 mV, hydrazine sulfate 4x10⁻⁵ mol/L, and cell tempera-ture 22.9 (±0.1 0C).
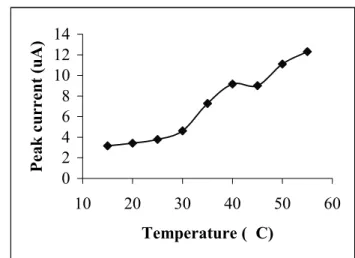
The effect of cell temperature was also examined in order to improve sensitivity of the method. Figure 5 shows the variation of peak current as a function of cell tempera-ture. The peak current has increased with cell temperature and no peak deterioration and splitting were observed in
3 mol/L HCl at 50 oC. However, a slight negative shift in
peak potential was observed at high temperatures On the
other hand, non-systematic peak deterioration and
split-ting were observed in 1 mol/L HCl at ≥30 oC. This result
indicates that the sensitivity can be improved in the pres-ence of 3 mol/L HCl by using high temperatures as well as increasing deposition times. The optimum cell
tem-perature was selected to be 40 oC. However,
nonsystem-atic potential shift and peak splitting were observed at 60 s
for td and 38.5 mol/L for CCu, for arsenic concentrations
below 0.1 µg/L, when high temperature was used to im-prove sensitivity. It is noteworthy that these observations are opposite to those reported above. On the other hand, a well-defined peak was obtained for low arsenic
concen-trations, when long td was used at high temperature. For
this reason, td was selected to be 300 s for low arsenic
concentrations at high temperature.
0 2 4 6 8 10 12 14 10 20 30 40 50 60 Temperature ( C) P ea k cu rren t ( uA)
FIGURE 5 - The variation of peak current as a function of cell temperature: As(III) 10 µg/L, HCl 3 mol/L, CuCl2 38.5 mg/L , hydrazine sulfate 4x10⁻⁵ mol/L, deposition potential -400 mV, and td 60 s.
Analytical Characteristics of the Procedure and Application to Drinking Water Samples
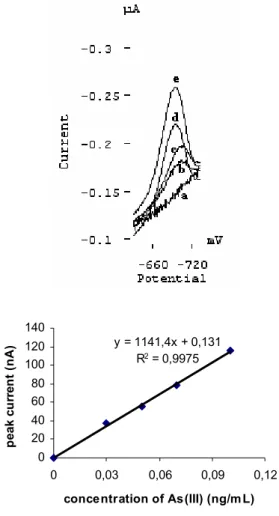
Under the optimum conditions achieved, a linear cali-bration curve
Ip(nA) = 1141.4CAs(µg/L) + 0.131
with a regression coefficient of 0.9987 was obtained at
40 0C and t
d = 300 s. By using standard deviation about
regression (sy/x) instead of standard deviation of blank (sB),,
as described elsewhere [23], the limit of detection (LOD) and limit of quantification (LOQ) were calculated from the calibration curve to be 7 ng/L and 22 ng/L, respectively. The voltammograms obtained from these measurements and the calibration curve are given in Figure 6. The relative stan-dard deviation for five replicate measurements of 60 ng As (III)/L was found to be 8.7 %.
On the other hand, for As(V) determination, a potas-sium iodide-ascorbic acid mixture was used as reducing agent. For this purpose, solutions with different
concen-trations of both chemicals, ranging between 8 x 10⁻³-6.4 x
y = 1141,4x + 0,131 R2 = 0,9975 0 20 40 60 80 100 120 140 0 0,03 0,06 0,09 0,12 concentration of As(III) (ng/m L) p eak c u rr en t (n A )
FIGURE 6 - Voltammograms and calibration curve obtained at high temperature (0-0.1µg/L As(III), td= 300 s,T = 40 0C).
The best results were obtained for potassium iodide/
ascorbic acid, each at 2.4x10⁻² mol/L. The efficiency of
As(V) reduction to As(III) was also investigated, and 10 min seem to be sufficient for complete reaction.
A calibration curve was plotted at the same conditions for determination of As(V) after reduction of As(V) to As(III). The equation of the calibration curve is:
Ip(nA/mV)= 55.13CAs(ng/mL) + 0.75
with a regression coefficient of 0.993 between 0-0.3 ng/ mL of As (V). LOD and LOQ were calculated to be 60 ng/ L and 200 ng/L, respectively. The relative standard devia-tion for five replicate measurements of 200 ng/L As (V) was found to be 6.2 %. The different LOD and LOQ val-ues of the two curves are attributed to the presence of po-tassium iodide and ascorbic acid in the solution.
The proposed conditions were validated by the analy-sis of certified reference material (LGC6010-Hard Drink-ing Water). The arsenic content of this material (certified value for As = 55±5 for 95% confidence level) was found to be 57±4 in average (95% confidence level) for seven in-dependent determinations (RSD = 6 %). Statistical evalua-tion of the results using Student’s t-test (at 95% confidence
level) show that there are no significant differences in the results. The method applied to real samples, and the re-sults obtained are given in Table 1.
TABLE 1 - As(III) and As(V) contents of various drinking water samples and recovery rates (R). Sample As(III) added As(V) added As(III) found As(V) found
R (%) for As(III) R (%) for As(V) DW-B 1 - - nd 1.8±0.2 DW-B 1 0.8 2.5 87.5 DW-B 2 - - nd 5.2±0.5 DW-B 3 - - nd nd - - DW-B 3 0.06 0.05 nd 83.3 DW-B 4 - - nd nd - - DW-B 5 - - nd nd - - DLW-untreated nd 16.7±0.6 DLW-treated nd nd
DW-B: drinking water in bottles, DLW: Dam lake’s water (concentra-tions are expressed in µg/L, and the standard devia(concentra-tions corresponding to three independent analyses are also reported).
As(III) was not detected in all of the samples, but As(V)
was found in two drinking water samples (1.8 ± 0.2µg l-1
and 5.2 ± 0.5 µg l-1 - N = 5, 95 % confidence level). The
amount of As(V) was determined to be 16.7±0.6 in un-treated Dam lake’s water. However, As(V) was not found in treated water samples. The results show that arsenic is absorbed on the filter during coagulation-assisted micro-filtration of treated water, and arsenic contents of the water
samples analyzed are below 10 µg l-1, recommended by
WHO. However, it must still be monitored.
CONCLUSIONS
We have presented a modified CSV method for
As(III) determination, using 3 mol HCl/L at 40 oC,
im-proving its sensitivity approx. ten-fold, when compared to the present methods. However, a decrease in linearity of calibration curve was observed at high temperatures. The method is suitable for trace amounts of inorganic arsenic in water samples. Additionally, it has been demonstrated that the peak current increases with the increase of cell tempera-ture without peak deterioration and splitting in 3 mol HCl/ L, whereas non-systematic peak deterioration and peak splitting occur in 1 mol/L HCl at high temperature. On the
other hand, it was found that the conditions optimized (CHCl:
3 mol/L, CCu: 38.5 mg/L, Ed: -400 mV, and td: 60 s) are also
valid at room temperature.
ACKNOWLEDGEMENT
The authors thank the Balıkesir University Research Center of Applied Sciences (BURCAS) for providing labo-ratory facilities.
547 REFERENCES
[1] Cava-Montesinos, P., Cervera, M.L., Pastor, A.,and de la Guardia. M.. (2003) Determination of arsenic and antimony in milk by hydride generation atomic fluorescence spec-trometry. Talanta 60, 787-799.
[2] Mitrakas,M. (2001) A survey of arsenıc levels in tap, under-ground and thermal mineral waters of Greece. Fresen. Envi-ron. Bull. 10 (9), 717 – 721.
[3] Thirunavukkarasu, O.S., Viraraghavan, T. Subramanian, K.S. and Tanjore, S. (2002) Organic arsenic removal from drink-ing water. Urban Water 4, 415–421.
[4] Agency for Toxic Substances and Disease Registry-Public Health Statement for Arsenic, September 2000
http://www.atsdr.cdc.gov/toxprofiles/phs2.html 2005/09/06 [5] Mandal, B.K. and Suzuki, K.T. (2002) Arsenic round the
world: a review. Talanta 58, 201-235.
[6] Gong, Z., Lu, X., Ma, M., Watt, C. and Le, X.C. (2002) Ar-senic speciation analysis. Talanta 58, 77-96.
[7] Hung, Dang Q., Nekrassova, O. and Compton, R.G. (2004) Analytical methods for inorganic arsenic in water: a review. Talanta 64, 269–277.
[8] Sun, Y., Mierzwa, J. and Yang, M. (1997) New method of gold-film electrode preparation for anodic stripping voltam-metric determination of arsenic(III and V) in seawater. Ta-lanta 44, 1379-1387.
[9] Rasul, S.B., Munir, A.K.M., Hossain, Z.A., Khan, A.H., Al-auddin, M., Hussam, A., (2002) Electrochemical measure-ment and specation of inorganic arsenic in groundwater of Bangladesh. Talanta 58, 33-43.
[10] Kopanica, M. and Novotny, L. (1998) Determination of traces of arsenic (III) by anodic stripping voltammetry in so-lutions, natural waters and biological material. Anal.Chim. Acta 368, 2211-218.
[11] Feeney, R. and Kounaves, S.P. (2002) Voltammetric meas-urement of arsenic in natural waters Talanta 58, 23-31. [12] Huang, H. and Dasgupta, P.K. (1999) A field-deployable
in-strument for the measurement and speciation of arsenic in po-table water. Anal. Chim. Acta 380, 27-37.
[13] Holak, W. (1980) Determination of arsenic by cathodic strip-ping voltammetry with a hanging mercury drop electrode. Anal. Chem. 52, 2189-2192.
[14] Sadana, R.S. (1983) Determination of arsenic in the presence of copper by differential puls cathodic stripping voltammetry at a hanging mercury drop electrode. Anal. Chem. 55, 304-307.
[15] Li, H. and Smart, R.B. (1996). Determination of sub-nanomolar concentration of arsenic(III) in naturel waters by square wave cathodic stripping voltammetry. Anal. Chim. Acta 325, 25-32.
[16] Ferreria, M.A. and Barros, A.A. (2002) Determination of As(III) and As(V) in natural waters by cathodic stripping voltammetry at a hanging mercury drop electrode Anal. Chim. Acta 459, 151-159.
[17] Barra, C.M. and dos Santos, M.M.C. (2001). Speciation of inorganic arsenic in natural waters by square wave cathodic stripping voltammetry. Electroanalysis 13, 1098-1104 [18] Greulach, U. and Henze, G. (1995) Analysis of arsenic(V) by
cathodic stripping voltammetry. Anal. Chim. Acta 306, 217-223.
[19] Henze, G., Wagner, W. and Sander, S. (1997) Speciation of arsenic(V) and arsenic(III) by cathodic stripping voltammetry in fresh water samples. Fresenius J. Anal. Chem., 358, 741-744.
[20] 20. Sancho, D., Vega, M., Deban, L., Pardo, R. and Gon-zalez, G., (1998) Determination of copper and arsenic in re-fined beet sugar by stripping voltammetry without sample pre-treatment. Analyst 123, 743-747.
[21] Kowalska, J., Stryjewska, E., Szymanski, P. and Golimowsk, J. (1999) Voltammetric determination of arsenic in plant ma-terial. Electroanalysis 17,1301-1304.
[22] Munoz, E.and Palmero, S. (2002) Analysis and speciation of arsenic by stripping potentiometry:a review. Talanta 65, 613-620.
[23] Miller, J.C. and Miller, J.N. (1993) Statistics for Analytical Chemistry. Third Ed., Ellis Horwood, Chichester, UK, p117.
Received: October 28, 2005 Accepted: January 23, 2006
CORRESPONDING AUTHOR Nuri Nakiboğlu
Balıkesir University Science and Art Faculty Chemistry Department 10145 Balıkesir Turkey Phone: ++90 0266 6121263 Fax: ++90 0266 2391475 e-mail: [email protected]