EFFECTS OF MIR-376 FAMILY MIRNAS ON
CHRNA5 DEPLETED MCF7 CELL LINE MODEL
AND CO-CULTURE COMPETITION STUDIES
A THESIS SUBMITTED TO
THE GRADUATE SCHOOL OF ENGINEERING AND SCIENCE OF BILKENT UNIVERSITY
IN PARTIAL FULFILLMENT OF THE REQUIREMENTS FOR THE DEGREE OF
MASTER OF SCIENCE IN
MOLECULAR BIOLOGY AND GENETICS
By
Rafed Said Tiryaki
iii
Abstract
Effects of miR-376 Family miRNAs on CHRNA5 Depleted MCF7 Cell Line Model and Co-culture Competition Studies
Rafed Said Tiryaki
MSc. in Molecular Biology and Genetics Supervisor: Özlen KONU KARAKAYALI
July, 2019
Cholinergic receptor nicotinic alpha 5 (CHRNA5) is a ligand-gated ion channel and one of the subunits of nicotinic acetylcholine receptors. Role of CHRNA5 in tumorigenesis has been initially shown in the lung tissue in which higher CHRNA5 expression has been significantly correlated with worse prognosis in lung cancer. In addition, our laboratory members recently shown that CHRNA5 depletion in breast cancer cell line MCF7 is antiproliferative (TUBITAK 111T316). In present study, effects of CHRNA5 depletion on miRNA expression profile were investigated and a significant decrease in the expressions of two members of the miR-376 family miRNAs, miR-376a-3p and miR-376c-3p, were identified. To test the effects of these two miRNAs, mimics were used in combination with CHRNA5 depletion on MCF7 cell line model. To investigate the synergism and/or antagonism of miR-376a mimic with CHRNA5 siRNA treatment a microarray study was performed and the signaling pathways involved were identified. Expressions of genes of interest were tested with RT-qPCR for both miRNAs. In addition, the effects of rescue on the cell phenotype and viability were also studied by using phalloidin staining and MTT experiments, respectively. Next a co-culture-based competition assay was developed using MCF7 cell lines expressing different fluorescent molecules to assess competition by both flow cytometer and fluorescent imaging. In summary, the results revealed that combinational treatments of si-CHRNA5 together with the miRNA mimics of two members from miR-376 family revealed enhancement of the antitumor effects. This study has been supported by TUBITAK (grant no. 114S367).
iv
Keywords: Breast cancer, cholinergic signaling, CHRNA5, siRNA, microRNAs,
v
Özet
CHRNA5 İfadesi Düşürülmüş MCF7 Meme Kanseri Hücre Hattı Modelinde miR-376 Familya mikroRNA’larının Etkileri ve Ko-kültür Rekabet Çalışmaları
Rafed Said Tiryaki
Moleküler Biyoloji ve Genetik Bölümü Yüksek Lisans Tez Danışmanı: Özlen KONU KARAKAYALI
Temmuz, 2019
Kolinerjik reseptör nikotinik alfa 5 (CHRNA5) ligand kapılı iyon kanalları olan nikotinik asetilkolin reseptörlerinin alt birimlerinden biridir. CHRNA5'in tümörgenezde rolü, daha önce akciğer dokusunda gösterilmiştir. Yüksek CHRNA5 ekspresyonunun, akciğer kanserinde daha kötü prognoza ile korelasyonu gösterilmiştir. Buna ek olarak, laboratuvar üyelerimiz yakın zamanda meme kanseri hücre hattı MCF7'deki CHRNA5 ifadesinin deplesyonunun antiproliferatif etkilerini olduğunu göstermiştir (TÜBİTAK 111T316). Bu MS tezinin baz alındığı çalışmada ise, CHRNA5 deplesyonunun mikroRNA ekspresyon profili üzerindeki etkileri araştırılmış ve miR-376 familyası mikroRNA'larının iki üyesinin ifadelerinde (miR-376a-3p ve miR-376c-3p) anlamlı bir azalma tanımlanmıştır. Bu iki mikroRNA'nın etkilerini test etmek için ekspresyon seviyeleri, CHRNA5 tüketilmiş MCF7 hücrelerinde, mikroRNA mimik sistemleri kullanılarak kurtarılmıştır. CHRNA5 siRNA ile miR-376a mimik uygulamasının arasındaki sinerjizmi ve/veya antagonizmini araştırmak için bir mikrodizilim çalışması yapılarak dahil olan sinyal yolları tanımlanmıştır. İlgili genlerin ifadeleri, her iki mikroRNA için RT-qPCR ile test edildikten sonra gen ifade kurtarımının, hücre fenotipi ve hücre canlılığı üzerindeki etkileri, sırasıyla faloidin
vi
boyaması ve MTT deneyleri kullanılarak kontrol edilmiştir. Daha sonra, farklı flüoresan molekülleri eksprese eden MCF7 hücre hatları kullanılarak bir ko-kültür bazlı rekabet protokolü geliştirilmiş olup akış sitometresi ve flüoresan görüntüleme metotları ile hücreler arası rekabet değerlendirilmiştir. Sonuçlar, si-CHRNA5'in ve miR-376 ailesinden iki üyenin mikroRNA mimikleri birlikte kombinasyonel etkilerinin antitümör etkilerinin artışını desteklediği görülmüştür.
Anahtar Kelimeler: Meme kanseri, kolinerjik sinyal yolakları, CHRNA5, siRNA,
vii
viii
Acknowledgements
First and foremost, I want to express my gratitude my supervisor Assoc. Prof. Ozlen Konu, for her guidance throughout all my undergraduate years and graduate studies as well as for giving me a chance to work on her laboratory and during this project.
I also would like to thank my jury members, Prof. Dr. Ayşe Elif Erson Bensan and Asst. Prof. Bahar Değirmenci Uzun, for giving their time for reviewing my thesis and their helpful discussions. I would like to thank all my past and current instructors in the Bilkent Molecular Biology and Genetics Department as well.
I would like to thank Prof. Dr. İhsan Gürsel and his group members for helping me with flow cytometry analyses and letting me use the tools in their lab whenever I needed. Konu lab members, who are the greatest people I had in my life, I thank them all for all their support and friendship. I would like to thank, Sahika Cingir Köker, Seniye Targen and Bircan Çoban, my mentors and colleagues in the Konu lab, from whom I learned all my scientific knowledge and great lessons in life. I also want to acknowledge other members of the Konu Lab during my study; Fatma Betül Dincaslan, Damla Güneş, Büşra Korkmaz, Murat Yaman, Tuğberk Kaya and Alperen Taciroğlu for their great friendship as well as fruitful discussions. Lastly, I want to thank previous members of the Konu Lab, Başak Özgürsoy, Mehtap Yılmaz Tezcan, Ermira Jahja and Huma Shehwana whom started and gave the foundations to the project.
Aside from all above, I would like to thank my lab-mate and friend Ayşe Gökçe Keskus specifically. Her friendship and help in almost all parts of my work were very valuable, especially during hard times and will be something I will remember for the rest of my life.
ix
I want to give my most precious thanks to my two closest friends, Özlem Bulut and Zeynep Boyacıoğlu. When I was in my darkest hours and hardest times it was those two always picking me up and making me well again.
In addition, I would like to thank my dearest friends; Gizem Kılıç, Onur Karasu, Saygın Bilican, Dilara Boğa and Oben Karasaka. Their friendship is one of the things I value most in my life.
On another note, I want to thank parents, my mother Nazmiye Tiryaki and my father Mehmet Recep Tiryaki for always believing me and never stop supporting me. As well as my sister Meriç Şeyma Tiryaki, my brother Esat Tiryaki and my sister-in-law Ruveyda Paçacı Tiryaki for always being there for me and being close friends for me aside from being siblings.
Last but not least, I would like to thank all members of the Bilkent Molecular Biology and Genetics family for providing us with a convenient lab environment to support out work. This project was supported by a research grant (to OK) funded by The Scientific and Technological Research Council of Turkey (TUBITAK) (114S367) and COST (BM1406). I was supported by Bilkent University and TUBITAK 114S367 for my graduate studies.
x
Table of Contents
Abstract ... iii
Özet ... v
Acknowledgements ... viii
List of Figures ... xiii
List of Tables ... xviii
Abbreviations ... xix
1 Introduction ... 1
1.1 Breast Cancer ... 1
1.2 Calcium Signaling and Nicotinic Acetylcholine Receptors ... 2
1.3 MicroRNAs ... 5
1.3.1 miR-376 Family miRNAs (miR-376a and miR-376c) ... 8
1.3.2 Other miRNAs Used in the Study ... 9
1.4 miRNA Targeting and Prediction ... 9
1.5 Expression Analysis ... 10
1.6 Co-Culture Competition Experiments ... 12
1.7 Aims and Rationale ... 15
2 Materials and Methods ... 17
2.1 Materials ... 17
xi
2.1.2 Cell Culture Products and Reagents ... 18
2.1.3 Reagents Used in Transfections ... 18
2.1.4 Primers ... 19
2.1.5 Laboratory Equipment Used in The Study ... 19
2.1.6 Solutions and Media Preparations ... 20
2.2 In Vitro Methods ... 21
2.2.1 Cell Culture Methods ... 21
2.2.2 Gene Expression Analyses ... 23
2.2.3 MTT Experiments ... 25
2.2.4 Phalloidin Staining ... 26
2.2.5 Fluorescence Microscopy Images and Competition Assay... 26
2.3 In Silico Methods ... 28
2.3.1 miRNet Network Generation ... 28
2.3.2 Acquisition of miRNA Target List ... 29
2.3.3 Enrichment Analyses ... 29
2.3.4 Functional Classifications from PantherDB tool ... 29
2.3.5 Affymetrix mRNA Microarrays ... 29
2.3.6 Ingenuity Pathway Analysis ... 30
3 Results ... 31
xii
3.1.1 Preliminary in silico Analyses ... 33
3.1.2 miRNA rescue and RT-qPCR confirmations ... 35
3.1.3 Transcriptome Analysis Results ... 36
3.1.4 Target Predictions and Confirmations ... 39
3.2 miR-376c ... 41
3.2.1 Preliminary in silico Analyses ... 41
3.2.2 miRNA rescue and RT-qPCR Confirmations ... 44
3.2.3 Target Predictions and Confirmations ... 44
3.3 Phalloidin Results ... 46
3.4 MTT Results ... 47
3.5 Co-Culture Competition Experiments ... 47
4 Discussion and Conclusions ... 58
4.1 CHRNA5 and miR-376 miRNAs as co-effectors ... 60
4.2 Co-culture Competition Model for the Observation of Combination Treatments 64 4.3 Conclusions and Future Perspectives ... 66
References ... 69
xiii
List of Figures
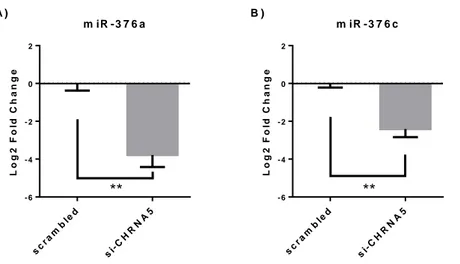
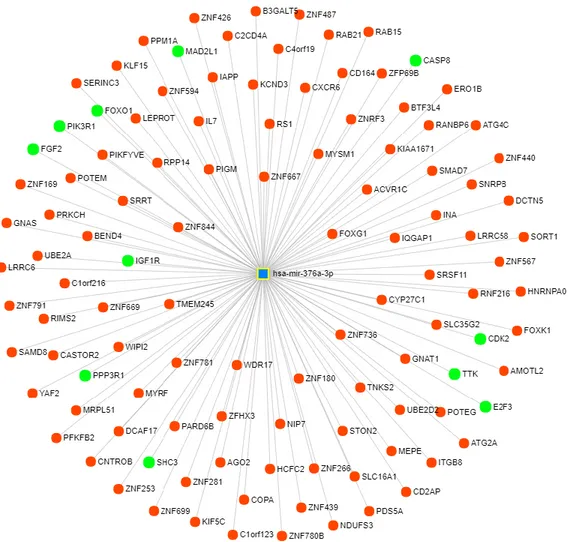
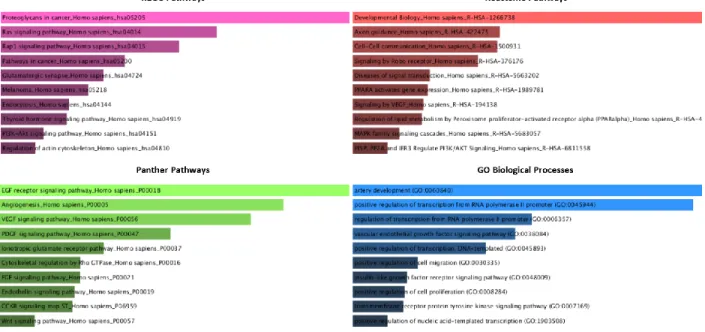
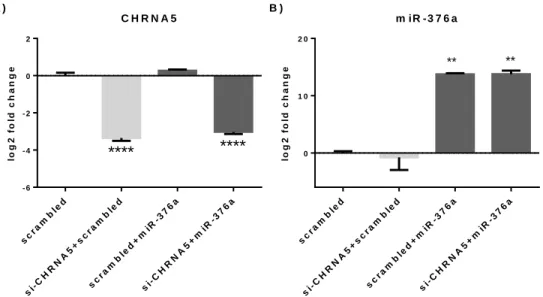
Figure 2.1: Outline for the co-culture competition experiments. ... 28 Figure 3.1: RT-qPCR confirmations of the downregulation of mir-376a (A) and miR-376c (B) in the scramble or siRNA-1 treated MCF7 cells (n=5), **: p-value ≤ 0.01. ... 32 Figure 3.2: Target network of the miR-376a with miRNet tool; blue square represents miRNA and circles show gene targets and green circles represents genes from cell cycle, apoptosis and cancer related pathways. ... 34 Figure 3.3: Results of the enrichments done on the online Enrichr tool for the miR-376a predicted targets from the mirDIP tool as bar graphs of combined scores of Z-scores ranks and p-values. Graphs were color coded as; purple for KEGG pathways, red for Reactome pathways, green for Panther Pathways and blue for GO Biological Processes. ... 35 Figure 3.4: Functional classifications of miR-376a predicted targets from the mirDIP for the biological processes with the online PantherDB tool. ... 35 Figure 3.5: RT-qPCR confirmations of the CHRNA5 downregulation with si-CHRNA5(A) and miR-376a rescue with miRNA mimic (B) **: p-value ≤ 0.01 and ****: p-value ≤ 0.0001, when compared to scrambled control group. ... 36 Figure 3.6: Scatter plot representations of log fold changes (logFC) in mimic-376a (A) and si-CHRNA5+mimic-376a (B) against si-CHRNA5 logFC: mimic-376a only sample shown a mild negative correlation with si-CHRNA5 (A) but si-CHRNA5+mimic-376a sample shown a significant positive correlation(B). Effect ranges of mimic-376a shown with blue line, [-2.38, 1.40], si-CHRNA5 shown with red line, [-3.05, 4.04], and si-CHRNA5+mimic-376a, [-3.51, 4.08], shown with green line. ... 37
xiv
Figure 3.7: Top affected ‘Canonical Pathways’ (left) and ‘Diseases and Bio Functions’ (right) from the IPA core analyses of the miR-376a array data comparisons, orange color shows activation from the z-score and blue color shows inactivation on the pathway or function. ... 38 Figure 3.8: RT-qPCR results of the direct targets of miR-376a, STON2 and BMPR2, on si-CHRNA5 and miR-376a mimic given samples. *: p-value ≤ 0.05 and **: p-value ≤ 0.01, #: p-value ≤ 0.1 from Tukey’s multiple comparison test. ... 39 Figure 3.9: RT-qPCR results of the p53 pathway genes , MDM2, FOS and CDKN1A (p21), on si-CHRNA5 and miR-376a mimic given samples. *: p-value ≤ 0.05, **: p-value ≤ 0.01, ****: p-value ≤ 0.001 from Tukey’s multiple comparison test. ... 40 Figure 3.10: RT-qPCR results of the cell cycle genes , CDC6, WDHD1, BIRC5 and ANLN, on si-CHRNA5 and miR-376a mimic given samples. *: p-value ≤ 0.05 and **: p-value ≤ 0.01 #: p-value ≤ 0.1 from Tukey’s multiple comparison test. ... 41 Figure 3.11: Target network of the miR-376c with miRNet tool where blue square shows miRNA and circles show gene targets, genes from cell cycle, apoptosis and cancer related pathways are labeled with green. ... 42 Figure 3.12: Results of the enrichments done on the online Enrichr tool for the miR-376c predicted targets from the mirDIP tool as bar graphs of combined scores of Z-scores ranks and p-values. Graphs were color coded as; purple for KEGG pathways, red for Reactome pathways, green for Panther Pathways and blue for GO Biological Processes. ... 43 Figure 3.13: Functional classifications of miR-376c predicted targets from the mirDIP for the biological processes with the online PantherDB tool. ... 43
xv
Figure 3.14: RT-qPCR confirmations of the CHRNA5 downregulation with si-CHRNA5(A) and miR-376c rescue with miRNA mimic (B) **: p-value ≤ 0.01 when compared to scrambled control group. ... 44 Figure 3.15: RT-qPCR results of the selected genes (A) WDHD1, (B) FOS, (C) CDKN1A (p21) and (D) CLDN on si-CHRNA5 and miR-376c mimic given samples. #: p-value ≤ 0.1 from Tukey’s multiple comparison test. ... 45 Figure 3.16: Phalloidin staining images of the miRNA mimic treated cells with or without si-CHRNA5, green shows actin filaments whereas blue shows DAPI staining of nuclei. ... 46 Figure 3.17: MTT results showing the relative cell viability of the treatments with miR-376a (A) and miR-376c (B) mimics in the presence or absence of si-CHRNA5, *: p-value ≤ 0.05, **: p-value ≤ 0.01 and ****: p-value ≤ 0.0001, when compared to scrambled control group. ... 47 Figure 3.18: Single colony selection from the polyclonal cells; GFP (top row) and BFP (bottom row) counts from the untransfected control cells(first column), polyclonal cell populations (second column) and selected single colony populations(third and fourth columns). ... 48 Figure 3.19: RT-qPCR results for CHRNA5 for the comparison of the different transfection trials. ... 49 Figure 3.20: Diagram of experiment plans for tree different batches of competition assays. ... 50 Figure 3.21: Co-culture competition results of the first experiment for mimics of miR-495, miR-376a and miR-409: A) microscope images and B) respective cell percentages of
xvi
green tagged si-CHRNA5 and blue tagged scramble cells on co-culture second transfections done with scramble or miRNA mimics as labeled above. ***: p-value < 0.001, ****: p-value < 0.0001 ... 51 Figure 3.22: Co-culture competition experiment results for the second batch for miR-495 with A) microscope images and B) their corresponding cell percentages of green tagged miR-495 mimic and blue tagged scramble treated cells in the absence (left) or presence (right) of si-CHRNA5. *: p-value < 0.05, **: p-value < 0.01 ... 52 Figure 3.23: Co-culture competition experiment results for the second batch for miR-376a with A) microscope images and B) their corresponding cell percentages of green tagged miR-376a mimic and blue tagged scramble treated cells in the absence (left) or presence (right) of si-CHRNA5. *: p-value < 0.05 ... 53 Figure 3.24: Co-culture competition experiment results for the second batch for miR-409 with A) microscope images and B) their corresponding cell percentages of green tagged miR-409 mimic and blue tagged scramble treated cells in the absence (left) or presence (right) of si-CHRNA5. ***: p-value < 0.001 ... 54 Figure 3.25: Co-culture competition results of the third experiment part 1 for mimics of miR-376c and miR-654: A) microscope images and B) respective cell percentages of green tagged si-CHRNA5 and blue tagged scramble cells on co-culture second transfections done with scramble or miRNA mimics as labeled above. *: p-value < 0.05 ... 55 Figure 3.26: Co-culture competition experiment results for the third experiment part 2 for miR-376c: A) microscope images and B) their corresponding cell percentages of green
xvii
tagged miR-376c mimic and blue tagged scramble treated cells in the absence (left) or presence (right) of si-CHRNA5. *: p-value < 0.05, ***: p-value < 0.001 ... 56 Figure 3.27: Co-culture competition experiment results for the third experiment part 2 for miR-654: A) microscope images and B) their corresponding cell percentages of green tagged miR-654 mimic and blue tagged scramble treated cells in the absence (left) or presence (right) of si-CHRNA5. *: p-value < 0.05 ***: p-value < 0.001 ... 57
xviii
List of Tables
Table 2.1: Products used for experimental procedures. ... 17
Table 2.2: Products used during cell culture practices. ... 18
Table 2.3: Nucleic acids and reagents used for the transfections. ... 18
Table 2.4: List and sequences of the primers used for RT-qPCR gene expression studies. ... 19
Table 2.5:Name of the equipment used with their corresponding experiments and manufacturer companies. ... 20
Table 2.6: Recipes for the used solutions during experimental procedures. ... 20
Table 2.7: Recipe for the Complete DMEM used in the cell culture practices. ... 20
Table 2.8: Conditions for the transfections in the different sized plates. ... 23
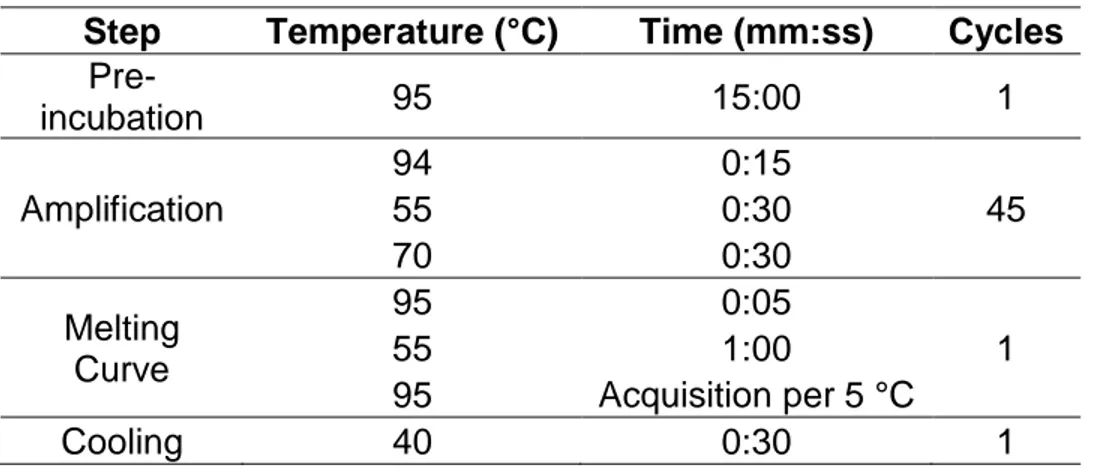
Table 2.9: Realtime qPCR steps for miRNA quantification ... 25
Table 2.10: Realtime qPCR steps for mRNA quantification ... 25
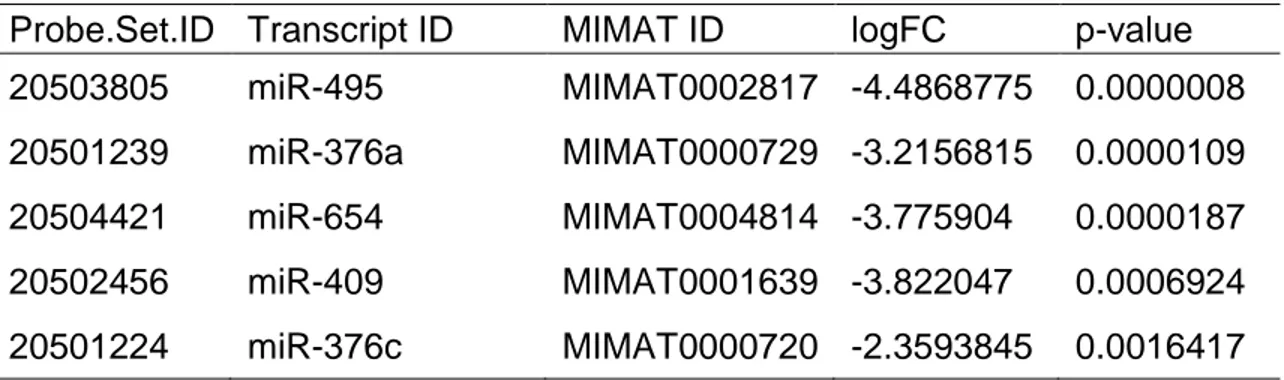
Table 3.1: Changes in miRNA expression from the microarray study of the scrambled or si-CHRNA5 treated samples. ... 31
xix
Abbreviations
ANLN: Anillin Actin Binding Protein BFP: Blue Fluorescent Protein
BIRC5: Baculoviral IAP Repeat Containing 5
BMPR2: Bone Morphogenic Protein Receptor Type 2 CDC6: Cell Division Cycle 6
CDKN1A: Cyclin Dependent Kinase Inhibitor 1A cDNA: complementary DNA
CHRNA5: Cholinergic Receptor Nicotinic Alpha 5 CLDN1: Claudin 1
CXCR4: C-X-C Motif Chemokine Receptor 4
DAPI: 4′,6-diamidino-2-phenylindole
DMEM: Dulbecco’s Modified Eagle Media
ER: Estrogen Receptor
FOS: Fos Proto-Oncogene, AP-1 Transcription Factor Subunit GFP: Green Fluorescent Protein
HMGB1: High Mobility Group Box 1 IGF1: Insulin Like Growth Factor 1 IPA: Ingenuity Pathway Analysis LFC: Log2 Fold Change
MDM2: MDM2 Proto-Oncogene miRNA: microRNA
xx miR-376c: hsa-miR-376c-3p miR-495: hsa-miR-495-3p miR-409: hsa-miR-409-3p miR-654: hsa-miR-654-3p MTT: 3-(4,5-dimethylthiazol-2-yl)-2,5-diphenyltetrazolium bromide nAChR: Nicotinic Acetylcholine Receptor
NFAT: Nuclear Factor of Activated T Cells 2
NNK: 4-(methylnitrosamino)-1-(3-pyridyl)-1-butanone NNN: N’-nitrosoronornicotine p53: Tumor Protein P53 PBS: Phosphate-buffered saline PFA: Paraformaldehyde PR: Progesterone Receptor RIN: RNA Integrity Number
RISC: RNA-induced Silencing Complex
RT-qPCR: Reverse Transcription Quantitative Polymerase Chain Reaction siRNA: Small Interfering RNA
STON2: Stonin 2
TPT1: Tumor Protein, Translationally-Controlled 1
1
1 Introduction
1.1 Breast Cancer
Cancer is a disease of abnormal cell growth. When normal cells undergo certain changes, they may turn into more aggressive cells which divide and invade other parts of the organism in an uncontrolled manner. There are certain hallmarks of cancer that are accepted by researchers such as, sustained cell growth, evasion of apoptosis, angiogenesis and tissue invasion or metastasis [1]. Most common cancer types worldwide are lung, breast and colorectal cancers on all population, as documented by World Health Organization. When only female patients are checked, breast cancer is the most common cancer type (25.1%) with the highest mortality rate (14.7%) [2].
Under normal circumstances, mammary tissue is a secretive tissue consisting of alveolar and tubular structures including different types of cells, like luminal, basal and adipose cells [3]. However, when cells undergo tumorigenesis this orderly structure is disturbed and results in uncontrolled masses of cells in the tissue. Later on, they may even start to metastasize into other tissues [3]. Breast cancers show general characteristics of the cancers, such as aberrant cell division and angiogenesis, but within themselves they show a heterogeneity depending on the cells causing formation of the tumors [4]. Because each breast cancer subtype shows different characteristics, targeting and finding optimal treatment options for individual breast cancer subtypes is required [5]. There are different categorization methods for breast cancers depending on their histological structures and molecular profiles. Histologically breast cancers are divided into two main subtypes, in situ carcinoma and invasive carcinoma; and under these, there
2
are also number of subtypes, by which tumors are classified depending on the different features such as lesion size, cellular arrangement patterns as well as nuclear grading and mitotic index [4, 6]. On the other hand, researcher use yet another classification method depending on the molecular portraits of the cancers, which depends on the expression profiles of group of genes with functional coherence and these expression signatures are based on several different microarray studies [7, 8]. This second classification method includes five main subtypes, i.e., luminal A, luminal B, basal, HER2 overexpressing and normal breast-like breast tumors. This approach to classification holds a better determinant for prognosis, predisposition to metastasize and response to therapies as well as molecular characteristics [3].
Using 2-dimensional cancer cell lines to study cancer cell biology is one of the in vitro models, in which these cells hold the main features of their respective cancer types. In the case of breast cancer many different cell lines are established for the study of heterogenous population of breast tumors [9]. In this masters’ study, MCF7 breast cancer cell line was used for all experiments and analyses. MCF7 cell line well represents the breast cancer luminal A subtype where it is estrogen, progesterone receptor positive (ER+ and PR+ respectively) as well as it expresses p53 protein in the wild-type form [9]. MCF7 cell line was obtained from pleural effusions sourced from invasive ductal carcinoma [10].
1.2 Calcium Signaling and Nicotinic Acetylcholine Receptors
Calcium ions (Ca++) are the key secondary messengers used by cells and may affect
number of different physiological processes including contraction in the muscles, regulation of proliferation or cell survival as well as adjustments in the gene expression profile [11, 12]. For the maintenance of the cellular homeostasis intercellular Ca++
3
concentration is tightly regulated by calcium pumps, channels and calcium binding proteins in the cell [11]. Recently, it has been shown that remodeling of Ca++ homeostasis
occurs during tumorigenesis; as this may affect proliferation, cell survival, migration and invasion in a direct or indirect manner [13, 14]. Several groups studied the aberrant Ca++
signaling on the number of different cancer types including breast [15], cervical [16], esophageal [17], glioblastoma [18] and melanoma [19] and show contribution of Ca++
signaling to the cancer development through different aspects as explained below. One of the effector factors of the Ca++ homeostasis are the nicotinic acetylcholine
receptors, nAChRs, which are ligand-gated ion channels that cause the flow of cations inside cells upon agonist binding [20]. As their main ligand, nAChRs bind to acetylcholine however, they also have high affinity for nicotine and derivatives such as N’-nitrosoronornicotine (NNN) and 4-(methylnitrosamino)-1-(3-pyridyl)-1-butanone (NNK) [20]. nAChRs are classically divided in to two main subtypes, muscle or neuronal receptors. Muscular nAChRs are expressed mainly in the neuromuscular junctions, whereas neuronal subtypes are more effective in the neuron excitation and synaptic transmissions [21]. Thus, nAChRs may have important roles on ion balance and signaling in neural and muscular and other types of tissues. On the other hand, nAChRs also have roles in the various epithelial tissues like ion balance and autocrine or paracrine signaling regulation [22-24].
Structure-wise, nAChRs consists of five subunits that are arranged to form a transmembrane pore. Each subunit has similar a structure and consists of a long N-terminal domain, four transmembrane parts, and a small extracellular C-N-terminal domain. Long N-terminal domain varies among subunits and includes ACh-binding domain, where
4
transmembrane segments contribute to the formation of pore structure [25, 26]. Pentameric structures form from different subunits through homomeric or heteromeric combinations [23, 25]. Expression of different subunits have been shown in non-neuronal tissues and cells as well, including lung tissue [27, 28], epithelial cells [29-31], lymphocytes and immune system [32, 33], keratinocytes [34, 35] and breast tissues [36, 37]. In addition, there were also number of studies showing aberrant expressions of nAChR subunits in different types of cancers (i.e. cervical [38], colon [39], lung [21, 40, 41], breast [36, 37, 42] cancers, leukemia [43], mesothelioma [44], medulloblastoma [45] and neuroblastoma [46]).
Cholinergic receptor nicotinic alpha 5 subunit (α5 or CHRNA5) is one of the subunits of nAChRs. It is encoded from the same gene cluster which houses α3 and β4 subunits that is located in the long (q) arm of chromosome 15. Functionally, CHRNA5 does not contribute to ligand binding from its N-terminus. However, inclusion of CHRNA5 to the structure increases the Ca++ permeability as well as affinity to the ligands [24]. In various
studies CHRNA5 had been associated with number of pathological conditions such as schizophrenia [47], acute myocardial infraction [48], chronic obstructive pulmonary disease (COPD) [49], attention deficit hyperactivity disorder (ADHD) [50], nicotine addiction [51] and various cancer types including lung [51] and gastric cancers [52]. In our laboratory we were the first ones to show the relevance of the CHRNA5 to the breast cancer (Theses of Huma Shehwana (2017), Ermira Jahja (2017), Sıla Özdemir (2014), Azer Açıkgöz (2013), and Şahika Cingir Koker (2019)). In these studies, silencing of CHRNA5 was performed using three different siRNA molecules causing cell cycle arrest, a decrease in DNA damage response and hence increased chemosensitivity [53]. In
5
addition to these, knockdown of CHRNA5 leads to alterations in the miRNA expression profile of MCF7 cell line (Theses of Sahika Cingir Koker, 2019 and Basak Ozgursoy, 2017).
1.3 MicroRNAs
MicroRNAs (miRNAs) are small non-coding RNA molecules which consists of 18-22 nucleotides and act as negative regulators of their target genes. Binding to their target messenger RNA molecules perfectly or partially, miRNAs may cause the degradation through RNA-inducing silencing complex (RISC) or decrease translational activity, respectively [54, 55]. One miRNA molecule through its conserved seed sequence possibly can target multiple mRNAs. Because of this, miRNAs may have drastic effects on the cells, on both molecular and physiological levels [56]. On different studies it has been shown that miRNAs affect several processes, i.e., proliferation [57-59], differentiation [60], apoptosis [61], epithelial to mesenchymal transition [62], drug resistance [63, 64] and invasion [58, 65].
In addition to the regulatory roles of the miRNAs on cellular functions, in several studies aberrant expression of specific miRNAs or changes in miRNA expression profile are found associated with different pathological conditions [66]; including cardiovascular system diseases (i.e., heart failure [67-69], cardiac hypertrophy [70]), systemic lupus erythematosus [71], Down Syndrome [72], Alzheimer’s Disease [73] and inflammation [74]. In addition, when cancer is considered miRNAs again are one of the hot topics that is studied in various cancer types [75]. A significant number of miRNAs have been shown to have disturbed expression profiles in different cancers i.e. glioblastoma multiforme (decreased miR-181 and increased miR-21 and miR-221) [76], chronic lymphocytic
6
lymphoma (decreased miR-15 and miR-16) [77, 78], colorectal neoplasia (decreased miR-143 and miR-145) [79], hepatocellular carcinoma (increased miR-18 and miR-224 with decreased miR-199, miR-195, miR-200, miR-125) [80], lung cancer (decreased let-7 and increased miR-1let-7-92) [81-84] and lymphomas (increased miR-155 and miR-1let-7-92) [85-87]. miRNAs may act differently in various cancers as they may have oncogenic or tumor suppressor roles [75]. Oncogenic miRNAs (or oncomirs) have increased expression in tumors and may either negatively regulate tumor suppressor genes or genes control cell differentiation and apoptosis. An example for oncogenic miRNAs would be miR-17-92 cluster located at chromosome 13q31 locus and suspected to target tumor suppressors PTEN and RB2 genes in lung cancer [83]. On the other hand, tumor suppressor miRNAs, whose expressions are decreased in tumors, prevent the tumor progression by targeting oncogenes or are themselves able to stimulate apoptosis. One of the best characterized miRNAs is let-7, which acts as tumor suppressor by directly targeting well known RAS oncogene in lung cancer [81].
In the case of breast cancer however, numerous miRNAs have been shown to be relevant, i.e., decreased expression of miR-125b, miR-145, miR-21 and miR-155 had been found in breast tumors [88]; miR-210 was induced by hypoxia [89] while miR-30a, miR-30c and miR-182 were found to be associated with response to treatment in ER+ breast tumors [64]. miR-26a was shown to be a determinant factor in treatment outcomes [90] and lastly miR-335 and miR126 were found to be tumor suppressor miRNAs in breast cancers through suppression of metastasis and inhibition of growth, respectively [91]. In addition to these roles, miRNAs have also been studied as new biomarkers to be explored for breast cancer [92-94]. However, one of the most striking findings about miRNAs in
7
breast cancer has come from two separate profiling studies on patient breast tumor samples and cancer cell lines [95, 96].
In the first study, the authors profiled mRNA and miRNAs of 93 primary breast tumor samples. When they applied unsupervised clustering to miRNA profiles, they observed a clear separation between ER+ and ER- samples. In addition, they observed differential miRNA expression patterns in between five molecular breast tumor subtypes, where miRNAs from same families showed high correlation and seven miRNA families were differentially expressed between luminal A and luminal B subtypes. They also checked the association of miRNAs with clinical factors and found out 31 miRNAs, corresponding to 20 miRNA families, showed difference between ER status and tumor grade [95]. In the second and more recent study however, researchers preformed the profiling of 51 human breast cancer cell lines for mRNAs and miRNAs. Depending on the mRNA profiles they found 2 groups resembling luminal and basal subtypes. Later on, in miRNA profiles they observed 2 groups as well, which were similar to classification from the mRNA profiling. From most variable 87 miRNAs they also found out two groups of miRNAs high in either group [96].
Expressions of miRNAs can be modified using mimic or inhibitor/antimiR systems, which increase or decrease expressions, respectively. Along with miRNA expression control mechanisms, roles of miRNAs as therapeutics for cancer and other diseases have been shown in different settings, i.e., tumor suppressor effects of miR-34 and oncogenic effects of miR-122 [97] as well as inhibition of oncogenic miR-155 was shown in a lymphoma model in mouse [98]. Along with roles of single miRNAs, expression systems also allow to the discovery of the combinational effects of miRNAs with other mRNA regulator
8
molecules, as in other miRNAs [56] or siRNA molecules [99] as synergism or antagonism. Although, there are limited number of studies in the literature using a combination of the siRNA and miRNA expression technologies, these two types of interference modes, in combination, may alter each other’s effects [65, 100]. In this master’s study, the combinational effects of two members of 376 miRNA family (376a-3p and miR-376c-3p) with an si-CHRNA5 molecule in the MCF7 cell line have been studied.
1.3.1 miR-376 Family miRNAs (miR-376a and miR-376c)
miR-376a-3p (MIMAT0000729), AUCAUAGAGGAAAAUCCACGU, and miR-376c-3p (MIMAT0000720), AACAUAGAGGAAAUUCCACGU, are closely related miRNAs from the same family [101, 102]. In miRNA annotation, same number with different letter suffixes means similar miRNAs with slightly different sequences, in this case between miR-376a-3p and miR-376c-3p there are changes at the 2nd and 14th nucleotides [103].
The expression changes of miR-376a-3p and miR-376c-3p were seen in the number of cancers [104] as well as can be seen from the miRNA-cancer association database (miRCancer) [105]. The examples for miR-376a-3p includes downregulation in breast cancer [106], glioblastoma [107], hepatocellular carcinoma [108], non-small cell lung cancer [109] and upregulation in ovarian cancer [110], pancreatic ductal adenocarcinoma [111], whereas for miR-376c-3p the modulations include downregulation in cervical cancer [112], gastric adenocarcinoma [113], non-small cell lung cancer [114], osteosarcoma [115, 116], oral squamous cancer [117]. Lastly, in metastatic melanoma [118] and chondrosarcoma [119] both microRNAs were downregulated. Overall downregulation in all these cancer types might indicate that both 376a-3p and
miR-9
376c-3p could have tumor suppressor roles and their re-introduction to the cell using mimics might provide a therapeutic relevance.
1.3.2 Other miRNAs Used in the Study
In addition to two miRNAs from miR-376 family, three additional miRNAs were included in the last part of the thesis in co-culture competition experiments, miR-495-3p (MIMAT0002817), miR-409-3p (MIMAT0001639) and miR-654-3p (MIMAT0004814) [101, 102]. miR-495-3p which is downregulated in breast cancer [120-122], gastric cancer [123, 124], non-small cell lung cancer [125] and glioma [126-128] has been focused on its transcriptomic and anti-cancer effects in more detail by Sahika Cingir Koker in her thesis (Sahika Cingir, PhD Thesis, Bilkent University 2019). miR-409-3p has been shown to be downregulated in breast cancer [129], lung adenocarcinoma [130] and bladder cancer [131] while miR-654-3p was downregulated in papillary thyroid cancer [132] but upregulated in mantle cell lymphoma [133].
These miRNAs mentioned above, miR-376 family and other miRNAs, are all located on the long (q) arm of the chromosome 14, clustered along with number of other miRNAs modulated by CHRNA5 siRNA molecules [134]. This miRNA cluster has been previously reported to be downregulated in the metastatic prostate cancer cells [135], giant cell tumor of bone [136], metastatic melanoma cells [118] and gastrointestinal stromal tumors [137], however exhibit increased expression in lung adenocarcinoma and has been associated with the metastasis and poor prognosis [138].
1.4 miRNA Targeting and Prediction
Since miRNAs work through inhibiting expression of their target genes, one of the main points for understanding the effects of the miRNAs on cells is the identification of the
10
miRNA-target interactions. In last decade there are number of miRNA target prediction tools developed and all have four main features, seed match, conservation, free energy and site accessibility. Briefly, seed match looks for the Watson-Crick match between the miRNA and its targeted sequence. Conservation has been used by multiple tools because in general seed sequences of the miRNAs are more conserved. Free energy (Gibbs free energy) is widely used for showing the stability of a biological system which is taken into consideration for miRNA-target interaction; and lastly site accessibility is a measure of how easily miRNAs can bind to their target region [139]. Commonly used miRNA prediction tools can be listed as: miRanda [140-142], TargetScan [143], DIANA [144, 145], miRDB [146]. In this study however, mainly two tools have been used, miRNet and mirDIP. Online miRNet tool can be used for finding the experimentally validated miRNA-target interactions to show in a network as well as for in-built enrichment analysis [147, 148]. On the other hand, mirDIP is an integrative database for the miRNA target predictions, it makes use of the 30 independent target prediction resources, including ones listed above, and generates an “integrated score” while it allows to select which databases to be included [149, 150].
1.5 Expression Analysis
Translation of genomic sequence data to the functional biological information requires the acquisition of the expression data for genes. After 1990s one of the most used expression profiling methods is DNA microarrays [151]. Microarray technology uses fixed DNA probes on a chip surface and hybridization of sample to those probes for the identification of DNA abundance [152]. Different array chips can be designed for various purposes, i.e., expression profiling, resequencing and genotyping of single nucleotide polymorphisms
11
(SNPs) or point mutations [153]. DNA arrays have allowed scientists to find expression profiles of diverse number of cases including cancer [153]. Microarrays can also be used for the analysis of miRNA expression profiles with specified probes for the purpose [154]. miRNA profiling can be an important approach for the understanding of the miRNA functions and effects, especially when coupled with the mRNA expression profiling [155]. This approach had been used for various research groups for understanding different cases, i.e., for breast cancer [156, 157], interstitial lung diseases [158], hepatitis C virus infection [159] and mesenchymal tumors [160]. In addition to expression profiling with arrays another analysis method for expression is the reverse transcription quantitative polymerase chain reaction (RT-qPCR), where a complementary DNA (cDNA) is generated from RNA samples with reverse transcription and expression is examined with the help of SYBR green assisted real time polymerase chain reaction [161]. This method can be used for detecting the expression of a specific gene by using specific primers as well as for miRNAs [162].
Giving a biological meaning to the high-throughput data coming from microarrays is an important step in the understanding the effects of a treatment of interest [163]. For this purpose, one of the most used approaches is generation of a set of differentially expressed (DE) genes before comparing it with the previously generated gene lists and pathway library databases such as Gene Ontology Consortium (GO) [164], Kyoto Encyclopedia of Genes and Genomes (KEGG) [165], Reactome Pathways [166], Molecular Signatures Database (MSigDb) [167], Gene Signature DataBase (GeneSigDB) [168] and Encyclopedia of DNA Elements (ENCODE) [169]. In this masters’ study several databases have been used for enrichment analyses including miRNet in-built enrichment
12
analysis that is using KEGG [147, 148]; PANTHER classification system for the categorization of genes in respect to their gene functions, ontology and pathways [170, 171]; Enrichr, an online enrichment analysis tool which integrates multiple databases including the ones listed above [172, 173]; and lastly Ingenuity Pathway Analysis (IPA) tool, a commercial software package that uses casual networks curated from the literature for analysis of upstream or downstream effects [174].
1.6 Co-Culture Competition Experiments
Cell competition is the process in which elimination of normally viable but relatively less fit or growth-disadvantaged cells occurs within a group of cells. It was first discovered in
Drosophila melanogaster embryos, where Minute+/- cells were eliminated when they were
near wild-type cells in embryo during wing development [175, 176]. Later on, similar mechanisms also shown in the mammalian cells, both in vivo and in vitro [177, 178]. In addition to development, role of cell competition has also been shown in different circumstances including tissue health, aging and tumorigenesis [179]. Even though removal of less viable cells is required for development, tissue health and aging; it can play a dual role in different phases of tumorigenesis, acting on both tumor suppression and expansion. In early stages of tumor formation, transformed cells can be eliminated by neighboring normal cells by a process called epithelial defense against cancer (EDAC) [180]; however, in later stages cancer cells may become “supercompetitors” which may result in removal of surrounding normal cells for more space or resources [181]. In addition to these, in immortalized cell lines cell competition has also been observed in between sub-clones of the cells [177]. In all these scenarios, cells mainly attempt to eliminate their neighbors for limiting factors in the environment, i.e., available resources,
13
growth factors or limited space in the tissue or organ. Several well-known molecules and signaling pathways had been associated with the cell competition; including Myc [182-184], BMP pathway [185], Hippo pathway, Wnt and JAK/STAT pathways [186, 187]. Although the results of cell competition are understood to an extent, mechanisms by which cell competition occurs and cells are driven to apoptosis are not fully understood yet. There are two hypotheses have been proposed and acknowledged for different conditions. First, more viable (winners) cells, diffuse a short-range signal that only less-fit cells (losers) respond to and gets eliminated [182, 186]. On the other hand, second hypothesis states, loser removal occurs through direct interaction of membrane-bound receptors with winner cells [188]. Since cell competition is such an important phenomenon, we can also take advantage of it for a prevent tumor progression.
One of the methodologies used for the study of cell to cell interactions is to culture different cells together. There are different types of co-cultures used for various purposes, one way to classify them would be the interaction settings of the cells; direct or indirect cultures. In case of direct cultures cells are seeded by directly mixing or on top of each other where they are on physical interactions with each other. On the other hand, for indirect cultures constructs such as membranes, transwell inserts or Boyden chambers can be used to separate cells to inhibit direct physical interactions between different cell types. Cell to cell communication types change depending on the culture setting. In direct cultures, cells can interact by cell-cell adhesions; through tight, adherent and gap junctions as well as paracrine signaling with soluble factors. However, in indirect cultures, since physical contact is inhibited, they can communicate only through soluble factors [189]. As well as interaction type, classification also could be done based on environment
14
that cells are cultured. Both direct and indirect culture settings can be achieved through two-dimensional (2D) culture environments, such as flasks and dishes, or three-dimensional (3D) culture environments, in example collagen or agarose gels [190]. In the literature various usages of co-cultures are explained thoroughly; these includes infection studies [191], drug research [192], increased culturing success for specific cell types [193, 194], using mutual interactions between different cells [195], layered cultures on top of feeder cells to grow [190] and lastly using more than two types of cells in the same environment to generate a niche for cells to mimic in vivo conditions [190, 196]. In addition to the ones listed above, another usage of the co-cultures is for generation of artificial tissues [197, 198]; which had been applied to number of tissue types such as bone [199, 200], heart [201-203], vascular [204, 205], lung [206], kidney [207], liver [208] and nerve tissues [209]. Co-culture techniques are also used in the cancer studies, mainly for understanding the interplay between tumor cells and surrounding cells or microenvironment [210-212] as well as for dig out the underlying mechanisms of angiogenesis [213, 214].
Aside from the usages mentioned above, although co-cultures could also be used for observation of cell competition, there are limited number of studies that uses co-culture techniques for competition assays. In one of the studies, a competition assay model was suggested by a research group for the observation of changes in the cell proliferation. Where co-culture of transduced GFP (+) cells and untransduced GFP (-) cells was used to show effects of shRNAs on cells’ proliferation rates by determining GFP (+) cell ratio with flow cytometry over number of passages [215]. In another study, effects of ascorbic acid on growth of Barrett’s esophageal cell lines was checked on co-cultures with
15
florescent labeled normal squamous esophageal cells, outcome was measured over 14 days of treatment [216]. On a third study, researchers tried to find drugs that are preferably cytotoxic to MUC16 positive ovarian cancer cells on co-culture with their negative counterparts. Where they used a 384-well plated system for drug screens and automated imaging with analysis for the acquisition of results [217]. Lastly, a co-culture system was used for the discovery of the genetic interactions and synthetic lethality from a genome-scale shRNA screen and a query of genes. In which parental cells labeled with red and knockout cells labeled with green fluorescent proteins and are co-cultured together. They are treated with siRNAs for query genes in a span of 7-days with daily automated imaging [218]. In all these studies, the purpose of the treatments on the co-cultures was to change the dynamics in the cell fitness; either by decreasing the proliferation of the target cells or increasing the relative fitness of the surrounding normal cells. To the best of our knowledge, there were no studies comparing the interactions between siRNA and miRNAs using competition co-culture models.
1.7 Aims and Rationale
Previous studies in our lab showed the effects of CHRNA5 silencing in the MCF7 breast cancer cell line as causing cell cycle arrest, decreased DNA damage response and increased chemosensitivity by using three different siRNA molecules [53]. Furthermore, miRNA expression of siRNA treated samples has been checked with a miRNA microarray, which revealed two members of 376 miRNA family, 376a and miR-376c, was downregulated by the CHRNA5 siRNA (Sahika Cingir, PhD Thesis, Bilkent University 2019). These two miRNAs were shown to be downregulated in number of cancers before which might indicate a tumor suppressor role. Therefore, we hypothesized
16
CHRNA5 siRNA treatment in combination with miR-376a or miR-376c mimics could further enhance anti-tumor effects of the CHRNA5 depletion. Main aims of this study can be stated as:
a) Increasing the amount of miR-376a or miR-376c with miRNA mimics in MCF7 cells in the presence or absence of CHRNA5 siRNA.
b) To reveal transcriptomic profile of miR-376a mimic treatment in the presence or absence of CHRNA5 siRNA and validate several targets identified by in silico methods.
c) Compare the transcriptomic profiles of CHRNA5 siRNA only, miR-376a mimic only, and siRNA and mimic together groups using functional annotation and miRNA-mRNA network tools.
d) Check antiproliferative and phenotypical effects of miR-376a and miR-376c mimics on MCF7 cells in the presence or absence of CHRNA5 siRNA.
e) To develop a co-culture competition assay between MCF7 cells stably expressing GFP or BFP, to analyze cell competition between cells treated with different molecules using microscopic and/or quantitative analyses for the observation of combinational effects of CHRNA5 siRNA and miRNA mimics.
17
2 Materials and Methods
2.1 Materials
2.1.1 Laboratory Reagents and Kits
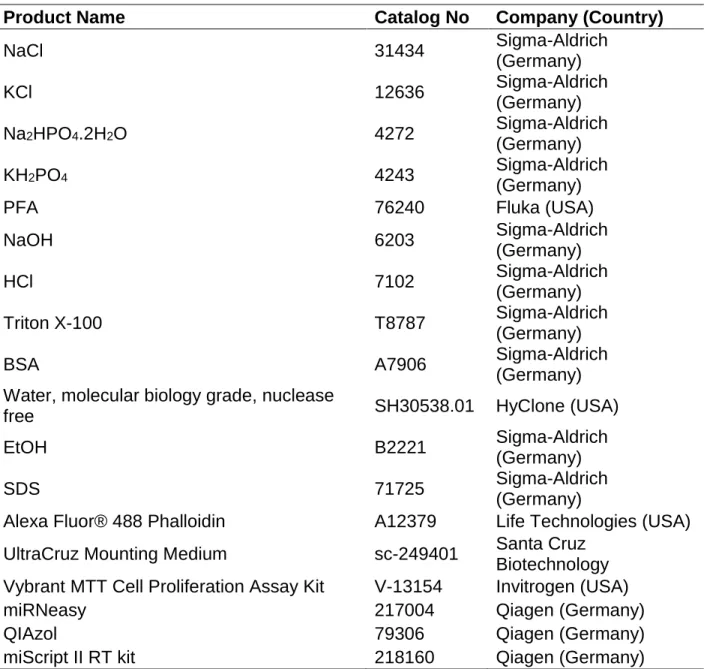
Reagents from the general laboratory stocks and the kits used are given in the Table 2.1 with their catalog numbers and company information.
Table 2.1: Products used for experimental procedures.
Product Name Catalog No Company (Country)
NaCl 31434 Sigma-Aldrich (Germany) KCl 12636 Sigma-Aldrich (Germany) Na2HPO4.2H2O 4272 Sigma-Aldrich (Germany) KH2PO4 4243 Sigma-Aldrich (Germany)
PFA 76240 Fluka (USA)
NaOH 6203 Sigma-Aldrich (Germany) HCl 7102 Sigma-Aldrich (Germany) Triton X-100 T8787 Sigma-Aldrich (Germany)
BSA A7906 Sigma-Aldrich
(Germany) Water, molecular biology grade, nuclease
free SH30538.01 HyClone (USA)
EtOH B2221 Sigma-Aldrich
(Germany)
SDS 71725 Sigma-Aldrich
(Germany)
Alexa Fluor® 488 Phalloidin A12379 Life Technologies (USA) UltraCruz Mounting Medium sc-249401 Santa Cruz
Biotechnology Vybrant MTT Cell Proliferation Assay Kit V-13154 Invitrogen (USA)
miRNeasy 217004 Qiagen (Germany)
QIAzol 79306 Qiagen (Germany)
18
RevertAid First Strand cDNA Synthesis Kit K1622 Fermentas (Canada) miScript SYBR Green PCR Kit 218073 Qiagen (Germany) LightCycler 480 SYBR Green I Master 4887352001 Roche Applied Science
(Germany)
Sodium Azide BCBP7328V Sigma-Aldrich
(Germany)
2.1.2 Cell Culture Products and Reagents
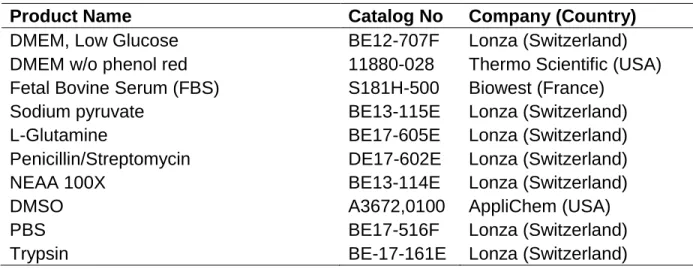
Reagents and molecules that are used in the cell culture procedures are listed in the Table 2.2 with their catalog numbers and companies.
Table 2.2: Products used during cell culture practices.
Product Name Catalog No Company (Country)
DMEM, Low Glucose BE12-707F Lonza (Switzerland)
DMEM w/o phenol red 11880-028 Thermo Scientific (USA) Fetal Bovine Serum (FBS) S181H-500 Biowest (France)
Sodium pyruvate BE13-115E Lonza (Switzerland)
L-Glutamine BE17-605E Lonza (Switzerland)
Penicillin/Streptomycin DE17-602E Lonza (Switzerland)
NEAA 100X BE13-114E Lonza (Switzerland)
DMSO A3672,0100 AppliChem (USA)
PBS BE17-516F Lonza (Switzerland)
Trypsin BE-17-161E Lonza (Switzerland)
2.1.3 Reagents Used in Transfections
The chemicals and the reagents used for the transfection protocols are listed in the Table 2.3 with their catalog numbers and companies.
Table 2.3: Nucleic acids and reagents used for the transfections.
Product Name Catalog No Company (Country)
HiPerFect transfection reagent 301704 Qiagen (Germany)
Hs_CHRNA5_5 SI03051111 Qiagen (Germany)
Syn-hsa-miR-376a-3p miScript miRNA Mimic MSY0000729 Qiagen (Germany) Syn-hsa-miR-376c-3p miScript miRNA Mimic MSY0000720 Qiagen (Germany) AllStars Negative Control siRNA SI03650318 Qiagen (Germany)
19
2.1.4 Primers
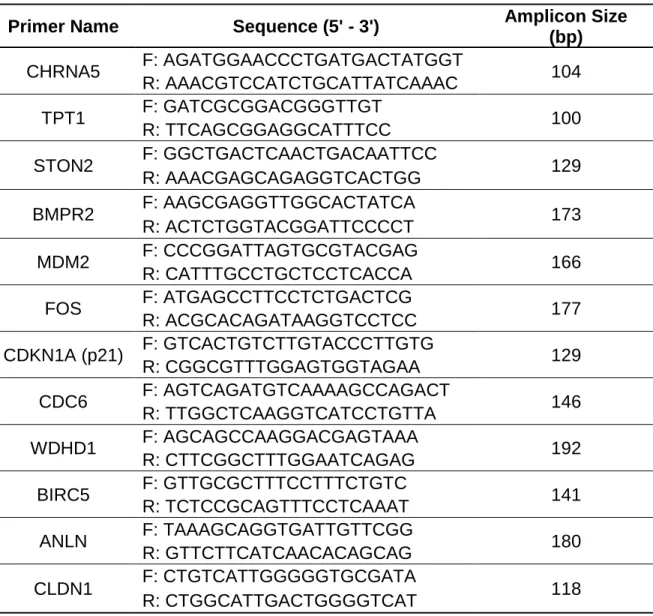
Primer sequences that are used in the RT-qPCR experiment are listed in the Table 2.4 with their working conditions and sizes of amplicons.
Table 2.4: List and sequences of the primers used for RT-qPCR gene expression studies.
Primer Name Sequence (5' - 3') Amplicon Size
(bp) CHRNA5 F: AGATGGAACCCTGATGACTATGGT 104 R: AAACGTCCATCTGCATTATCAAAC TPT1 F: GATCGCGGACGGGTTGT 100 R: TTCAGCGGAGGCATTTCC STON2 F: GGCTGACTCAACTGACAATTCC 129 R: AAACGAGCAGAGGTCACTGG BMPR2 F: AAGCGAGGTTGGCACTATCA 173 R: ACTCTGGTACGGATTCCCCT MDM2 F: CCCGGATTAGTGCGTACGAG 166 R: CATTTGCCTGCTCCTCACCA FOS F: ATGAGCCTTCCTCTGACTCG 177 R: ACGCACAGATAAGGTCCTCC CDKN1A (p21) F: GTCACTGTCTTGTACCCTTGTG 129 R: CGGCGTTTGGAGTGGTAGAA CDC6 F: AGTCAGATGTCAAAAGCCAGACT 146 R: TTGGCTCAAGGTCATCCTGTTA WDHD1 F: AGCAGCCAAGGACGAGTAAA 192 R: CTTCGGCTTTGGAATCAGAG BIRC5 F: GTTGCGCTTTCCTTTCTGTC 141 R: TCTCCGCAGTTTCCTCAAAT ANLN F: TAAAGCAGGTGATTGTTCGG 180 R: GTTCTTCATCAACACAGCAG CLDN1 F: CTGTCATTGGGGGTGCGATA 118 R: CTGGCATTGACTGGGGTCAT
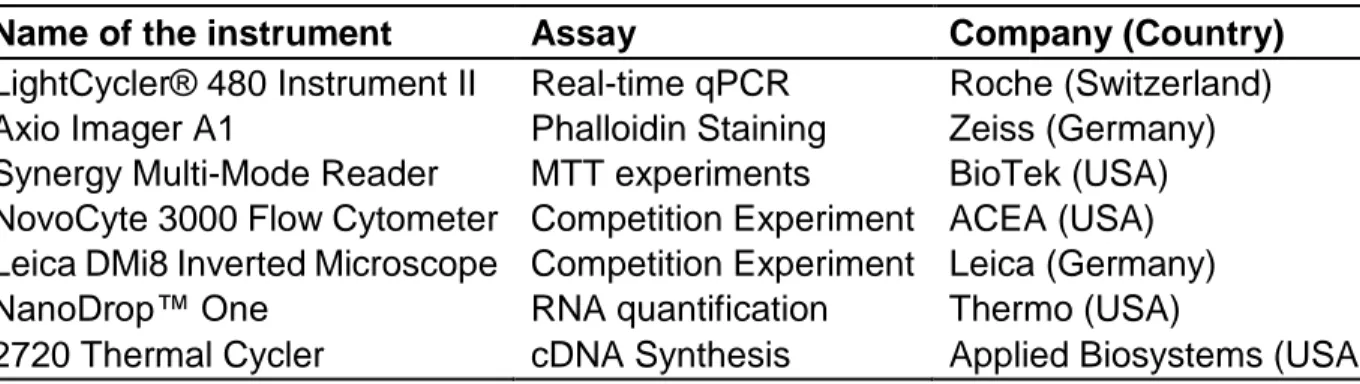
2.1.5 Laboratory Equipment Used in The Study
The equipment used in this study for the acquisition of the results is listed below in the Table 2.5 with the experiments they were used and manufacturing companies.
20
Table 2.5:Name of the equipment used with their corresponding experiments and manufacturer companies.
Name of the instrument Assay Company (Country)
LightCycler® 480 Instrument II Real-time qPCR Roche (Switzerland) Axio Imager A1 Phalloidin Staining Zeiss (Germany) Synergy Multi-Mode Reader MTT experiments BioTek (USA) NovoCyte 3000 Flow Cytometer Competition Experiment ACEA (USA) Leica DMi8 Inverted Microscope Competition Experiment Leica (Germany)
NanoDrop™ One RNA quantification Thermo (USA)
2720 Thermal Cycler cDNA Synthesis Applied Biosystems (USA)
2.1.6 Solutions and Media Preparations
The solution preparation recipes used for various experiments can be seen in the Table 2.6 and the recipe for the complete media cells were grown and treated is given in the Table 2.7.
Table 2.6: Recipes for the used solutions during experimental procedures.
Solution Name Preparation Total Volume
10X PBS 80 g NaCl, 2 g KCl, 15.2 g Na2HPO4.2H2O, 2 g KH2PO4
1000 ml
1X PBS 100 ml 10X PBS 1000 ml
4% PFA 2 g PFA, 1N NAOH, 1M HCl 50 ml
PBX 0.1% Triton-X in PBS 50 ml
BBX 1% BSA in PBX 50 ml
FACS buffer 0.5 g BSA, 25 mg Na-Azide 50 ml
Table 2.7: Recipe for the Complete DMEM used in the cell culture practices.
Reagent Volume Ratio
DMEM, Low Glucose 500 ml
Fetal Bovine Serum (FBS) 50 ml 10%
Sodium pyruvate 10 ml 2%
L-Glutamine 10 ml 2%
NEAA 100X 5 ml 1%
21
2.2 In Vitro Methods
2.2.1 Cell Culture Methods
2.2.1.1 Thawing CellsFrozen cell stocks that were stored in the liquid nitrogen tanks taken and placed in the water bath (37°C) until half is thawed (~2-3 minutes), then rest is solved by mixing with complete media (given in the Table 2.7). Mixture with freezing medium and cells, centrifuged at 1500 rpm for 5 minutes to remove DMSO. Cell pellets were solved in the fresh complete media gently and transferred to T25 flasks, maintained in the incubator 37°C %5 CO2 until next day where cells are checked and passaged to T75 flasks when
they reach confluency with standard passaging procedure.
2.2.1.2 Passaging Cells
When cells reached %75-80 confluency in their flasks they were passaged for the continuation of the cell lines. First, old medium was aspirated from the cells then washed over cells with PBS once. Cells detached using 0.25% Trypsin/EDTA for 3-5 minutes at 37°C %5 CO2 in the incubator and mixed with new complete DMEM containing FBS (at least twice amount of trypsin) to neutralize trypsin. Detached cells transferred to new T75 or T25 flasks with 1:3 to 1:5 dilutions depending on the incoming experiment plans. Passage number of the cells were recorded and for all experiments, cells used were up to passage number of 10.
2.2.1.3 Freezing Cells
For the sake of keeping cell lines younger, whenever cells were opened from the frozen stocks after two to three passages frozen stocks were taken from them. For this procedure, cells were detached as in the passaging procedure then centrifuged at 1500
22
rpm for 5 minutes to get cell pellets. Cell pellets were solved in the freezing medium (90% FBS and 10%DMSO as cryoprotectant); and split to cryovials as each will take around one million cells. Cryovials were frozen step-wise, first stored in the -20°C until solidification occurs (two to three hours), then transferred to -80°C for short-term storage (two to three weeks). Lastly, they were transferred to liquid nitrogen tanks for the long-term storage (months to years).
2.2.1.4 Treatments for Scrambled Oligos, CHRNA5 siRNA and miRNA Mimics
On a day before treatments cells were seeded to new plates. Cells were detached using trypsin and after addition of new media, centrifuged at 1500 rpm for 5 minutes to remove trypsin. Cell pellets were re-suspended in fresh media and counted with the help of hemocytometer and glass cover-slips. Cells then were seeded to 6, 12, 24 or 96-well plates, as in the numbers given in the Table 2.8. Different transfection reagent concentrations were used for experiments; HiPerfect transfection reagent concentration for RNA isolation and MTT experiments were 0.006%; whereas for imaging and competition experiments 0.003% used and on both cases concentrations of 0.0005% (10 nM final concentration) for RNA reagents (scrambled oligos{sc}, siRNA{si} and miRNA mimics{mimic}) were used. All transfection conditions can be seen in the Table 2.8. If double transfections were to be done together (for example, si+mimic or si+sc) both RNA molecules were added to same transfection mixture. On the day of treatment first transfection mixes were prepared then during 10 minutes incubation time of the mix, in which transfection complexes were formed, media of the cells were changed. Transfection complexes added on top of the cells dropwise and plates were swirled 2-3 times to make sure even distribution on the cells. Lastly plates were left in the incubator
23
for required incubation times (72 or 48 hours). Each treatment was performed in duplicates for RNA isolation, with 5 replicates in MTT experiments and triplicates in co-culture competition experiments.
Table 2.8: Conditions for the transfections in the different sized plates.
2.2.2 Gene Expression Analyses
2.2.2.1 RNA ExtractionAfter 72 hours of incubation RNA was collected from the cells with miRNeasy, miRNA isolation kit. For this; cell lysates were collected by washing 2 times with PBS then scraping with the QIAzol Lysis Reagent. Lysates were frozen in liquid nitrogen by snap-freezing and stored in the -80 °C until the day of extraction. Isolation was done following the manufacturers protocols, on the last step 30 µl of nuclease-free water was used for elution. RNA concentrations were measured with the NanoDrop™ One using 1.5 µl of the samples. Also, RNA integrity number (RIN) values were determined for the RNA quality of samples that were going to be used in the microarrays with Agilent.
2.2.2.2 cDNA Synthesis
Two different sets of cDNAs were synthesized, for miRNA and mRNA genes, with the help of miScript II RT kit and RevertAid RT Reverse transcription kit respectively. For both RT reactions 800 ng of RNA is used. For miScript reaction required amount of RNA, 2 µl of 5X HiSpec buffer, 1 µl 10X Nucleus mix, 1 µl RT mix and nuclease free water added
Plate Number of cells (#/well) HiPerfect reagent (µl/well) RNA (µl/well) 6-well 200 000 12 1 12-well 100 000 3 0.5 24-well 50 000 1.5 0.25 96-well 2 000 1.2 0.1
24
until total volume of 10 µl. Reaction took place as 60 minutes at 37°C and 5 minutes deactivation at 95°C in 2720 thermal cycler (Applied Biosystems). On the other hand; for RevertAid RT reaction, 800 ng of template RNA is mixed with 1 µl of Oligo(dT) and added nuclease free water until 12 µl. Then 4 µl of 5X reaction buffer, 1 ul of Ribolock (RNase inhibitor), 2 µl of 10 mM dNTP mix and 1 µl of RT enzyme is mixed in to total of 20 µl volume for each sample. This reaction took place in the 42°C for 60 minutes and 70°C for 5 minutes in 2720 thermal cycler (Applied Biosystems). After both reactions, cDNA samples are diluted 1:20, diluted samples are stored in the -20°C and stocks at -80°C.
2.2.2.3 Real-time Quantitative PCR
Two different protocols were followed for the quantitation of miRNAs and the genes. For miRNA qPCR Qiagen miScript primer assays were used with the Qiagen SYBR green PCR kit. For this 2 µl of diluted cDNA samples were mixed with the reaction mixture consisting of; 1 µl forward primers, 1 µl universal reverse primers, 1 µl nuclease free water and 5 µl SYBR green into total volume of 10 µl then reaction was run as in the steps at Table 2.9. For miRNA quantification RNU6-1 gene was used as the reference gene. In the mRNA gene quantification RT-qPCR experiments on the other hand, Roche SYBR green PCR kit was used in which 2 µl diluted cDNA samples were mixed with the reaction mixture including; 1 µl forward primers, 1 µl reverse primers, 1 µl nuclease free water and 5 µl 2X Roche SYBR green mix into total volume of 10 µl, then reaction was run as in the steps at Table 2.10 and for quantification TPT1 reference gene was used. Both reactions were conducted in the LightCycler® 480 Instrument II and for the analysis and the quantification of both RT-qPCRs results, ΔΔCt method was used, where relative
25
expression is calculated and normalized to a reference gene. Statistical analyses and graph representations of the results was done on the GraphPad Prism tool.
Table 2.9: Realtime qPCR steps for miRNA quantification
Step Temperature (°C) Time (mm:ss) Cycles
Pre-incubation 95 15:00 1 Amplification 94 0:15 45 55 0:30 70 0:30 Melting Curve 95 0:05 1 55 1:00 95 Acquisition per 5 °C Cooling 40 0:30 1
Table 2.10: Realtime qPCR steps for mRNA quantification
Step Temperature (°C) Time (mm:ss) Cycles
Pre-incubation 95 5:00 1 Amplification 95 0:10 50 60 0:20 72 0:20 Melting Curve 95 0:05 1 55 1:00 95 Acquisition per 5 °C Cooling 40 0:30 1
2.2.3 MTT Experiments
In the 96-well plates, in which MTT experiments are going to be conducted, complete phenol-free DMEM was used during transfection protocol. After the 72 hours of incubation time, MTT assay protocol had been followed according to manufacturer’s instructions. In which; first MTT had been solved in PBS then mixed with the complete phenol-free DMEM. This mixture had been distributed on to cells as 110 µl/well and left to incubator (37°C %5 CO2) for 4 hours. After first incubation; SDS-HCl solution was added as 100
26
µl/well and incubated for the 18 hours in the 37°C %5 CO2 incubator. Next day, results
are taken with the help of Synergy Multi-Mode Reader at 570 nm. Normalizations, statistical analyses and graphical representations of the results were done using GraphPad Prism tool.
2.2.4 Phalloidin Staining
For phalloidin staining, first cover slips were sterilized by first autoclave then with UV. Sterile cover slips were placed at the bottom of the 12-well plates before cells were seeded. After transfection protocols and 72 hours incubation cover slips with cells were washed over with PBS and cells were fixated with 4%PFA in PBS for 10 minutes at room temperature. After washing with PBS for 5 minutes 3 times, permeabilization was done using PBS with 0.1% Triton-X (PBX) for 10 minutes. Blocking was done with 1% BSA in PBX (BBX) for 45 minutes and washed using PBX for 5 minutes 3 times. For staining; actin dye phalloidin was diluted in PBX (1:1000) and incubated on slips for 45 minutes inside humidified chambers. Excess dye is washed with PBX for 15 minutes 2 times and before mounting to slides another wash was made in PBS for 10 minutes. Lastly, cover slips are mounted on to cover slides with UltraCruz Mounting Medium including DAPI with a drop and left to dry at room temperature. For storage they are transferred to +4°C. Fluorescent images were taken with Axio Imager A1 (Zeiss) microscope then image normalization and merging was done using ImageJ image analysis tool.
2.2.5 Fluorescence Microscopy Images and Competition Assay
To see the effects of the miRNA mimics individually or in combination on of the siRNA for CHRNA5 on the cell growth and competition of the cells, fluorescent (GFP or BFP) tagged MCF7 cell lines were generated.
27
2.2.5.1 Single Colony Generations from The Polyclonal Cells
GFP and BFP transfected polyclonal cells were a kind courtesy of Sahika Cingir Koker (Sahika Cingir, PhD Thesis, Bilkent University 2019). These cells opened from the frozen stocks and then seeded on to the 96-well plates with a serial dilution method, where 4000 cells are serially diluted on the first column. Then this column is serially diluted through the columns 1 to 12. These cells are grown for 4 to 6 weeks with conditioned media which was the mixture of old media of the wild-type cells (centrifuged at 5000rpm for 10 minutes to remove any floating cells) and fresh media[219]. Lastly, GFP or BFP positive cell percentages of the grown single colonies are measured with the help of the NovoCyte 3000 flow cytometry and 100% tagged colonies are selected.
2.2.5.2 Co-Culture Competition Experiments
To see the effects of the miRNA mimics on the cell growth and the cell competition; cells were transfected with the specified molecules in a step-wise manner. First transfections had been done on the cells that were seeded on the 24-well plates. After the 72 hours incubation time of the first transfections; cells were transferred into new plates in equal densities and second transfections were done on top of them after attachment. After 48 hours of incubation with the second transfections; fluorescent images were taken with the Leica DMi8 Inverted Microscope. Cells then collected and fixed for the flow counting. Fixation has been done with 4%PFA in PBS and solved in the FACS buffer in which they are stored until the counting at 4°C at dark. Percentages of the GFP or BFP positive cells were counted with the NovoCyte 3000 flow cytometry and statistical analyses with graphical representations were done using GraphPad Prism tool. General experiment flow can be seen in the Figure 2.1.
28
2.3 In Silico Methods
2.3.1 miRNet Network Generation
In the miRNet tool website (www.mirnet.ca), miRNAs were selected as input method [147, 148]. In the specifications above; Organism: H. sapiens (human), ID type: miRbase ID and Target type: Genes were selected. In the box below mature miRNA names; hsa-miR-376a-3p or hsa-miR-376c-3p, were submitted as input. In the next two steps of ‘Interaction Table’ and ‘Network Builder’ tabs default settings were used. In the next tab at ‘Network Viewer’ preliminary network can be seen. From settings at top, background color and topology of network were adjusted. On the right side under ‘Function Explorer’ box, all genes were taken as query and hypergeometric test was used as algorithm for KEGG analysis. Genes from the pathways that are relevant to cell cycle, apoptosis and cancer were highlighted. Lastly, from the ‘View Options’ network structure and node size were adjusted and image was downloaded.