The effect of financial liberalization
on the efficiency of Turkish
commercial banks
OSMAN ZAIM
Department of Economics, Bilkent University, 06533, Bilkent Ankara, Turkey
To investigate the effects of post-1980 financial liberalization policies on the economic efficiency of Turkish commercial banks at the micro level, a nonparametric frontier methodology is applied. The distinguishing feature of this model is its capability in addressing simultaneously the developments in economic efficiency and returns to scale in a consistent fashion. The results show that financial reform seems to have succeeded in stimulating the commercial banks not only to take measures that would enhance technical and allocative efficiency, but also to go through necessary scale adjustments in order to achieve optimal scale.
I. I N T R O D U C T I O N
Before the introduction of the '1980 Stabilization Program' the banking sector in Turkey was characterized by restricted entry of domestic and foreign banks and regu-lated interest rates. The lack of interest rate competition in the sector forced banks to compete for the deposits by establishing a network of branches across the country. This led to overbranching and overstaffing in commercial banking.
The main target of the financial policies of the '1980 Stabilization Program' was to create a competitive environ-ment and thereby enhance the efficiency in the sector. The first steps taken in this respect were to pursue liberal policies such as allowing new entries (both domestic and foreign) into the sector and deregulating interest rates commissions and fees. The sector was quick to respond to the program. Liberalization of interest rates and increased competition in the market forced banks to decrease their costs. As a result, unprofitable branches were closed and the number of staff was reduced by many banks.
The aim of this work is to investigate the effects of liberalization policies on the economic efficiency of Turkish commercial banks at the micro level. The methodology pursued depends on estimating multi-output production and cost frontiers using linear programming techniques for representative years from both pre and post liberaiization eras.
0960-3107 © 1995 Chapman & Hall
Estimating production frontiers by imposing different scale assumptions on the technology and measuring each unit's distance from the frontier will not only reveal in-formation on the technical inefficiency of the unit investig-ated, but will also determine at which scale it operates. That is, the methodology allows the exploration of whether a par-ticular bank experiences decreasing, increasing or constant returns to scale. Thus, comparison of scale economies of each bank in the pre and post liberalization eras will shed light on whether the liberalization policies were successful enough to force banks to operate at the optimum scale. Similarly, from the comparison of bank level cost efficiency measures, one can extract infonnation on whether the liber-alization policies were successful enough to force banks to allocate resources more optimally.
The following section reviews the structure of Turkish banking sector. The third section presents the model that will be used for efficiency comparisons. The fourth section is allocated to the presentation of the data source and dis-cussion of results. Section V concludes.
II. STRUCTURE OF THE BANKING SYSTEM The Turkish financial system includes the Central Bank, commercial banks, investment and development banks. Commercial banks are the dominant institutions of the system. Investment banks are established with the purpose
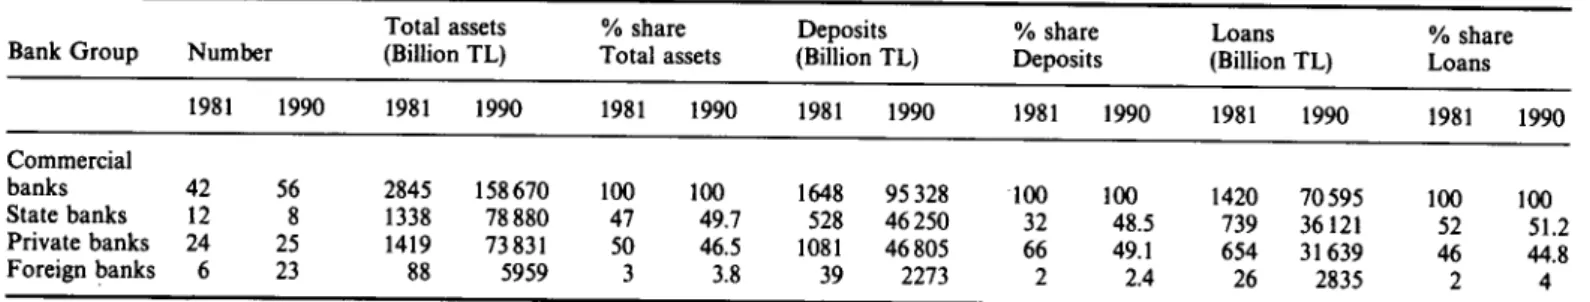
Table 1. Structure ofthe Turkish commercial banking industry
Source: Banks Association of Turkey (1981, 1990)
O. Zaim
Bank Group Commercial banks State banks Private banks Foreign banks Number 1981 42 12 24 6 1990 56 8 25 23 Total assets (Billion 1981 2845 1338 1419 88 TL) 1990 158670 78880 73831 5959 % share Total 1 1981 100 47 50 3 issets 1990 100 49.7 46.5 3.8 Deposits (Billion TL) 1981 1648 528 1081 39 1990 95 328 46250 46805 2273 % share Deposits 1981 100 32 66 2 1990 100 48.5 49.1 2.4 Loans (Billion 1981 1420 739 654 26 TL) 1990 70595 36121 31639 2835 % share Loans 1981 100 52 46 2 1990 100 5 1 •> 448 4of underwriting securities; however, they are also engaged in commercial banking without depending on deposits as a source of funds. Development banks, on the other hand, are primarily engaged in extending medium and long-term loans to selected industries. Their funding comes from the government or other international organizations like the World Bank. The total share of investment and develop-ment banks in the system is limited: in 1990 only 9.0% ofthe consolidated total assets of all banks belonged to these institutions. Thus, given the rather different structure of the development and investment banks and their limited scope in the financial system as a whole, the focus of this work will be on commercial banks to maintain the comparability and uniformity between the units investigated.
As in most other countries, banking is a heavily regulated industry in Turkey. Restrictions on entry and exit, capital adequacy, reserve and liquidity requirements, asset portfolio restrictions, number of branches, deposit insurance, interest rates on deposits and loans are regulated by the govern-ment. The financial reforms in Turkey since 1980 were designed to reduce state interventions and increase the role ofthe market forces in the operation ofthe financial system. The reforms included the abolishment of interest rate ceil-ings, reductions in both the reverse and liquidity require-ments and financial taxes. In addition, together with the recently established Turkish banks, foreign banks are per-mitted to operate in Turkey and restrictions on foreign exchange operations were significantly relaxed during the same period.'
The role of the government in the banking system is not limited to its regulatory authority. As from the end of 1990, the state is the owner-manager of eight commercial banks of a total of 56 banks in the country. In terms of size, banks owned by the state control 49.7% of total assets in the commercial banking system.
With regard to ownership, private banks in Turkey can be grouped as domestic and foreign banks. Table 1 presents the distribution of total assets, deposits and loans among commercial banks owned by the state, Turkish residents and foreigners for the years 1981 and 1990.
Table 2. Distribution of branches and employees in 1981 and 1990
Bank groups
Number of employees Number of branches 1981 1990 1981 1990 Commercial banks State banks Private banks Foreign banks 132313 151982 68127 80825 62152 68145 2034 3012 6259 2591 3545 123 6543 2975 3455 113 Source: Banks Association of Turkey (1981, 1990).
A close inspection of Table 1 indicates that the sector was quick to respond to the measures which foster competition. During the 1981-90 period the number of commercial banks in the sector increased from 42 in 1981 to 56 in 1990. Out of 42 banks in 1981,13 banks were either liquidated or merged with others, implying that between 1981-90,27 new banks entered to the sector. Of these new entrants 18 were foreign owned (either as branches or subsidiaries).
Together with the new entries in the market, liberaliza-tion of interest rates forced banks to decrease their costs by closing the unprofitable branches and reducing the number of staff. Although the number of banks during the 1981-90 period increased significantly, the number of branches rose by only 4.5% (from 6259 to 6543) whereas it was 70% for the 1972-81 period (see Table 2). As for the number of staff, the rate of increase was 14.9% over the 1981-90 period (from 132313 to 151982) which was much lower than the rate of 64% during the 1971-81 period.
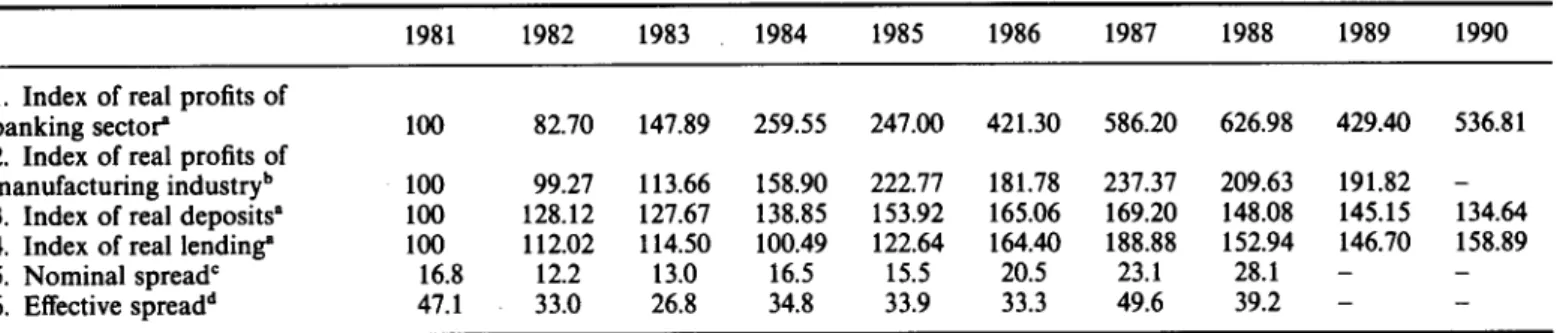
Together with these developments, the profitability ofthe banking system gained enormous momentum during the financial liberalization era. As shown in Table 3 real profits of the private commercial banks have increased as much as five fold over the 1981-90 period, surpassing the real profit-ability index of manufacturing firms by as much as 2.25 times as of 1989. Moreover, neither a modest real increase in deposits (34%) and loans (58%) nor the developments in the nominal and efTective spreads can explain the sharp profit increase entirely. Then, taking the cost saving measures 'For a more comprehensive review of policies during the financial liberalization era see Akkurt et al. (1991).
Efficiency of Turkish commercial banks
Table 3. Indicators of profitability
1. Index of real profits of banking sector'
2. Index of real profits of manufacturing industry*" 3. Index of real deposits' 4. Index of real lending" 5. Nominal spread' 6. Effective spread"* 1981 100 100 100 100 16.8 47.1 1982 82.70 99.27 128.12 112.02 12.2 33.0 1983 147.89 113.66 127.67 114.50 13.0 26.8 1984 259.55 158.90 138.85 100.49 16.5 34.8 1985 247.00 222.77 153.92 122.64 15.5 33.9 1986 421.30 181.78 165.06 164.40 20.5 33.3 1987 586.20 237.37 169.20 188.88 23.1 49.6 1988 626.98 209.63 148.08 152.94 28.1 39.2 1989 429.40 191.82 145.15 146.70 -— 1990 536.81 -134.64 158.89 -— Notes:
° Deflated by Consumer Price Index;
^ Total profits of 500 largest firms deflated by Producer Price Index;
Sources: Rows: 1,3,4: Various publications of Banks Association of Turkey; 2: Petrol-I§ Almanac (1990); 5,6: Qapoglu (1990). ° Efl^ective spread = average lending rate - average deposit rate.
(T — c
' Effective spread = effective lending rate - average deposit rate. Effective lending rate is calculated as follows: r. = where Tj = the effective lending rate, r^ = the average lending rate, c = the ratio of compensating balances to total commercial loans and r<, = the deposit rate on compensating balances.
described above into consideration, one has to rely on increased efficiency in the banking sector as a whole while trying to explain the success of the sector.
The section below summarizes the methodology that is used to investigate the effects of liberalization policies on economic efficiency of the commercial banks.
III. MODEL
To investigate the effects of liberalization policies on the economic efficiency of Turkish banks at the micro level a nonparametric frontier methodology is applied to the commercial banks for both pre and post liberalization eras. The method of analysis has been used in most of the pre-vious bank efficiency studies. For example, Sherman and Gold (1985), Parkan (1987), Vassiloglu and Giokas (1990) have analysed the efficiency differences between bank branches whereas Rangan et al. (1988), Aly et al. (1990), Charnes, et al. (1990), Ferrier and Lovell (1990), Berg et al. (1991), Drake and Weyman-Jones (1992) and Fukuyama (1993) have focused on the efficiency differences between banking firms.
The method used has been introduced by Farrell (1957). In his influential work, Farrell (1957) showed how one can measure productive inefficiency and its components al-locative and technical inefficiencies within a theoretically meaningful framework. His initial approach has been ad-opted and extended by Farrell and Fieldhouse (1962), Sietz (1970), Afriat (1972) and Meller (1976). In more recent stud-ies Fare et al. (1982), Banker et al. (1984), Fare et al. (1985) showed how one can decompose Farrell's measure of tech-nical inefficiency and can extract information on the scale of the unit investigated.
The approach utilizes a sequence of linear programs to construct a transformation frontier to compute efficiency measures relative to the frontier. To describe the theoretical underpinnings of the model used, suppose we observe a sample of K production units, each of which uses inputs XeRt available at prices weRi to produce outputs yeR'^ in an environment characterized by variables neR% and aeR+. As a matter of notation, let xf be the quantity of input i used by unit k and let _v* be the quantity of output i produced by unit k. These data can be placed into data matrixes .Jf, a KxM matrix of output levels whose k, ith element is y'l and JV a KxN matrix of input levels whose k, ith element is xf.
Environmental variables fx and a are exogenously fixed inputs and outputs that a decision making unit cannot control at least in the short run. The decision making units would like to limit the elements of /i as much as possible given outputs. For the exogenously fixed outputs, the deci-sion making units would like to expand the elements of a as much as possible given inputs. Again for notational con-venience let the data on these be placed into data matrixes P,aKxS matrix of exogenously fixed inputs (or categorical variables) whose k, ith element /z? and Ra KxT matrix of exogenously fixed outputs whose k, ith element is aj.
Using the notation at hand and assuming that the pro-duction process satisfies strong disposability of inputs and variable returns to scale (VRS), for any yeR'^ production possibilities can be characterized in terms of input require-ment set Hy), which can be constructed from observed input-output data by means of
L(y) = ^Jf, z^ a.
O. Zaim
In this representation, z is a Kxl intetisity vector, y = {yi,y2,---, ysf) is a vector of outputs produced and AC = (xj, X2,..., Xjv) is a vector of inputs utilized by a par-ticular firm. Similarly, a = (otj, (X2,..., a,-) is a vector of exogenously fixed outputs and fi = {ni,n2,... ,Hs) is a vec-tor of exogenously fixed inputs of a particular production unit. Intuitively this equation constructs a reference techno-logy from the observed inputs and outputs. Relative to this bounding technology the technical efficiency of each obser-vation is calculated by solving K linear programming prob-lems of the form:
Fix"; y") = mink Subject to
kx" • OL"
efficiency scores will be less than or equal to those calculated with NIRS technology. Then, for any observation which operates under NIRS, the equality between the efficiency scores from CRS and NIRS technologies implies CRS and inequality implies DRS.
One by-product of this methodology is the decomposi-tion of technical efficiency into the propordecomposi-tional reducdecomposi-tion in input usage if inputs were not wasted (pure technical efficiency) and that reduction if there existed CRS (scale efficiency). The degree of scale efficiency can be computed simply by dividing the efficiency scores obtained from CRS technology by the efficiency scores obtained from VRS technology.
If input price vectors are known the cost efficiency of each unit may be calculated by solving K additional linear pro-grams of the form:
, vv*) = minvvx* (2) Subject to
= 1
*=!
where the superscript k denotes a production unit. The solution vector X in the problem above measures the frac-tion by which a firm can multiply its input vector and can still produce no less of any output. If it is not possible to produce the existing outputs with a radially smaller input vector, then k takes the value of one expressing that the unit under investigation is technically efficient. The choice of this input saving efficiency measure is in coherence with the expressed interest in the banking sector to reduce the costs. In the formulation above, technical efficiency is calculated relative to a production frontier that satisfies VRS. How-ever, by altering the constraint on the intensity vector z one can also construct production frontiers that satisfy different scale assumptions such as constant returns to scale (CRS) (by deleting the constraint Y^^iZk = 1) and nonincreasing returns to scale (NIRS) (by changing the constraint on the intensity vector from ^ f = 1 z» = 1 to ^j^= 1 z^ ^ 1).
By comparing the efficiency scores obtained from produc-tion frontiers with different scale assumpproduc-tions, one can also find out at which scale the unit operates. Since VRS produc-tion frontier envelopes the data more closely than NIRS production frontier, the comparison efficiency scores from these two frontiers will reveal information on whether a par-ticular unit is operating under IRS or NIRS. While the equality between the two scores indicates NIRS technology, the inequality means that the unit operates under IRS. Furthermore, since a production frontier with CRS assump-tion envelops the data least closely of all, the resulting
X*
a*
(3)k = l
The solution vector xJ, is the cost minimizer for the input price vector vv* and the output vector / for a technology which satisfies strong disposability of inputs and VRS. Once the solution vector xJ, is obtained, the measures of cost efficiency C(x*; / , w") and allocative efficiency ^(x*; / , vv*) can be computed by
(4)
(5)
>l(x*;/,w*) =
C(x*;/,w*)
Fix";/)
where F(x*;/) is the technical efficiency score obtained from a technology which satisfies strong disposability of inputs and VRS. These measures can be easily modified if interest centres on the percentage by which cost is increased due to production inefficiency and its components technical and allocative inefficiencies. For example, C"* — 1 measures the percentage by which cost is increased due to both types of inefficiencies, A" * — 1 measures he percentage by which cost is increased due to allocative inefficiency alone. Finally, C~^ - A~^ shows the percentage by which cost is increased due to the technical inefficiency.
IV. DATA AND EMPIRICAL RESULTS
The literature which models the bank production and behav-iour is divided into two distinct categories with respect to the measurement of banks' inputs and outputs. Humprey (1985) made a useful distinction between production approach and intermediation approach to the bank behaviour. Under the production approach banks are considered as producing deposits and loans using capital, labour and materials. The proponents of this approach use the number of accounts and loans outstanding as banks' outputs. Their measure of total costs include all operating costs incurred in the production of outputs. The intermediation approach treats banks as collec-tors of funds which are then intermediated to loans and other assets. The total balances of deposits^ and loans is the appro-priate measure of bank output in this case and operating plus interest costs provide the appropriate measure of total costs. In spite of this behavioural distinction, work of Berg et al. (1991) implies that the production frontier is invariant to how the output is measured. As they put it:
"... we found that important characteristics of the effici-ency frontier for Norwegian banking are about the same whether we choose to measure output by the number of accounts and their average size or by the total balances of the accounts. This applies to the size of efficiency gains as well as to our results on economies of scale".
In this study the intermediation approach to banking behaviour is adopted. The outputs are defined as the total balances of different loans and deposits categories while total costs are measured as the sum of operating costs plus interest costs. ^ The data are compiled from the publications of the Banks Association of Turkey which publishes yearly income statements and balance sheets of each bank. The representative years for pre and post liberalization eras are chosen as 1981 and 1990 respectively. The year 1981, instead of 1980, is chosen to establish conformity with the data used for post liberalization era.* The sample for the 1990 data set consists of all 56 commercial banks that operate at that time. The sample for the pre liberalization era which origin-ally consisted of 42 commercial banks, excludes three state banks since their income statements reflect some of their non-banking activities as well. Variables used for the models described above are the following:
261
Outputs:
yi = Total balance of demand deposits ^2 = Total balance of time deposits y3 = Total balance of short-term loans y4. - Total balance of long-term loans Inputs:
Xl = Total number of employees X2 = Total interest expenditures X3 = Depreciation expenditures X4. = Expenditures on materials Input price:
Wl = Total expenditures on salaries and fringe benefits/xi Total costs:
C = WiXi + X2 + X3 + X4
Environmental variables:
0.1 = Average size of demand deposit accounts 012 = Average size of time deposit accounts Hi = Number of branches
1x2 = Institutional type (1 for national 0 for foreigner) Definitions of input variables are less than ideal. In principle capital and material inputs should be measured in physical units, but that has not been possible in the absence of explicit price indexes for these variables. Assuming that all banks face the same input prices, expenditures and balances are measured in nominal terms* (in million TL).
Production frontier results
For each bank in the sample of 56 for the year 1990 and 39 for the year 1981, the linear programming problem 2 is solved for all scale assumptions. Table 4 and Table 5 below gives summary statistics of the efficiency scores and returns to scale for pre and post liberalization eras.
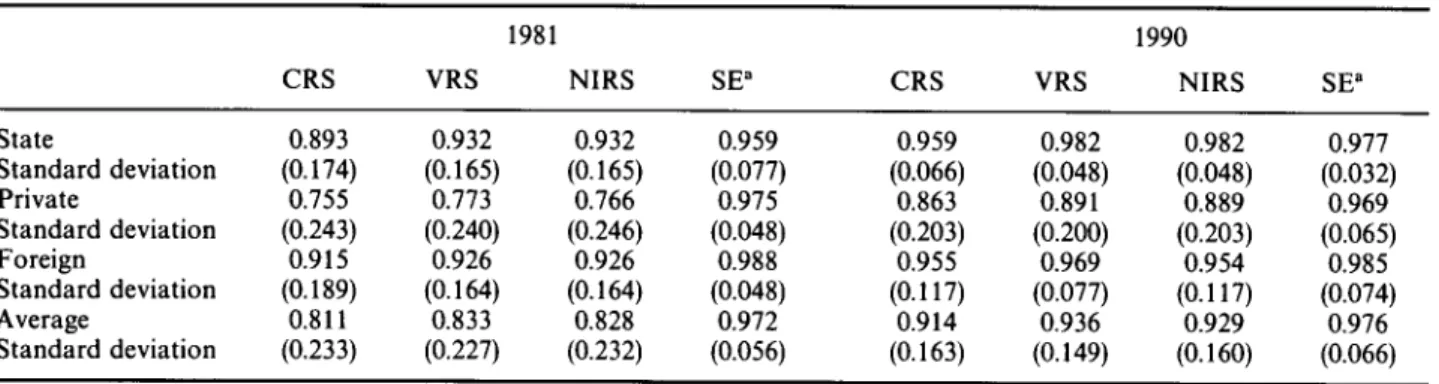
These tables point out some striking facts on how liberal-ization policies have fostered competition. First, the level of technical efficiency has increased by 10% on the average from 1981 to 1990. Note that all entries for technical effi-ciency scores in 1981 are smaller than those of 1990. Second-ly, technical efficiency differences between the banks have
^In the banking literature, there is a considerable controversy on whether deposits should be treated as inputs or outputs (see, for instance, Berger and Humprey, 1992 for a comprehensive discussion). Berger and Humprey use value added approach and consider all banking functions which are associated with a substantial labour or physical capital expenditure to produce a How of banking services as outputs. ' I n Turkish banking there is reasonable competition among the commercial banks to attract deposits. Especially during the pre liberalization era banks have incurred heavy costs to be able to collect deposits within an environment where there was no price competition. Therefore deposits do contain a significant portion of the value added of the banking system. At the same time over 45% of the banks' assets are loans to the industries, agriculture and other sectors in both eras and therefore these loans also have a significant value added portion. This provides a reasonable justification for treating both deposits and loans as outputs in the Turkish banking system. * The format of balance sheets and income statements have been redesigned after 1980.
' Here by implicitly assuming that all prices have increased at the same rate between 1981 and 1990 we rule out the necessity of any deflation while comparing the efficiency scores obtained from two cross-section data.
0. Zaim
Table 4. Average technicai efficiency scores under different scale assumptions
State Standard deviatioti Private Standard deviation Foreign Standard deviation Average Standard deviation CRS 0.893 (0.174) 0.755 (0.243) 0.915 (0.189) 0.811 (0.233) 1981 VRS 0.932 (0.165) 0.773 (0.240) 0.926 (0.164) 0.833 (0.227) NIRS 0.932 (0.165) 0.766 (0.246) 0.926 (0.164) 0.828 (0.232) SE° 0.959 (0.077) 0.975 (0.048) 0.988 (0.048) 0.972 (0.056) CRS 0.959 (0.066) 0.863 (0.203) 0.955 (0.117) 0.914 (0.163) VRS 0.982 (0.048) 0.891 (0.200) 0.969 (0.077) 0.936 (0.149) 1990 NIRS 0.982 (0.048) 0.889 (0.203) 0.954 (0.117) 0.929 (0.160) SE" 0.977 (0.032) 0.969 (0.065) 0.985 (0.074) 0.976 (0.066) Note: "SE = Scale Efficiency
Table 5. Developments in returns to scale
1981 1990
Number of banks with CRS Number of banks with DRS Number of banks with IRS Total 23 6 10 39 59% 15% 26% 100% 38 13 5 56 68% 23% 9% 100%
decreased in time. This evidence is due to the fact that standard deviations of technical efficiency scores in each group in 1981 are greater than those of 1990. Thirdly, banks have gone through a considerable scale adjustment and were successful in achieving optimal scale. Examination of Table 5 shows that the proportion of banks that operate at the optimal scale has increased from 59% in 1981 to 6 8 % in 1990. Further decomposition of technical efficiency reveals that in both eras, on the average, much of the inefficiency is from the pure technical component (0.833 in 1981 and 0.936 in 1990) compared to that arising from scale inefficiency (0.972 in 1981 and 0.976 in 1990). This observation holds for all bank classes except for the state banks in 1990. For the state banks, the dominant source of technical inefficiency seems to be scale inefficiency in 1990. This finding of the dominant effect of pure technical efficiency over scale effi-ciency is in accordance with the conclusions reached by Aly
et al. (1990) for US banking, and Fukuyama (1993) for
Japanese banking. However, the results in Table 5, which show that for Turkish Banking the prevalent form of returns to scale is CRS in both eras, differ considerably from the results on other countries. Berg et al. (1991) for Norwegian banks, Drake and Weyman-Jones (1992) for UK building societies report that the majority of banks in their samples operate at the range of DRS. Contrary results are provided by Ferrier and Lovell (1990) for US banks and Fukayama (1993) for Japanese banks, who state that over 80% of banks in their samples exhibit IRS.
One other important fact is that the rate of change of technical efficiency has been greater in private banks com-pared to state and foreign banks. This, while closing the efficiency gap between the banks, is also an indication of who benefits the most from the liberalization policies which foster competition.
Cost frontier results
In the cost version to be used presently, the method of inefficiency measurement takes on a rather simple and intuitively appealing form. That is, a bank is said to be cost inefficient if it is dominated by one or more banks in the following sense: (a) The other banks have lower expenses than its own expenses; and (b) The other banks have all their output indicators greater or equal to its own indica-tors.
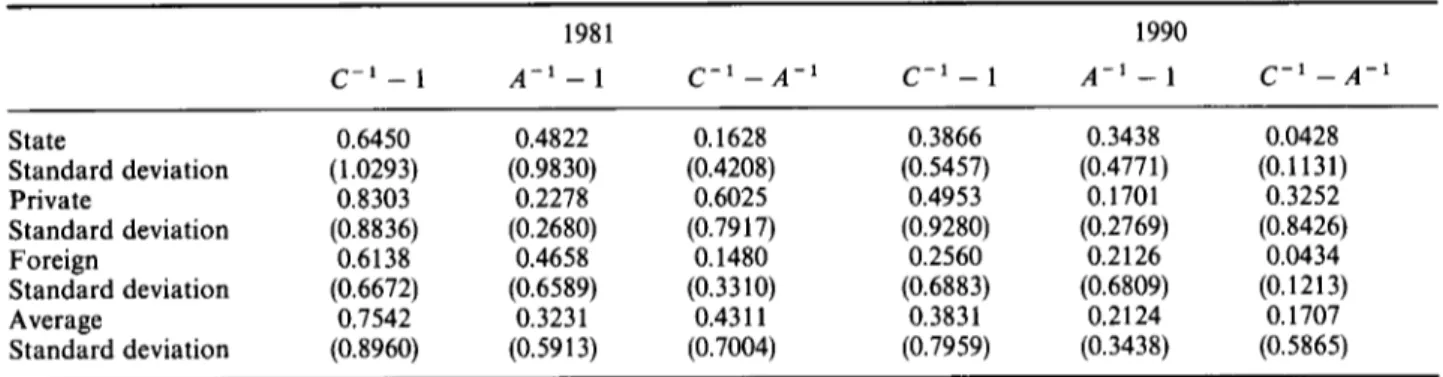
To determine the cost inefficiency and its components, the procedure described in problem 3 is repeated for each bank in the samples that represent pre and post liberalization eras. Table 6 gives the summary results for the indexes which show the average amount by which cost is increased due to production inefficiency and its components allocative and technical inefficiencies for each owner class.
Evidence on cost efficiency indicates that, on the average, costs were 75% above the minimum in 1981 and this figure almost halves in 1990 to 38%. A close inspection of Table 6 shows that in both periods private and state banks differ with respect to the relative effects of allocative and technical inefficiencies on costs increases. While in state banks a large portion of the cost inefficiency is due to allocative ineffi-ciency, same is not true for private banks. For private banks the main determinant for cost inefficiency seems to be the technical inefficiency.
A comparison of the rate of improvements of different ownership classes through years indicates that a relatively higher rate of improvement over the cost inefficiency in private banks closed the efficiency gap between the state and
Efficiency of Turkish commercial banks
Table 6. Effect of technical and allocative inefficiencies on cost increases
State Standard deviation Private Standard deviation Foreign Standard deviation Average Standard deviation Table 7. Developments in Bank classes Technical and allocatively efficient banks Only technically efficient banks Technically and allocatively inefficient banks Total C~* — 1 0.6450 (1.0293) 0.8303 (0.8836) 0.6138 (0.6672) 0.7542 (0.8960) 1981 A - ' - l 0.4822 (0.9830) 0.2278 (0.2680) 0.4658 (0.6589) 0.3231 (0.5913)
the economic efficiency
Number of banks 15 (38%) 8 (21%) 16 (41%) 39 (100%) 1981 share share of yi of y2 81 80 6 5 13 15 100 100 C-^-A 0.1628 (0.4208) 0.6025 (0.7917) 0.1480 (0.3310) 0.4311 (0.7004) share of y3 81 3 16 100 1 ~ ' share of y4 81 13 6 100 c - ' - i 0.3866 (0.5457) 0.4953 (0.9280) 0.2560 (0.6883) 0.3831 (0.7959) Number of banks 31 (55%) 10 (18%) 15 (27%) 56 (100%) 1990 A~^ t v*i — 1 0.3438 (0.4771) 0.1701 (0.2769) 0.2126 (0.6809) 0.2124 (0.3438) share ofy. 79 15 6 too C-^-A 0.0428 (0.1131) 0.3252 (0.8426) 0.0434 (0.1213) 0.1707 (0.5865) 1990 share ofy2 81 14 5 100 1 ~ ' share of y3 75 16 9 100 share ofy* 86 12 2 100
private banks. To complement the analysis of the effect of liberalization policies on economic efficiency, Table 7 is designed. Table 7 classifies the banks in three categories as banks which are economically efficient, the ones which are only technically efficient and those which are economically inefficient, and shows their respective weights in the finan-cial system for both eras.
A comparison of pre and post liberalization eras in Table 7 gives enough evidence that liberalization policies have encouraged a more efficient use of resources in the banking industry. As a result the proportion of fully efficient banks has increased from 38% in 1981 to 55% in 1990. A high relative share of deposits and loans that accrue to the efficient banks in both eras, is an indication ofthe soundness of the financial system in Turkey.
V. C O N C L U S I O N
Financial reform seems to have succeeded in stimulating the commercial banks to take measures that would enhance both technical and allocative efficiency. As a result, the number of efficient banks has increased in time. Further-more, the following are the main findings of the study. First,
a comparison of efficiency scores indicates that state banks are more efficient than their private counterparts. This contradicts the hypothesis which asserts that public owner-ship is inherently less inefficient at least for the banking industry in Turkey. Secondly, banks have also gone through a considerable scale adjustment and were successful in achieving the optimal scale. Thirdly, the effect of allocative and technical inefficiencies on cost increases is different for private and state banks. While state banks are more vulnerable to allocative inefficiency, the effect of technical inefficiency on cost increases is more dominant for private banks.
A C K N O W L E D G E M E N T S
I owe special thanks to an anonymous referee and Syed F. Mahmud for their comments.
R E F E R E N C E S
Afriat, S. N. (1972) Efficiency estimation of production functions.
O. Zaim
Akkurt A., Hakioglu, D., Karayal^m, A., K05, N., Ozcet, C , §enel, A., Usta, N., Varol, 0 . (1991) Developments in the Turkish banking sector 1980-1990, Working Paper, Central Bank of Republic of Turkey.
Aly, H. Y., Grabowski, R., Pasurka, C. and Rangan, N. (1990) Technical, scale and allocative efficiencies in US banking an empirical investigation. The Review of Economics and
Statis-tics, 72, Hl-lS.
Banker, R. D., Charnes, A. and Cooper, W. W. (1984) Models for estimation of technical and scale inefficiencies in data en-velopment analysis. Management Science, 30, 1078-92. Berg, S. J., Forsund, F. R. and Jansen, E. S. (1991) Technical
efficiency of Norwegian banks: the nonparametric approach to efficiency measurement. The Journal of Productivity
Ana-lysis, 2, 127-42.
Berger, A. N. and Humprey, D. B. (1992) Measurement and effici-ency issues in commercial banking, in Z. Griliches (ed.).
Measurement Issues in Service Sectors, NBER, University of
Chicago Press, Chicago, IL, pp. 245-79.
Capoglu, G. (1990) The effect of financial liberalization on the efficiency of the Turkish financial system in 198O's, paper presented at the fifth annual conference of the European Economic Association, Lisbon.
Charnes, A., Cooper, W. W., Sun, D. B. and Huang, Z. M. (1990) Polyhedral cone-ratio DEA models with an illustrative ap-plication to large commercial banks. Journal of Econometrics, 46, 73-91.
Drake, L. and Weyman-Jones, T. G. (1992) Technical and scale efficiency in UK building societies. Applied Financial
Econ-omics, 2, 1-9.
Fare, R., Grabowski, R. and Grosskopf, S. (1985) Technical efficien-cy of Philippine agriculture. Applied Economics, 17, 205-14. Fare, R., Grosskopf, S. and Lovell, C. A. K. (1982) The Measurement
of Efficiency of Production, Kluwer-Nijhoff Publishing, Boston.
Farrell, M. J. (1957) The measurement of productive
efficiency,-Journal ofthe Royal Statistical Society, A125, 258-81.
Farrell, M. J. and Fieldhouse, M. (1962) Estimating efficient pro-duction function under increasing returns to scale. Journal of
the Royal Statistical Society, A125, 252-67.
Ferrier, G. D. and Lovell, C. A. K. (1990) Measuring cost efficiency in banking: econometric and linear programming evidence.
Journal of Econometrics, 46, 229-45.
Fukuyama, H. (1993) Technical and scale efficiency of Japanese commercial banks: a non-parametric approach. Applied
Econ-omics, 25, 1101-12.
Humprey, D. B. (1985) Costs and scale economies in bank inter-mediation, in R. C. Aspinwall and R. Eisenbeis (eds.).
Hand-book of Banking Strategy, Wiley, New York, pp. 745-83.
Meller, P. (1976) Efficiency frontiers for industrial establishment of different sizes. Explorations in Economic Research,
Occa-sional of the National Bureau of Economic Research, 3
379-407.
Parkan, C. (1987) Measuring the efficiency of service operation: an application to bank branches. Engineering Costs and
Produc-tion Economics, 12, 237-42.
Rangan, N., Grabowski, R., Aly, H. Y. and Pasurka, C. (1988) The technical efficiency of US banks. Economic Letters, 28 169-75.
Seitz, W. D. (1970) The measurement of efficiency relative to a frontier production function, American Journal of
Agricul-tural Economics, 52, 505-11.
Sherman, H. D. and Gold, F. (1985) Branch bank operating effici-ency: evaluation with data envelopment analysis. Journal of
Banking and Finance, 9, 297-315.
Vassilogu, M. and Giokas, D. (1990) A study of the relative efficiency of bank branches: an application of data envelop-ment analysis. Journal of Operational Research Society, 41(7), 591-97.