©BEYKENT UNIVERSITY
AN EFFICIENCY STUDY IN TURKISH
TELECOMMUNICATION COMPANY
USING DATA ENVELOPMENT ANALYSIS
Mehmet E. BAYSAL
Selçuk Üniversitesi, Endüstri Mühendisliği Bölümü, KonyaDidem ALTUN
Türk Telekom A.Ş. Aydınlıkevler, AnkaraBilal TOKLU
Kırıkkale Üniversitesi, Endüstri Mühendisliği Bölümü, KırıkkaleABSTRACT
The knowledge has become very important significantly owing to the technologic developments over the world. It has been obviously seen that the societies accessing the knowledge easily, develop in terms of social and economic more rapidly than the others. This situation emphasizes importance to the telecommunication sector providing the infrastructure necessary for transferring the information. As an incumbent operator, with its subunits Türk Telekomünikasyon A.Ş. is responsible for dispersing the telecommunication services all over the country. The Province Telecom Directorships have an important role in operating the telecommunication services, providing these services to customers and constructing the infrastructure for these services. In this study for the purpose of providing service quality and customer satisfaction all over the country and using the sources conveniently, an efficiency analysis of The Province Telecom Directorships is performed by using data envelopment analysis. This study consists of two stages. In the first stage efficient Province Telecom Directorships and the Province Telecom Directorships reference to the inefficient Province Telecom Directorships in order to provide them locating in the efficient frontier is determined by using the CCR formulation based on the constant returns to scale assumption. In the second stage of the study The Province Telecom Directorships determined efficient according to the CCR formulation are ranked by using cross efficiency.
Keywords : Data envelopment analysis, Telecommunication, Cross efficiency ÖZET
Dünyada yaşanan teknolojik gelişmelerle beraber bilginin önemi oldukça artmıştır. Bilgiye daha kolay erişen toplumların sosyal ve ekonomik anlamda daha hızlı kalkındıkları açıkça görülmektedir. Bu durum da bilgi aktarımı için gerekli alt yapıyı sağlayan telekomünikasyon sektörüne verilmesi
gereken önemi vurgulamaktadır. Ülkemizde Türk Telekomünikasyon A.Ş. yerel operatör olarak; bünyesinde bulunan alt birimlerle telekomünikasyon hizmetlerinin ülke genelinde yaygınlaştırılmasından sorumludur. Telekomünikasyon hizmetlerinin işletilmesi, müşteriye ulaştırılması, gerekli altyapının kurulmasında İl Telekom Müdürlükleri oldukça önemli bir role sahiptirler. Bu çalışmada hizmet kalitesinin ve müşteri memnuniyetinin tüm ülke genelinde sağlanması, kaynakların uygun bir şekilde kullanılması için İl Telekom Müdürlüklerinin veri zarflama analizi kullanılarak etkinlik analizi yapılmıştır. Çalışma iki aşamadan meydana gelmiştir. İlk aşamada ölçeğe göre sabit getiri varsayımına dayanan CCR modeli kullanılarak etkin olan İl Telekom Müdürlükleri ve etkin olmayan İl Telekom Müdürlüklerinin etkinlik sınırında yer alabilmesi için referans almaları gereken İl Telekom Müdürlükleri belirlenmiştir. Çalışmanın ikinci aşamasında ise çapraz etkinlik yöntemi kullanılarak CCR sonucu etkin olarak bulunan İl Telekom Müdürlükleri arasında bir sıralama yapılmıştır.
Anahtar Sözcükler: Veri zarflama analizi, Telekomünikasyon, Çapraz etkinlik
1.INTRODUCTION
By the technological developments, there are too many massive and rapid alterations exist on the world. Globalization is the most important result of this alteration [1] . With globalization, the importance of the knowledge is increased and the rapid developments on the knowledge technology begin to change economy and society [2] . The leading sector within these processes occurred, is the telecommunication sector [1].
Today, while the telecommunication services are the inseperable part of the social life, they became the chief infrastructure for economic development at the same time. The importance of telecommunication for development and progress is increased by the tendency of liberalization and globalization observed in the world economy from the beginning of the 1980's. By the the world economy was transformed to a more liberal structure, the need for knowledge and telecommunication services which provide data flow were increased gradually and diversified. Also, the tecnological developments occurred in the telecommunication sector act an important role on the globalization of both telecommunication sector and the world economy [4].
The contribution of the telecommunication sector to country economy is very important. It could be listed as follows;
• The correlation between the deployment of Telecom and Gross National Product (GNP) is very attractive.
• The developments in Telecom is very important not only for that sector but also for whole country economy and its development.
• The place of the deployment of one country's telecommunication services is also an indicator of that country's improvement at the same time [13].
Almost all country Telecommunication services on the world are monopols that have one past century. When we look at our country, we see that the monopolistic authorization Türk Telekom had is removed by the beginning of 2004. In the same year, many companies have begun to take authorization for giving telecommunication services. But, since most of these companies had not begun to give service actively and the companies giving service could not transport voice as Türk Telekom's qualifications, it could be said that Türk Telekom conserves its monopolistic situation yet.
Türk Telekom, which has the 13th biggest infrastructure on the world,
has become the sector's indispensable actor with its experience and its services reflected by contemporary technology. The company, which has based on Postane-i Amire ( Post Offices Superiority) that was published 1840 and built its first 50 line telephone exchange in 1909 at İstanbul Grand Post Office building, now turn into powerful organization in information and telecommunication technologies with its 55 thousand personnel and 19 million subscribers [14].
Türk Telekom is Turkey's reliable telecommunications provider with its customer and quality oriented approach as well as it acts an efficient role on transition to information society by its advanced technology and widespread services. With this aim, it provides creative solutions that covers developing customer needs efficiently with appropriate costs, increases the customer satistaction by raising the service quality, sets up an enterprise approach oriented on customer and services provided and develops technological infrastructure and system integration for being an organization that reaches, processes and distributes knowledge rapidly.
In this study for the purpose of providing service quality and customer satisfaction all over the country and using the sources conveniently, an efficiency analysis of The Province Telecom Directorships is performed by using Data Envelopment Analysis(DEA). In the second part of the work, some information about theoritical infrastructure and historical development of DEA is given, in the third part, application practised takes part and in the fourth part results are evaluated.
2. DATA ENVELOPMENT ANALYSIS (DEA)
DEA, which is based on Farrell's (1957) theoretical approach for determination of performance efficiency, is a non-parametric method developed for measuring the relative efficiency of similar economic decision making units (DMU) in scope of produced products or services by Charnes, Cooper and Rhodes (CCR)[15].
CCR model was used for only measurement of technical efficiency under the constant return to scale assumption. Then, DEA approach is modified to become possible to measure the scale and technical efficiencies separately in the case of profits according to scale is not constant [15]. Banker, Charnes and Cooper (1984) are developed BCC model to determine the technical efficiency and scale efficiency. BCC model makes the CCR model's assumption of constant profit according to scale flexible and makes possible to research decision makers performance in case of multiple input or multiple output under the consideration of incerasing, decreasing or constant profit according to scale [16]. As a result, total efficiency is evaluated as scale efficiency and technical efficiency [11].
DEA structures an efficiency frontier based on input and output values [7]. Goal of DEA is to maximize the ratio of virtual output formed by the weighted average of outputs under the constraint of none of DMUs could be beyond the efficient frontier to virtual input formed also by the weighted average of inputs[12]. While DMUs on the frontier are defined as efficient, it is concluded that the ones in the frontier are inefficient. Any of DMUs efficiency ratio is existed as the distance between this frontier and the point itself [7].
The main purpose of this method is to determine projection of all DMUs on that frontier.The DMUs that are not on the efficient frontier could be efficient by likening them to the DMUs on the frontier that are nearest to them according to inputs and outputs or theoretical unit that is obtained from these DMUs[9].
Relative efficiency concept takes place of exact efficiency concept in the DEA method [11]. The relative efficiency in the DEA method is obtained by the ratio of the weighted gathered outputs to the weighted gathered inputs. By the aim of to measure the relative efficiency of DMUs, fractional linear programming model for every D M U should be set and solved. DMUs could be used different weights for measurement of efficiency. Weights could be selected for every D M U so as to maximize the efficiency score. And this give the advantage of giving the highest weight values to every DMU for the variable which is the best. To prevent this, the constraints of weights being positive and if same weights are used by different DMUs the constraint of efficiency value does not exceed 1 is added to the model [5].
To make decomposition ability of DEA model efficient, it is desired that the number of inputs and outputs are very much. Consequently, as much as input and output elements should be selected. But selected input and output elements should be used by all DMUs. If there are m inputs and p outputs, at least m+p+1 DMU is a necessary constraint for the reliability of research. And another constraint is that the number of DMUs evaluated, should be at least twice of variable number[3].
DEA could determine; efficiency frontier composed by efficient DMUs, the most efficient and least efficient DMU, reference set for each inefficient
DMU, target input/output values that would make DMUs relative efficient and inputs and outputs that should be improved primarily[7].
DEA is today's one of the most successfull Operations Rsearch (OR) technique with its wide literature and wide application areas. The flexibility of DEA is observed much of real world applications that include school, hospital, university, public foundation and banking sectors. DEA could be also applied to telecommunications and computer networks. However this area is the least worked when it is compared with the others. Some of the major studies in this area are; Sueyoshi(1996), Façanha, Resende(2003), Façanha, Resende(2004), Uri(2000), Uri(2001), Giokas, Pentzaropoulas(2000), Giokas, Pentzaropoulas(2002), Shin, Shon(2003), Koski, Majumbar(2000), Lien, Peng(2000) and Tavares. When it is looked at these studies, generally it is seen that local operators and other telecommunications enterprises are compared after privatization applications or efficiency analysis in scope of telecommunications in OECD contries is performed[7].
3.APPLICATION
Türk Telekom A.Ş. is occurred from General Directorate, Province Telecom Directorates, Telecom Chieftaincies and independent units. While, planning of services would be given, providing infrastructure needed and giving the strategic decisions are being carried out in General Directorate, operations of these services, transportation of them to costumers and setting infrastructure needed are performed by Telecom Directorates and Telecom Chieftaincies. For not to disarrange the homogenity and to use coherent data with a necessity of DEA, Province Telecom Directorates are selected as DMUs. In respect of this, on the point of one per province and two for İstanbul, 82 Province Telecom Directorates is analized by CCR model and then by using cross efficiency method, efficient DMUs are sorted among each other.
By the result of regression analysis and studies performed earlier in the literature, inputs and outputs are determined as;
Inputs:
1. Personnel Number ( Includes marketing, operations and security personnel for each Province Telecom Directorate)
2. Number of disorders ( Telephone, Data and ADSL disorders) 3. Total Expenses
Outputs:
1. Number of Telephone Lines 2. Revenue from ADSL
In this application CCR method that consists of constant profit according to scale approach developed by Charnes, Cooper and Rhodes (1978) is used. The mathematical programming formulation for so-called method is as follows:
m p Ek = Min a - e . ±
s- -
e . ±s+
i =1 r=1 Subject to: ¿ T j+ s- -
a.X
m = 0, j=1± Y ^ - s+- Yrk =
0 j=1 X > 0, j = 1,...,n s- > 0, i = 1,...,ms+ >
0, r = Here;a : contraction coefficient to determine the amount of inputs of the kth
DMU whose relative efficiency measured, how many would it be reduced Yrk: rth output produced by the kth DMU
Xik : ith input used by the kth DMU
Yrj : rth output produced by the Ith DMU
Xij : ith input used by the Ith DMU
Xj : intensity factor of the Ith DMU
s- : Slack value of ith input for the kth DMU
s+ : Slack value of rth output for the kth DMU
e : defined as a very small positive number
If so-called D M U is efficient the relative efficiency factor is equal to one (Ek =1) and there would be no change in the input and output vectors (a =
1, s- = 0, s+ = 0). And separately in the reference set of itself , there is no
change its value and Xk= 1 equality exists. On the other hand if the DMU is not
efficient, the contraction coefficient "a" that determines the amount of inputs of the kth DMU whose relative efficiency measured, how many would it be
reduced would get value less than 1. This situation means that there would be a radial reduction in the input vector.
The virtual unit obtained from the DMUs in the reference set of the inefficient DMU could be calculated as follows;
X
KB= i±X
ijA
ior X
KB=
aX
K- s
-¿—i i j i j=1
i = 1,...,m
Y
kb= £ Y
jAJor Y
kb= Y
k+
j = 1
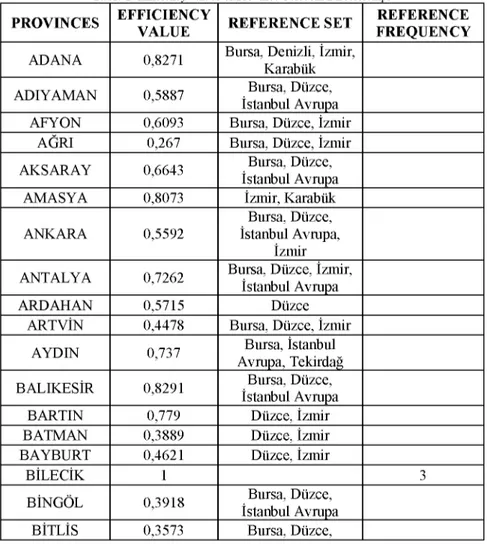
The results of efficiency analysis is seen on Table 1. According to this, while, Bilecik, Bursa, Denizli, Düzce, İstanbul Anadolu, İstanbul Avrupa, İzmir, Karabük, Kocaeli, Kütahya, Tekirdağ Province Telecom Directorships could get certain output combination by using the most efficient input combination, the other Province Telecom Directorships become efficient by selecting the closer DMU to itselves according to inputs and outputs as a reference point.
Table 1. Efficiency values of Province Telecom Directorships
PROVINCES EFFICIENCY
VALUE REFERENCE SET
REFERENCE FREQUENCY
ADANA 0,8271 Bursa, Denizli, İzmir, Karabük ADIYAMAN 0,5887 Bursa, Düzce,
İstanbul Avrupa AFYON 0,6093 Bursa, Düzce, İzmir
AĞRI 0,267 Bursa, Düzce, İzmir AKSARAY 0,6643 Bursa, Düzce,
İstanbul Avrupa AMASYA 0,8073 İzmir, Karabük ANKARA 0,5592
Bursa, Düzce, İstanbul Avrupa,
İzmir ANTALYA 0,7262 Bursa, Düzce, İzmir,
İstanbul Avrupa
ARDAHAN 0,5715 Düzce
ARTVİN 0,4478 Bursa, Düzce, İzmir AYDIN 0,737 Bursa, İstanbul
Avrupa, Tekirdağ BALIKESİR 0,8291 Bursa, Düzce,
İstanbul Avrupa
BARTIN 0,779 Düzce, İzmir
BATMAN 0,3889 Düzce, İzmir
BAYBURT 0,4621 Düzce, İzmir
BİLECİK 1 3
BİNGÖL 0,3918 Bursa, Düzce, İstanbul Avrupa BİTLİS 0,3573 Bursa, Düzce,
İstanbul Avrupa BOLU 0,855 Denizli, Karabük BURDUR 0,5801 Bursa, Düzce,
İstanbul Avrupa
BURSA 1 39
ÇANAKKALE 0,9915 Düzce, İzmir ÇANKIRI 0,3377 Busa, İzmir, Karabük
ÇORUM 0,7576 Bursa, Düzce, İzmir
DENİZLİ 1 9
DİYARBAKIR 0,4565 Düzce, İzmir
DÜZCE 1 56
EDİRNE 0,8489
Bilecik,Bursa, Denizli, İstanbul
Avrupa ELAZIĞ 0,6321 Düzce, İzmir ERZİNCAN 0,3267 Bursa, Düzce, İzmir ERZURUM 0,3618 Bursa, Düzce,
İstanbul Avrupa ESKİŞEHİR 0,7593 Bursa, Düzce, İzmir GAZİANTEP 0,5399 Bursa, Düzce,
İstanbul Avrupa GİRESUN 0,7818 Düzce, İstanbul
Avrupa GÜMÜŞHANE 0,4172 Düzce, İzmir
HAKKARİ 0,213 Düzce, İzmir
HATAY 0,9754 Bursa, Düzce, İzmir IĞDIR 0,4503 Düzce, İzmir ISPARTA 0,4944 Düzce, İzmir İÇEL 0,9368 Bilecik, Denizli,
İzmir, Karabük İSTANBUL AVRUPA 1 28 İSTANBUL ANADOLU 1 0 İZMİR 1 40
K.MARAŞ 0,772 Bursa, Denizli, Kütahya
KARABÜK 1 11
KARAMAN 0,8951 Düzce, İzmir KARS 0,4719 Bursa, Düzce, İzmir
KASTAMONU 0,7194 Düzce, İstanbul Avrupa KAYSERİ 0,9842 Bursa, Karabük,
Kütahya KIRIKKALE 0,5174 Düzce, İzmir KIRKLARELİ 0,954 Bursa, Düzce, İstanbul Avrupa KIRŞEHİR 0,6013 Bursa, Düzce, İzmir
KİLİS 0,6109 Düzce, İzmir
KOCAELİ 1 1
KONYA 0,6654 Düzce, İstanbul Avrupa
KÜTAHYA 1 2
MALATYA 0,6422 Bursa, Düzce, İstanbul Avrupa MANİSA 0,9481 Bursa, Düzce,
İstanbul Avrupa MARDİN 0,6581 Düzce, İzmir
M U Ğ L A 0,8182 Bursa, Düzce, İstanbul Avrupa MUŞ 0,3875 İzmir, Kocaeli NEVŞEHİR 0,7438 Bursa, İstanbul Avrupa, Tekirdağ NİĞDE 0,8821 Bursa, İzmir, Karabük
ORDU 0,8044 Bursa, Düzce, İstanbul Avrupa OSMANİYE 0,9317 Denizli, Karabük
RİZE 0,6118 Bursa, Düzce, İstanbul Avrupa SAKARYA 0,6039 Düzce, İstanbul
Avrupa
SAMSUN 0,825 Düzce, İzmir
SİİRT 0,3654 Bursa, Denizli, İzmir, Karabük SİNOP 0,4443 Düzce, İzmir SİVAS 0,6622 Düzce, İzmir ŞANLIURFA 0,4801 Bursa, Düzce, İstanbul Avrupa ŞIRNAK 0,3839 Düzce, İstanbul
Avrupa
TOKAT 0,5878 Bursa, Düzce, İzmir TRABZON 0,4834 Düzce, İzmir
TUNCELİ 0,2519 Düzce, İzmir UŞAK 0,7312 Bursa, Düzce, İstanbul Avrupa
VAN 0,2882 Bursa, Düzce,
VAN 0,2882
İstanbul Avrupa YALOVA 0,7962 İzmir, Karabük
YOZGAT 0,565 Bursa, Düzce,
YOZGAT 0,565
İstanbul Avrupa
ZONGULDAK 0,7742 Düzce
DEA model, with its basic form, does not restrict the input/output weights and result of this flexibility, some DMUs could take place on efficiency frontier by their higher performance on only one input or output. In spite of the restrictions on weights used, to determine DMUs that are on the efficiency frontier on the result of the performance on inputs and outputs but in reality which are not efficient, cross efficiency values should be used [8].
Cross efficiency analysis makes possible to sort the DMUs among themselves which are on the frontier according to CCR formulation. In the cross efficiency model, efficiency values of each DMU is minimized by using the weights that maximizes performance of all of the other DMUs sequentially.The cross efficiency values of DMUs which take place on the frontier by only one input or output, would be resulted relatively small [10]. After the relative efficiency values of DMUs are calculated by CCR model, it is possible to sort these efficient DMUs by the implementation of the formulation as follows; r=1 M i n Eks = ^vryr. Subject to: m
Z
wxs =1 i=1Ek s
<
1 for all DMUs ( 5 ^ k )Z ^ J k - Ekk
Z
w'x' k =0r=1 i=1
wi > 0 i=1,...,m
In the model above,
E*
kk is the optimal efficiency value for the kthDMU obtained from the CCR model. And so Eks value shows the efficiency
of sth DMU according to the kth target value. By using these values the cross
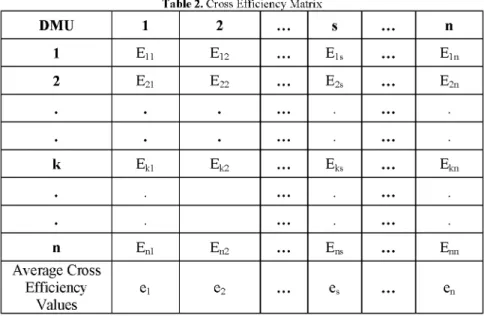
efficiency matrix shown below is obtained. Average cross efficiency values in the lower row of the matrix show the average efficiency of each sth DMU when
other units are considered.
Table 2. Cross Efficiency Matrix
DMU 1 2 s n
1 E11 E12 E1s E1n
2 E21 E22 E2s E2n
. . k Ek 1 Ek 2 Ek s Ek n n En1 En2 E E nn Average Cross Efficiency Values e1 e2 es en
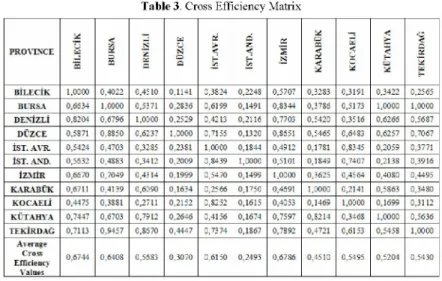
The results obtained from cross efficiency model for efficient Province Telecom Directorships got by the CCR method are shown on Table 3. According to this, by cross efficiency method, the acquisition of the efficiencies of İzmir, Bilecik, Bursa, İstanbul Avrupa, Denizli, Kocaeli, Tekirdağ, Kütahya, Karabük, Düzce, and İstanbul Anadolu which are found as efficient at the result of CCR method, are decreasing sequentially, could be obtained.
4. CONCLUSION
While productivity concept that forms the basis of Business Administration, have a big importance, absence of valid and sufficient standardized measurement techniques complicates the measurement of performance. It is more difficult to make this measurement in the service sector like telecommunications where the measurement of customer satisfaction and service quality is difficult. Today, used sources which are
different from each other and also a lot of products obtained from these, decreases the difficulties while evaluation of the productivity
Table 3. Cross Efficiency Matrix
- < X s: > P R O Y E Î C E S < < S % < . = ^ ş < 5 y t i •A B İ L E C İ K 1,0000 0,4022 0,4:10 0,1141 0,3824 0,2248 0,5707 0,3283 0,3191 0,3422 0,2565 BURSA 0,0634 1,0000 0,5371 0,2836 0,6199 0,1491 0,3344 0,3786 0,5173 1,0000 1,0000 D E N İ Z L İ 0.3204 0,6796 1,0000 0.2529 0,42 13 0,2116 0,7703 0,5420 0,3516 0,6266 0,5687 D Ü Z C E 0.5871 0,8850 0,6237 1.0000 0,7155 0,1320 0,8651 0,5465 0,6483 0,6257 0,7067 İST. A V R 0.5424 0.4703 0,3235 0,2381 1,0000 0,1844 0,4912 0,1781 0,8345 0,2059 0,3771 İST. AND. 0,563: 0,4SS3 0.3412 0,2009 0,8439 1,0000 0,5101 0,1849 0,7407 0,2138 0,3916 İ Z M İ R 0,6670 0,7049 0,43 14 0,1999 0,5470 0,1499 1,0000 0,3625 0,4564 0,4080 0,4495 K A R A B Ü K 0,6711 0,4139 0,6090 0,1634 0,3566 0,1750 0,4691 1,0000 0,2141 0,5863 0,3480 K O C A Z I İ 0,4475 0,3881 0,2711 0,2152 0,8252 0,1615 0,4053 0,1469 1,0000 0,1699 0,3112 K Ü I A H Y A 0,7447 0,0703 0,7912 0,2646 0,4156 0,1674 0,7597 0,8214 0,3468 1,0000 0,5636 T E K İ R D A Ğ 0,7113 0,9457 0,8670 0,4447 0,7374 0,1867 0,7892 0,4721 0,6153 0,5458 1,0000 Average Cross 0.6744 0.6408 0,5683 0.3070 0,6150 0.2493 0,6786 0,45 10 0,5495 0,5204 0,5430 Valnes
Methods which are used for productivity analysis are sorted as ratio analysis, parametric methods and non-parametric methods. Since ratio analysis consists of one dimensional analysis of inputs and outputs, it is very difficult to gather them in one dimension by weightening. While parametric methods assume that production functions have an analytical structure, on the contrary non-parametric methods have a very flexible structure in this manner. DEA is also a non-parametric method developed with the purpose of measurement of the relative efficiencies of economical DMUs similar each other according to the products and services they produced.
In this work, by using DEA method, efficiency analysis of Türk Telekomünikasyon AŞ. Province Telecom Directorships which have an important role on social and economical development of our country, is made. In the first stage of the work, by using CCR model, based on constant profit according to scale approach, The Province Telecom Directorships that used their sources efficiently to get a certain amount of output combinations and to make efficient The Province Telecom Directorships which are not efficient, The Province Telecom Directorships that should be referred are determined. In the second stage, between the efficient Province Telecom Directorships got at the result of CCR method, ordering of efficiencies by cross efficiency method is obtained.
These results have an important factor on the supplying of service quality and customer satisfaction in all over the country and using of sources in
an appropriate manner. Province Telecom Directorships which are not efficient should reach efficiency frontier, by supplying employment of their excessive employees at other areas, by making revision on their repair and maintenance policies and lessening the number disorders, by reducing their expenses and besides, by inspring the use of stable telephone lines and by widening the usage of ADSL lines.
ACKNOWLEDGEMENT
We thanks to the authority of Telekom A.§. particularly for providing data and permission of this study.
REFERENCES
1. Available protocol: http://turk.internet.com/category.php?cat=62 2. Available protocol: http://www.tasam.org
3. Boussofıane, A., Dyson, R., Rhodes, E.; Applied Data Envolopment Analysis, European Journal of Operational Research, Vol.2, No.6, 1-15, (1991).
4. Çakal R.; Doğal Tekellerde Özelleştirme ve Regülasyon, DPT Uzmanlık Tezleri, Yayın No: 2455, (1996).
5. Easton L., Murphy D. J., Pearson J.N.; Purchasing Performance Evaluation: With Data Envelopment Analysis, European Journal of Purchasing & Supply Management, Volume 8, 123-134, (2005).
6. Gattoufi S., Oral M., Reisman A.; A Taxonomy for Data Envelopment Analysis, Socio-Economic Planning Sciences, Volume 38, 141-158, (2000).
7. Giokas D. I., Pentzaropoulos G. C.; Evaluating Productive Efficiency in Telecommunications: Evidence from Greece, Telecommunications Policy, Volume 24, 781-794, (2000).
8. Karsak, E., İşcan, F.; Çimento Sektöründe Göreli Faaliyet Performanslarının Ağırlıklı Kısıtlamaları ve Çapraz Etkinlik Kullanılarak Veri Zarflama Analizi ile Değerlendirilmesi, Endüstri Mühendisliği Dergisi, Cilt:11, Sayı:3, 2-10, (2000).
9. Lee S., Lee K., Kang I. W.; Efficiency Analysis of Controls in EDI Applications", Information & Management,42(3):425 (2005).
10. Özyiğit T.; Gelişmekte Olan Ülkelerin Göreli Sosyo-Ekonomik Performanslarının Değerlendirilmesi, Galatasaray Üniversitesi Fen Bilimleri Enstitüsü Yüksek Lisans Tezi, (2000).
11. Resende M., Façanha L.O.; Price Cap Regulation, Incentives and Quality: The Case of Brazilian Telecommunications, International Journal of Production Economics, Volume 92, 133-144, (2004).
12. Resende M., Façanha L.O.; Price-Cap Regulation and Service-Quality in Telecommunications: An Empirical Study, Information Economics and Policy, Volume 17 1-12, (2005).
13. Sirel E.; Düzenlenmiş Elektronik İletişim Sektöründe AB'de ve Türkiye'de Eğilimler, KKTC ile Türkiye Cumhuriyeti Telekomünikasyon Sektörlerindeki Gelişmeler ve Yerel Uygulamalar Sempozyumu, TK&DAÜ, Kıbrıs, (2005).
14. Türk Telekomünikasyon A.Ş.; Activity Report, (2004).
15. Yolalan, R.; İşletmeler Arası Göreli Etkinlik Ölçümü, Milli Prodüktivite Merkezi Yayınlan, No: 483, Ankara, 4-95, (1993).
16. Yun Y.B., Nakayama H., Tanino T.; A Generalized Model for Data Envelopment Analysis, European Journal of Operational Research, Volume 157, 87-105, (2004).