KADİR HAS UNIVERSITY
GRADUATE SCHOOL OF SOCIAL SCIENCES
INTERNATIONAL TRADE AND FINANCE DISCIPLINE AREA
THE EFFECT OF FINANCIAL DEVELOPMENT ON
NATIONAL WELFARE: COMPARISON OF TWO
EMERGING AND TWO UPPER MIDDLE INCOME
ECONOMIES
KOUTIBAH ISMAIL ALRIFAI
SUPERVISOR: ASST. PROF. DR. ARHAN S, ERTAN
MASTER’S THESIS İSTANBUL, JUNE, 2018
KOUT IB AH IS M AI L A L R IF AI M A S TER ’S TH ES IS 2018
ii
THE EFFECT OF FINANCIAL DEVELOPMENT ON
NATIONAL WELFARE: COMPARISON OF TWO
EMERGING AND TWO UPPER MIDDLE INCOME
ECONOMIES
KOUTIBAH
ISMAILALRIFAI
SUPERVISOR: ASST. PROF. DR. ARHAN S, ERTAN
MASTER’S THESIS
Submitted to the Graduate School of Social Sciences of Kadir Has University in partial fulfillment of the requirements for the degree of Master’s in the Discipline Area of International trade and finance under the Program of finance and banking
1
ABSTRACT
ALRIFAI, KOUTIBAH. THE EFFECT OF FINANCIAL DEVELOPMENT ON NATIONAL WELFARE: COMPARISON OF TWO EMERGING AND TWO UPER MIDDLE INCOME ECONOMIES: BETWEEN 2000-201. MASTER’S THESIS, Istanbul, 2018.
This study investigates the effect of financial development on the national incomes of two emerging economies (Brazil and, Turkey) and compared them with two other countries namely Hungary and, Poland which are upper middle-income countries, over the period 2000-2015.
This study tries to figure out the relationship between financial development and national income. The study constructs a Panel dataset for the four countries. And the results of Ordinary Least Squares (OLS) with Fixed Effects (FE) regressions showed that financial development has a positive effect on national income in the four countries. But the highest impact was in Turkey, then Poland, Hungary, and Brazil respectively. The findings of this paper will be useful for both professional and academic research sectors of financial institutions and who wish to consider the important role of financial development in promoting growth in economies.
Keywords: Financial development, National income, Panel data.
2
ÖZET
ALRIFAI, KOUTIBAH. FİNANSAL GELİŞİMİN MİLLİ REFAH ÜZERİNE ETKİSİ: İKİ ACİL VE İKİ YÜKSEK ORTA GELİR EKONOMİLERİNİN KARŞILAŞTIRILMASI: 2000-2015. YÜKSEK LİSANS TEZİ, Istnabul 2018.
Bu çalışma, finansal kalkınmanın gelişmekte olan iki ekonominin (Brezilya ve Türkiye) ulusal gelirleri üzerindeki etkisini incelemekte ve bunları 2000-2015 döneminde üst orta gelirli ülkeler olan Macaristan ve Polonya ile karşılaştırmaktadır. Bu çalışma finansal gelişme ile milli gelir arasındaki ilişkiyi ortaya çıkarmaya çalışmaktadır. Çalışma dört ülke için bir Panel veri kümesi oluşturuyor. En Küçük Kareler (OLS) ile Sabit Etkiler (FE) regresyonları sonuçları, finansal gelişmenin dört ülkede milli gelir üzerinde olumlu bir etkiye sahip olduğunu göstermiştir. Ancak en büyük etki sırasıyla Türkiye'de, sonra Polonya, Macaristan ve Brezilya idi.
Bu makalenin bulguları, finansal kurumların hem profesyonel hem de akademik araştırma sektörleri için yararlı olacak ve ekonomilerde büyümenin desteklenmesinde finansal gelişimin önemli rolünü dikkate almak isteyecektir.
Anahtar Kelimeler: Finansal gelişme, Milli gelir, Panel verileri.
3
ACKNOWLEDGMENTS
I would like to express my gratitude to all those who helped me achieve this valuable work which is one of the greatest deeds in my life.
First, I would like to thank my supervisor Dr. Arhan Ertan for his remarkable advice and continuous encouragement throughout the thesis period. I thank him for the guidance and support he gave me in the field of academic research.
Secondly, I am grateful to my academic advisor Dr. Ömer Lütfi GEBİZLİOĞLU, and all my teachers for their unlimited support and guidance.
Finally, I extend my profound gratitude to all my family members, classmates and friends for their love which kept me energetic and active throughout the time.
4 To my parents, family members, teachers and friends from around the world
One day …….. I will make you proud of me. I promise
5
CHAPTER 1
INTRODUCTION
Organization of the Study
This study is composed of five chapters. In chapter one a theoretical background and rationale of study are presented. The contribution of the study, research questions, methodology and terms of the study are defined. In chapter two the relevant literature is reviewed in the areas of financial development, growth of economy and the effect of financial development upon growth of economy in many regions. In chapter three the data and methodology are presented. In chapter four the results of the study are examined and discussed. In chapter five conclusions and recommendations for future research are provided.
Theoretical Background
The growth in national income and economy is an important issue in modern economies. Also it received a great deal of attention in previous decades. One of the variables which impact the national income is financial development. Consequently the financial development, growth in national income, and the connection between them have become one of the most important emerging research topics in the field of economy and finance. According to the viewpoint of Schumpeter, (see Schumpeter 1912,1934), who was one of the greatest economists to study growth in economy, sophisticated financial intermediaries and institutions will catalyze the growth of
6 economy by accelerating the accumulation of capital which eventually leads to economic growth. This means that the change in services leads to innovation and economic growth through guiding savings to fruitful investments. Recently, the aspect of the financial sector within the growth of economy method has garnered attention. Moreover, the new work on the growth in economic literature focuses on the positive turn of the financial system in promoting growth in the economy, especially in financial functions. According to Levine (see Levine, 2004) the development in the financial sector includes amelioration in (i) the produce of information about future investments, (ii) putting investments under surveillance (iii) management of risk, and diversification (iv) motivation and collecting of savings, and (v) reciprocity of goods and services. Every one of the above five financial functions might impact investment and subsequently growth in an economy.
Thus, financial institutions modulate resources to be allotted to innovative and productive fields by providing credits to companies. So, financial institutions have a significant role to play in economic growth and national income by authorizing technological innovations. (see Arac , Ozcan 2014). Patrick (1966) called this view “supply leading hypothesis.” Another view by Robinson (see Robinson, 1952), argues about the link between the growth in economy and financial development. As a result it can be said that the order for financial firms will increase, and the financial structure will be developed because of the growth in national income. This opinion is called “demand following hypothesis” by Patrick (1966). Hicks (1969) declared that the Revolution of Industry would not have been possible in the absence of an effective financial system (see Taivan, Nene, 2016). Share in the growth of an economy is a massive topic for debate. (see Ram Mohan, Nitsure, Joseph; 2005).
7 On the other hand, there is a debate about the great value of financial development in promoting growth in national income. In addition, some economists are of the opinion that the correlation in the midst of financial development and growth in national income is not a significant matter. According to Lucas (1988) economists should mull over financial ingredients because they will increase the growth in an economy. However most development economists demonstrate their considerable uncertainty about the function of the financial system.
Nevertheless, although a new action would cause doubt about the development of financial institutions, markets are important and; an inseparable part of national income growth, far from the view that shows the irrational side of the financial system. There is noteworthy evidence which shows that the financial development level of certain countries is a perfect indicator of future rates to measure growth in national income. (see Levine, 1997)
From the above we can see that the link between financial development and growth of national income is a conversational issue, but still there is no unanimity about and causative trend between them. And the trend of whether growth in national income is causing financial development or vice versa is still unresolved. However, the connection among financial development and growth in national income is an important matter for economic decision makers in developing countries. For many countries, the importance of financial development was made clear as they experienced a recession in the period after the global financial crisis of 2008.
Hence, a robust and well-developed financial structure is the crux of any economy in the world. Efficacious financial firms and institutions cause higher growth in national
8 income while inefficacious financial institutions and firms are usually the reason for economic crises.
Finally, based on the above and due to the value of the financial sector in an economy for promoting the growth in national income and the importance of this subject for both economic and finance fields, the contribution of the study is significant and will be explained in the next paragraphs.
Contribution of the Study
This study examines the effect of financial development on national welfare and in making a comparison between two emerging economies (Brazil, Turkey) and two upper middle income counties (Hungary , Poland) over the period 2000-2015 is foreseen to add to the literature in financial development and growth in economy the upcoming points:
(1) The main point which differentiates this study from preceding studies is the use of new alternative indicators and indexes to measure financial development.
(2) Examining the hypothesis that financial development might lead straight to the growth in national income specifically in the four countries, and supplementary exploration will contribute to the literature and the orientation of the link between financial development and national income growth.
(3) To acquire dependable findings about the influence of financial development on the national income growth in the four countries, a trustworthy dataset belonging to the period of 2000-2015 has been applied in the study.
(4) A comparison has been made between two emerging economies (Brazil and Turkey) with two upper middle income countries (Hungary, and Poland).
9 The main research questions of this study are :
1) Does financial development have an impact on national income growth in Turkey?
2) Is there any difference between Turkey and the countries compared Brazil, Hungary and Poland in terms of the impact of financial development on national income growth?
10
LITERATURE REVIEW
The relationship between financial development and growth in national income has been studied in details. Almost all the outcomes indicated that a positive relationship between financial development and national income growth does exist, as described below
Ciftcia, Ispirb and Yetkiner (2017) illustrated the role of financial development in promoting national income growth. This study developed a suitable model for empirical applications by using the Trade-off Theory. At the next point, the model which was based on empirical approach, by a panel database of 40 countries during the period 1989–2011 was estimated by using Augmented Mean Group (AMG) and Common Correlated Effects (CCE) estimation methods. The results showed that both stock market development and credit market development have positive effects on the level of gross domestic product per capita. Moreover, Kazar, A., Kazar, G (2016) looked into the connection between financial development and growth in national income, with globalization for the countries classified according to income levels over the period 1980-2010, After considering the panel characteristics of the dataset, the data were analyzed by dynamic Ordinary Least Squares (OLS) method. The results revealed that financial development has a positive and good impact on the growth of gross domestic product per capita in developed countries. Also, Nicolae, Codruta, Violeta and Adriana
CHAPTER 2
11 (2016) stated that depending on the financial indicator was considered in developing countries (the evolving part of each territory constructed by the World Bank) used in analysis were: Europe and Central Asia, East Asia and the Pacific, South Asia, Latin America and the Caribbean, Sub-Saharan Africa, the Arab World, and Middle East & North Africa for over the period (1988–201), and they employed statistical analysis (time-series) based on the Granger causality Method. The outcomes revealed that there is a strong correlation and relationship between the financial market gross domestic product per capita in the African countries (developing countries). Furthermore, Valickova, Havranek, and Horvath (2015) made a Meta-regression test of studies that examine the impact of financial development on growth in economy. The Meta-regression examination presented evidence that the revealed estimates of financial development and growth in economy connection rely upon the set of control variables included in the growth regressions. The sturdy recommended that the analysis should apply the control for the level of human capital and financial setbacks, primary income in order to show and approve the effect of financial development on growth of gross domestic product per capita, and that advises the instability of the regression model and excluded variable bias are the main features driving the estimated effect of the financial development on the growth in economy. Moreover, Nyasha and Odhiambo (2014) examined the empirical and theoretical literature review on the relationship between financial development and growth in economies in both developing and developed countries. The results demonstrate that the causal relation among financial development and growth in economy is not visible and the fact that financial development robotically drives economic growth is just based on fictional evidence. Furthermore, Masoud and Hardaker (2012) investigated stock market development and economic growth
12 empirical relationship in 42 countries over the period (1995-2006). This study is built on an internal study of the economic growth model. The findings showed that there is a strong relationship between most indexes of a stock market and the growth in gross domestic product per capita. On the other hand Choong and Chan (2010) believed that the connection between financial sector development and growth in gross domestic product per capita is significant in all countries because the evolution of the financial system is impacting the growth in gross domestic product per capita through the efficient allocation of resources which results in growth of economy. The impacts of development of the financial sector’s efficiency on the growth in economy were demonstrated by Waheed and Younus in (2010). The method which they used is the logical method from both developed and developing countries which was based on the Extreme Bond Analysis (EBA) method. The findings showed that the effect of the financial sector competence on growth in gross domestic product per capita is uncommonly positive for all of 98 developed and developing countries. For a specimen of 64 developing countries, the effects of the development of a financial sector competence is also positive and very substantial, whereas in a sample of 26 developed countries, the financial sector’s development is sufficiently positive, and the influence of the financial sector’s efficiency is also positive. Moreover, in the upcoming titles I will focus on the studies on the specific regions.
Turkey
In Turkey, a lot of research and studies have been implemented to explore the relationship between the development of finance and growth in gross domestic product per capita. Zeki, Kirca, and Altintaş (2016) investigated the connection among the
13 development of finance and growth of economy in Turkey over the period 1960-2013. The study applied the Granger Causality Method, and the results showed that the causality connection among financial development and growth of gross domestic product per capita in Turkey does not exist over the stated period. The causal relation between financial development and growth of economy in Turkey over the 1987-2012 period was examined by Arca and Ozcan (2014). Bound testing and Ganger Causality tests were used and the results showed that there is a long-run relationship between the development of finance and growth of economy. Moreover, Kar, Nazlioğlu, and Ağir (2014) studied the case that trade liberalization causes economic growth in Turkey between (1987:q1- 2007:q1), by employing non-linear analysis. The results showed that economic growth causes financial development, and financial development leads to trade liberalization. These outcomes furnish logical hypotheses which support both the demand-following and export-led growth hypotheses. Furthermore, Mercan and Göçer (2013) investigated the influence of financial development on growth of gross domestic product per capita in five developing countries, which have a crucial status in the world’s economy (Russia, China Brazil, India and Turkey, BRIC/T), panel data analysis being used foe those countries. The conclusions obtained that the growth in gross domestic product per capita of the country will increase if financial firms offer the credit demands of the real sector, which means that economic growth has a financial development impact. The long-term connection between financial development and growth in gross domestic product per capita in Turkey over the period 1991-2005 was examined by Soytas and Kucukkaya (2011). The basic upfront conclusions confirm the nonexistence of causality. Even when financial or monetary policies and inflation are considered, they could not find a link between financial development and growth of
14 economy in Turkey. The impact of financial development on economic growth since the inception of the economists of the 1900s was examined by Demirhan, Aydemir, and Inkaya (2011). The relationship between financial development and growth in gross domestic product per capita in Turkey during the period 1987-2006 was examined by the researchers. There have been many logical and theoretical studies to illustrate the orientation of causality among them. Nonetheless, the orientation of causality stays unresolved in both theory and practice since the relationship between financial development and growth economy is specified country wise. The results of many empirical types of research show that countries with sophisticated financial systems tend to grow quicker. Moreover, İnce (2011) studied if financial development leads to growth in gross domestic product in Turkey over the period of 1980-2010. Co-integration and Granger Causality Tests were used to look into the causal connection between financial development and growth of economy. The outcomes maintained that the relation among financial development and growth in gross domestic product is a strong and stable relationship in the short- term.
European Union
In the European Union, many studies have been carried out about connection between financial development and growth of national economy. Lebe (2016) researched the connection between the financial development and growth of economy in 16 European countries during the 1988-2012 period by using the bootstrap panel causality test. The outcomes showed that there was a robust link between financial development and growth of gross domestic product in the sample 16 European countries. Furthermore, Tsaurai (2015) examined the connection between the financial development and growth
15 of the economy in Hungary between the years 1991 and 2012 and the case study approach was used. The findings illustrated that the relation between the financial development and growth of economy in Hungary over the given period was not obvious. Furthermore, DUDIAN and POPA (2013) examined the relation between financial development and growth of economy during the period 1996-2011 in Central and Eastern Europe and a panel data model was used. The results showed that an increase in interest rate and nonperforming debts have an effect the economic growth, in other words, there will not be good effect on gross domestic product (GDP) growth if there is a rise in domestic credit to private sector. However a rise in growth rate positively impacts gross domestic product and extensive money growth does not have that influence on the growth of an economy. Also, Gurgul and Lach (2012) studied the connection between economic growth and financial development in Poland by a using quarterly database for the period (2000 q1–2011 q4), the methodology was Granger Causality and the outcomes showed that causality working from economic growth to the banking scheme may be evidence that a more developed economy has a more financially developed scheme. At the same time, they could not find any evidence of causality running in the opposite direction. The connection between the financial development and growth of economy in France by using annual data for the period 1965-2007 was investigated by Athanasios and Antonios (2010) .They used Ganger Causality tests analysis. The results were in line with Levine and Zervos's study (1998) which came to the conclusion that financial development has an affirmative influence on growth in national income.
16 Africa
According to researchers in the Africa region, only a few studies have been carried out about the connection between the financial development and growth in national income. Assaf and Mollick (2017) explained financial development and growth of economy in Africa by examining 15 African countries between the years from 1995 to 2010. They employed both static and dynamic panel data methods and outcomes. They observed that the financial development index (FDI) has a positive effect on real gross domestic product (GDP) growth. The relation between the financial development and growth of gross domestic product in Ghana over the period 1988–2010 was observed by Adu, Marbuah, and Mensah (2013). The study was based on the Autoregressive Distributed Lag (ARDL) bounds test. The result revealed that financial development has a considerable statistically positive effect on the growth of an economy. Moreover, Abida, Sghaier, and Zghidi (2015) examined the link between financial development and growth in gross domestic product in North African countries, namely Egypt, Morocco, and Tunisia from the year 1980 to 2012, the Generalized Method of Moments (GMM) dynamic and panel estimation method were used. The outcome demonstrates that a strong and robust relationship does exist between financial development and growth in gross domestic product.
Asia
In the Asia region, many studies have been conducted into the connection between financial development and growth of economy. Lenka, Sharma (2017) looked into the connection between the financial inclusion and growth of economy in India over the 1980-2014 period. They used the financial inclusion variable based on Principal
17 Component Analysis (PCA) procedures with a group of variables. The study was limited to scheduled commercial banks related variables to capture financial inclusion due to data availability in India, and they plan to include MFIs, SHGs, and POSB in future research for a better understanding of the financial inclusion process and its influence on economic growth in India. The results showed that in India financial inclusion, in the long run as well as in the short run has a positive effect on the economic growth. Moreover, to examining the connection between financial development and economic growth in India, Lenka (2015) said that growth in the long term has an effect on financial development and growth in the economy in the years from 1980 to 2011; the Augmented Dickey-Fuller (ADF) and Phillips-Perron (PP) methods were used to examine and verify the stationary (Fixed Effect) among the variables. The researcher found co-integration connection between the financial sector development and growth of economy. On the other hand, Xiang and Dongye (2016) illustrated the empirical research results of the relation between the financial development and growth of economy. They conducted a logical analysis of Shenzhen over the period (2000-2012) by considering panel data. It was recommended that the Chinese government should accelerate the reform of the financial system in order to effectively solve their financing difficulty in the development of the real economy. Moreover, Kaushal and Pathak (2015) revealed the results of the Granger test which examined the influence of trade openness and financial development in India over the period 1991-2013. The results show that openness to trade does not have an impact on the growth of an economy, but growth has an influence on financial development and trade. Furthermore, Azam, Haseeb, Samsi and Raji (2016) investigated countries from Asia (Bangladesh, India, China and Singapore) for the impact of the stock market on the
18 growth of the economy in the years from 1991 to 2012. Lag bound testing approaches and analytical techniques were used. The outcomes showed that there is long-run integration between growth of economy, inflation, foreign direct investment (FDI) and stock market development. Also, the relationship between financial development and growth of economy in five emerging South Asian countries - Bangladesh, India, Nepal, Pakistan and Sri Lanka was investigated by Rana, Barua (2015) over the period from 1974 to 2012. The panel regression model and time fixed effect have been used, Cross-sectional dependence, Heteroskedasticity, serial correlation and integration have been tested for suitability. The conclusion shows that the impact on promoting growth of economy in the emerging South Asian countries is not yet established from financial sector credit to private sector credit.
Latin America
In Latin America, only a few studies have investigated the connection between financial development and growth of economy. Rosalia (2013) inspected the relation between financial development and growth of economy in Latin America; 18 countries were studied includinga group of Latin American countries during the period 1980 to 2011. The researcher chose to analyze the relationship by using a fixed effects model with instrumental variables by estimating the growth equations with fixed effects.
The conclusions reveal that there is no link between financial development and growth of economy. Moreover, Bittencourt (2012) examined the part played by financial development in creating growth of economy in four Latin American countries between the years from 1980 to 2007. The researcher used panel-time series data analysis, the
19 result indicating that financial development indeed has an important part in procreating economic growth. On the other hand, Stefani (2007) investigated the causal relation between financial development and growth of economy in Brazil during the year from 1986 to 2006 by employing the Vector Autoregressive (VAR) model. The results concluded that there is a proven relation between financial development and growth of economy.
20
DATA AND METHODOLGY
Sample
To analyze the relationship between the financial development and growth in national income in the four countries, annual time series data spanning a period of 16 years (2000-2015) is used. Also, to compare Turkey and Brazil (emerging economies) with upper middle income countries, namely, Hungary and Poland, data have been collected and a Panel data analysis is used for this purpose.
In conduct this study and to analyze a panel dataset, STATA software was used, estimation and regressions were shown in the results section.
Variables
3.2.1 National income: is defined as the total net profit through the production of services and goods in a state or country over a period time and, is used to measure the growth of the economy in a country.
CHAPTER 3
21 3.2.2 Financial development: is defined as the procedure which shows financial services. This development is measured by the various services which the financial system provides, whether through institutions or financial markets.
Also, it is defined as the development in the size, efficient and stability of the financial system. Moreover, financial development indicates to the evolution in producing information about possible investments. In other words financial development can be the development of the financial system by increasing the efficiency of financial system functions.
The growth in national income is the dependent variable measured according to real GDP per capita, indicated by loggdppc. Trade openness and financial openness, inflation rate, real board exchange rate, human capital, terms of trade, VIX index and quality of institutions are used as the control variables.
Control variables Independence variable Financial development Dependent variable National Income Figure 3.1 Model 17
22 The measurement of the financial development is a hard issue for many reasons. So many financial firms, either institutions or intermediaries, are providing financial services. Alongside them, there are banks and the stock exchange market which also have an important essential function. So to get a clear view, I have to mention different and alternative indicators of financial development. Therefore, I have used the Global Financial Development Dataset (GFDD) which includes indicators and measures of access, depth, efficiency and stability, each of these aspects captures both, (1) financial markets (bond markets and stock markets) , and (2) financial institutions (financial firms, insurance companies, banks). It also contains other significant indicators, such as measures of competition and concentration in the financial sector. The dataset builds on, extends previous efforts, and updates in particular the data collected for the Dataset on the Structure and Financial Development of the financial system. Also, the National Bureau of Economic Research which has dataset for the annually measurements of financial development over all constructed by Svirydzenka (see IMF working paper 16/5, 2016) with other measures of financial structure for the four countries concerned has been used , in order to reach trustworthy results. The indicators which have been used in measuring of financial development are defined below:
Private credit: The ratio of credits issued by banks and other financial institutions to the private sector divided by gross domestic product (GDP). calculated by using the following method:{(0.5)*[Ft/P_et + Ft-1/P_et-1]}/[GDPt/P_at] where F is credit to the private sector, P_e is end-of period CPI, and P_a is average annual CPI. Raw data are from the electronic version of the IMF’s International Financial Statistics Private credit by deposit money banks and other financial institutions. (WB)
23 Domestic credit to private sector (% of GDP): Refers to financial resources provided to the private sector by financial firms, such as purchases of nonequity securities, through loans, and trade credits, which establish a claim for repayment. For some countries these claims include credit to public enterprises.( WB)
Stock exchange market capitalization to GDP (%): The overall value of listed shares in a stock exchange market, illustrated as ratio of gross domestic product, calculated using the following deflation method:{(0.5)*[Ft/P_et + Ft-1/P_et-1]}/[GDPt/P_at] where F is stock market capitalization, P_e is end-of period CPI, and P_a is average annual CPI. (WB)
Credit to Government (%): The ratio of credit by domestic money banks to government enterprises and GDP. (WB)
Bank Z-score: is a financial statistic that determines the probability of bankruptcy. Also, it captures the probability of weakness of a country's banking system. Z-score compares country's financial system (capitalization and returns) with the fluctuations of those returns. It is estimated through the standard deviation of return on assets (ROA), return in equity (ROA) by the following equation: (ROA+(equity/assets))/sd(ROA); sd(ROA). (WB)
Lerner Index: is a measure of market power in the banking market and correlates output pricing and marginal costs, which the Prices are calculated as overall bank revenue over assets, while marginal costs are illustrated from an estimated cost function with respect to outcome. Higher ratios of the Lerner index indicate less bank competition.( Demirgüç-Kunt and Martínez Pería 2010) (WB).
24 Boone Indicator: is indicated regarding profit-efficiency in the banking market and it is used to measure the degree of competition. It is estimated as the elasticity of profits to marginal costs. To obtain the elasticity, the log of profits (measured by return on assets) is regressed on the log of marginal costs. Consequently, the high negative ratio of the Boone indicator will cause the higher the degree of competition.(WB)
3.2.3 Control Variables
A) Macroeconomic variables
Trade openness ((exports + imports) / GDP): openness of trade is the aggregation of imports, exports, services and goods measured as a share of gross domestic product. (WB)
Financial openness (Chinn – Ito KAOpen Index): is an indicator showing a country's openness level of capital account. Hence, the financial openness refers to country's approach for investments by foreign in corporations within its authority, each country has policies of with regulating exports of specified services and goods, and to each government's policy on what is called "capital flows." (WB)
Real Broad Effective Exchange Rate: is determined as weighted averages of exchange rates fixed by relative consumer prices, which is estimated to the country’s currency. (FRED)
Terms of Trade: is calculated as a ratio of the export unit value indicates to the import unit value indicates, weighted relative to the base year. (WB)
Inflation Rate: is a ratio of consumer price index and it reflects the yearly percentage change in the cost to the average consumer of acquiring services and goods that might be interchangeable per year. (WB)
25 Human Capital Index: is a measure of yearly average of schooling, and supposed rate of return to education. (PWT9)
VIX (global volatility): The Volatility Index (VIX Index) is a gauge of market anticipations of near-term fluctuation conveyed by S&P 500 stock index option prices Global Variables: financial crises dummy (for years 2008 and 2009), there was a global economic crisis over the period December 2007 – June 2009.
B) Quality of other institutions (WGI – World Governance Indicators)
Rule of Law: Percentile Rank estimation, applies Law which captures perceptions of the range within which agents have confidence to stand by the rules of society, specifically the quality of enforcement contract, the police, property rights and the courts, also the certainty of crime and violence. (WB)
Voice and Accountability estimation: Voice and Accountability captures awareness of the extent to which a country's citizens are able to indulge in selecting their government, as well as free media, sense of association, and freedom of expression. This will give the country's score on the combined index range from -2.5 to 2.5. (WB)
Regulatory Quality estimation: Regulatory Quality shows an image of the capacity of the government to modulate and implement sound policy rules that promote and permit private sector development. This will give the country's score on the combined index range from -2.5 to 2.5. (WB)
Political Stability and Violence/Terrorism estimation: it measures political coherence and absence of violence/terrorism measures, plus perceptions of the factors of political instability and terrorism. This will show the country's score on the combined index range from -2.5 to 2.5. (WB)
26 Government Effectiveness estimation: A measure of government efficiency captures standards of public and private services. The credibility of the government depends on the commitment to public and private services. This will illustrate the country's score on the combined index range from -2.5 to 2.5. (WB)
Control of Corruption estimation: A measure to control corruption indicates perceptions of the extent to which public power is used for personal matters. This will reflect the country's score on the combined index range from -2.5 to 2.5. (WB)
Time Trends of Selected Variables
This study investigates the link between financial development and growth in gross domestic product in two emerging economies namely, Brazil and Turkey and compares them with two upper middle income countries namely Hungary and Poland.
These four countries are somewhat comparable, according to level of income and size of geographical area (see World Bank World Development Indicators). The Turkish economy has become successful by adopting a sound financial system. After the crisis in 2001 and with IMF financial assistance (see Erinç Yeldan & Ünüvar, 2016), a new financial structure was built and made a remarkable change in the economy. Also, Brazil has a sound financial system and the performance of business services and finance has been magnificent as is the case of Hungary and Poland.
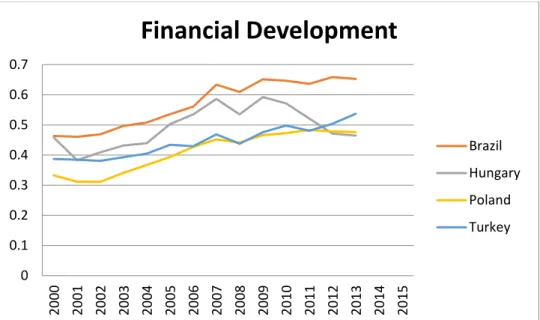
Their financial development and the differences between these countries are shown in the figure below.
27
Figure 3.2 Financial Development in Turkey, Poland, Hungary and Brazil from 2000-2015
Since the crisis in 2001, the performance of the Turkish economy has been magnificent. For instance, the inflation rate has fallen to less than 10 % during the last fifteen years, while it was more than 10 % before. Whilst in Brazil, inflation was less than 10% from 2000 till 2001 and reached in the range of 15 % in 2002-2003. After this rise, performance became normal in 2004 - 2006 (see Barbosa-Filho, 2008). As for Hungary, the inflation rate decreased from 5.3 % to 3.6 % between 2004-2006 (see States et al., 2006). In the Polish economy, the inflation rate is very low and the National Bank of Poland aims to keep the inflation rate at 2.5 %.
The following chart illustrates the inflation rate (consumer prices) for the four countries. 0 0.1 0.2 0.3 0.4 0.5 0.6 0.7 20 00 20 01 20 02 20 03 20 04 20 05 20 06 20 07 20 08 20 09 20 10 20 11 20 12 20 13 20 14 20 15
Financial Development
Brazil Hungary Poland Turkey 2328
Figure 3.3 Inflation Rate in Turkey, Poland, Hungary and Brazil from 2000-2015
In addition, their foreign trade has become more open than before, and the volume of Turkish exports to the Middle East increased from 11% in 2001 to 35 % in 2013, while the volume of Turkish exports to the EU during this period was around 60%. This is similar to Brazil, which has immense natural resources. According to Baer (see Baer, 2001, 2008) Brazil has many different resources of various types, such as iron, coal ,and copper. In 2004, more than 60 % of Brazil’s exports consisted of industrial products. On the other hand and according to the European Union dataset, the industrial sector has become the most important sector in Hungary’s economy, which means that trade has become more open than before. While in Poland the trade openness is not as strong as the other three countries mentioned above.
The chart below shows trade openness % of GDP for the four countries. -10 0 10 20 30 40 50 60 20 00 20 01 20 02 20 03 20 04 20 05 20 06 20 07 20 08 20 09 20 10 20 11 20 12 20 13 20 14 20 15
Inflation Rate
Turkey Hungray Brazil Poland 2429
Figure 3.4 Trade Openness in Turkey, Poland, Hungary and Brazil from 2000-2015
The improvement in education in Turkey can be noticed through the Human Capital index, which has grown in a positive way in the last 10 years. The same thing applies for the other three countries; the Human Capital index improves and becomes higher than it was before. The human capital of the four countries, based upon years of education and returns to schooling, is demonstrated in the figure below for the four countries. 0 20 40 60 80 100 120 140 160 180 200 20 00 20 01 20 02 20 03 20 04 20 05 20 06 20 07 20 08 20 09 20 10 20 11 20 12 20 13 20 14 20 15
Trade Openness
Turkey Hungray Brazil Poland 0 0.5 1 1.5 2 2.5 3 3.5 4 20 00 20 01 20 02 20 03 20 04 20 05 20 06 20 07 20 08 20 09 20 10 20 11 20 12 20 13 20 14 20 15Human Capital
BRZIL HUNGARY POLAND TURKEYFigure 3.5 Human Capital in Turkey, Poland, Hungary and Brazil from 2000-2015
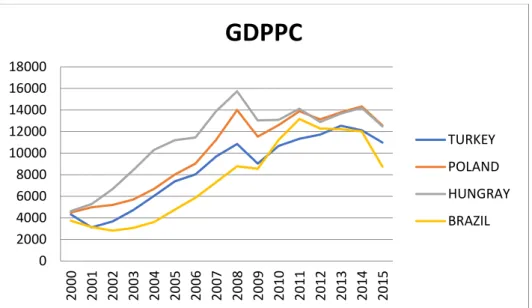
30 Finally, according to the World Bank, the Turkish economy is ranked as having the 13th largest GDP based on purchasing power parity (PPP), and the 17th for nominal GDP in the world’s top 20 economies. As for the Brazilian economy, it is the biggest economy in Latin America, and one of the fastest growing economies in the world. Moreover, Brazil is a member of the BRICS countries. However, economic stagnation in 2015 moved Brazil from 7th to 9th rank in the world’s top economies (see Parbleen, 2017). The Hungarian economy is improving, and it has become strong than before. Additionally, Hungary became a member of the European Union in 2004, and this had a massive impact on the country’s economy, Also, it is a high income economy, and it is the 57th largest economy in the world. According to World Bank statistics, the Polish economy is the largest economy in Central Europe, and it is ranked as the eighth economy in Europe. Furthermore, the growth in GDP in 2016 was expected to rise up to 2.7 .The World Bank classified the Polish economy as a high income one , with the 23rd rank in the world (see Economy, Years, & Forecasts, 2017). According to World Bank statistics, the figure below shows the Gross Domestic Product Per Capita (GDPPC) for the four counties.
31
Figure 3.6 GDP PC in Turkey, Poland, Hungary and Brazil from 2000-2015
0 2000 4000 6000 8000 10000 12000 14000 16000 18000 20 00 20 01 20 02 20 03 20 04 20 05 20 06 20 07 20 08 20 09 20 10 20 11 20 12 20 13 20 14 20 15
GDPPC
TURKEY POLAND HUNGRAY BRAZIL 2732
METHODOLOGY AND RESULTS
This part presents methodology and the estimation results of the models explaining the data analysis. In addition, correlations were calculated to examine the relationship between the variables. Also, the regression was run to analyze the research questions and to test the hypotheses.
Methodology
This research uses a standard approach to test the validity of the hypothesis of the study which investigates the effect of financial development on the growth of gross domestic product in the four countries. Moreover, this study compared two emerging economies with another two upper middle income countries namely Turkey, Brazil, Hungary and Poland; Panel data of the four countries (typically with cross-sectional and longitudinal method) is used. According to Baltagi and Hsiao (see Balatagi 2001 and Hsiao 2014) Panel data analysis is based on the error term (𝒖𝒖 𝒊𝒊𝒊𝒊) which ingredients in terms of its
time effects and individual. In doing so, and to analyze the link between financial development and growth gross domestic product, all of the four countries will be examined based on the upcoming model:
Yit = αi + βX Xit + βZ Zit+ uit (1)
Equation (1)
In equation (1) Y is the dependent variable, X is the focus on the measure of the financial development, and Z is the control variables, where α is the intercept and β is
CHAPTER 4
33 the factor of coefficients. Data consist of observations for the four countries in the specified time periods (t = 2000 to 2015), and 𝒖𝒖 𝒊𝒊𝒊𝒊 is the error term.
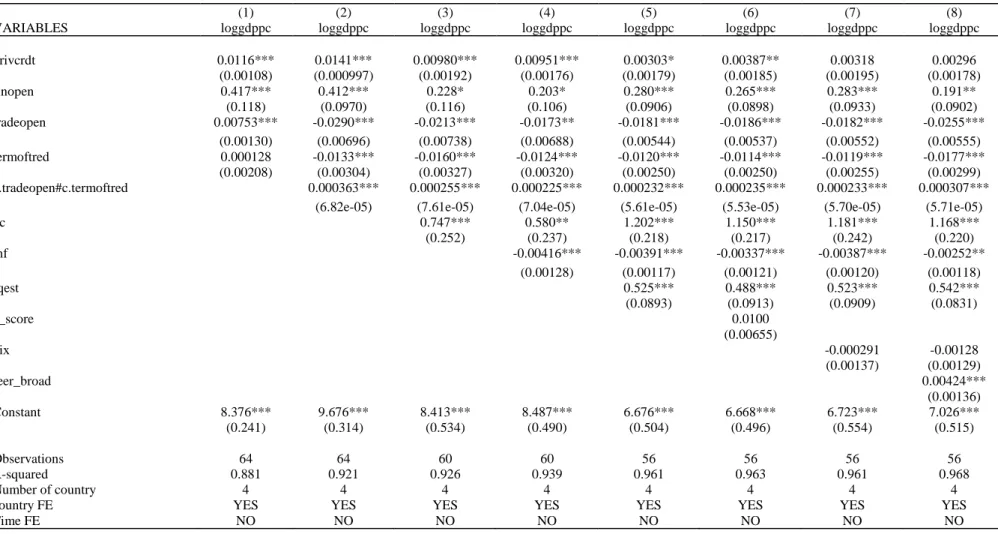
In doing so, and to analyze the Panel data, I will use Ordinary Least Squares (OLS) with Fixed Effects to analyze the Panel dataset for the four countries. Ordinary Least Squares (OLS) is used to estimate the parameters of the relationship between financial development and growth in national income from statistical observations. Furthermore, it is the technique which is going to estimate a line that will minimize the sum of the squares and the error term. (see Craven & Islam, 2011) Fixed Effects (FE) is used to analyze the impact of variables that change over time for all countries. To explore the link between financial development and growth in national income, the study assumes that something within the country may impact the independent variables. Thus the FE controls the effect of over time changeable factors, which make a clear way to get the net effect of independent variables on the dependent variable. (see Baltagi 2008). In order to determine the effect of financial development on growth in gross domestic product per capita for the four countries, estimations have been run for a Panel dataset. Firstly, the estimations go through the alternative financial development indicators then the financial development over all to get trustworthy results. Table (1) reveals the outcomes of the estimations about the effect of the Private Credit indicator on the growth in gross domestic product per capita by employing the Fixed Effects (FE) with Ordinary Least Squares (OLS) estimators described above. The analysis was carried out with two information sets; the first one contains changes in the level of income and is indicated by loggdppc and the second one obtains financial openness, openness to trade, terms to trade, the interaction between the openness to trade and, terms to trade, hc, z-score, inflation, exchange rate aboard, vitality index, and regulatory quality. The results
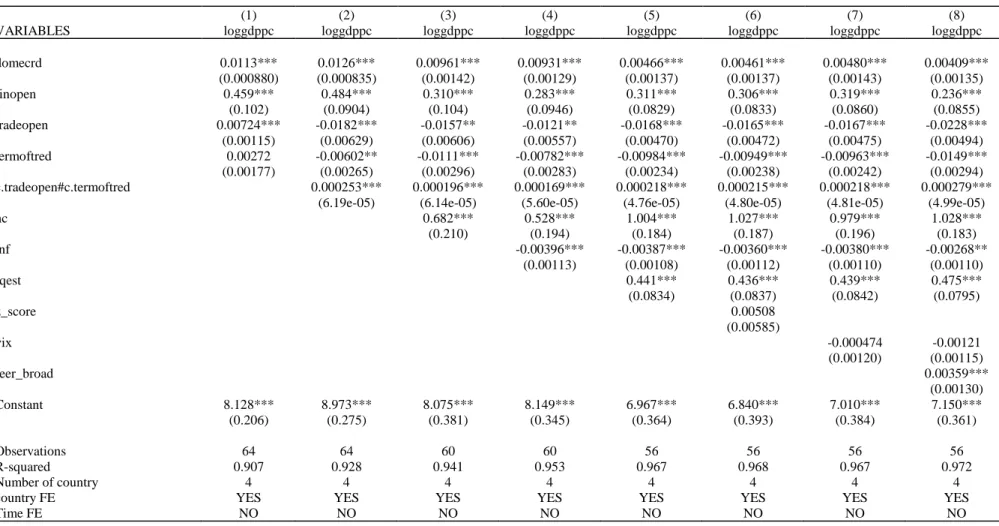
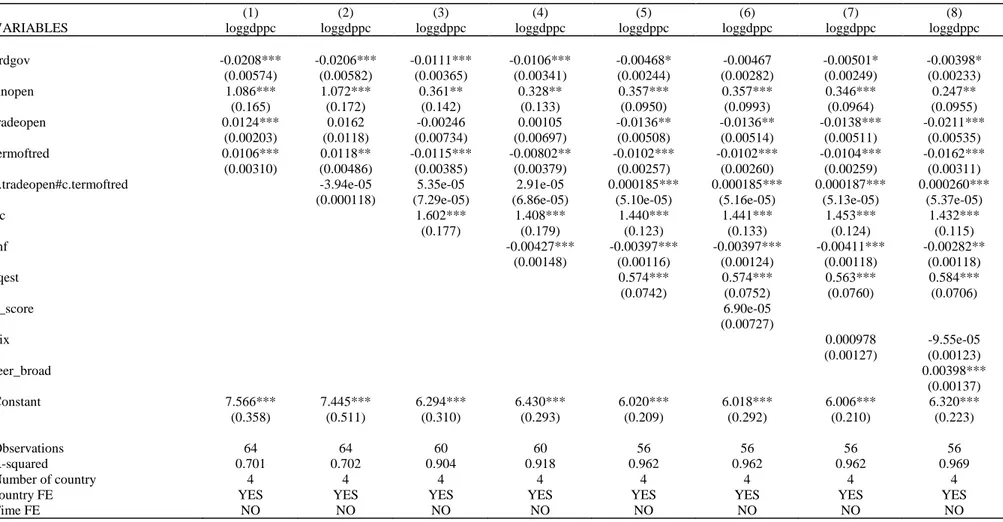
34 indicate that the Private Credit indicator has a positive and significant coefficient on growth in gross domestic product per capita over the given period for the four countries, which favors the study of Levin 2000. Table 2 shows the estimation between the Domestic Credit indicator and growth in gross domestic product per capita with the same information set, and the outcomes reveal that the Domestic Credit index has a positive significant effect on growth in gross domestic product per capita for the four countries over the given period. Table 3 presents the estimation between Stock Market Capitalization and growth in gross domestic product per capita by using the same information set and, the results show that the Stock Market Capitalization indicator has a positive significant impact on the growth in gross domestic product per capita for all samples. Table 4 shows estimation about the effect of the Credit to Government on the growth in gross domestic product per capita, and the results show that the Credit to Government has a negative significant effect upon the growth in gross domestic product per capita in the four countries, which favors the concept of Crowding out in an economy. Moreover, when the government increases its borrowing this might lead to increases in the interest rate, and consequently will affect the economy. See (Devereux, 1989) and (Carlson & Spencer, 1973).
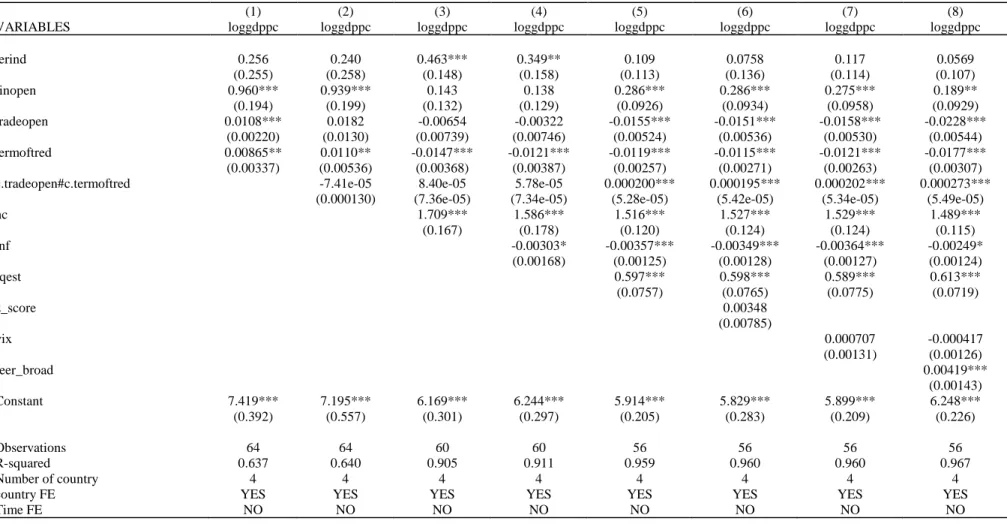
The estimation about the effect of Lerner index on the growth in gross domestic product per capita is illustrated by Table 5, and the results show that the Lerner index has a positive impact on the growth in gross domestic product per capita in the four countries. Also, Table 6 presents the estimation about the effect of Boone Indicator on the growth in gross domestic product per capita, and the outcomes show that the Boone Indicator has positive impact on the growth in gross domestic product per capita in the four countries.
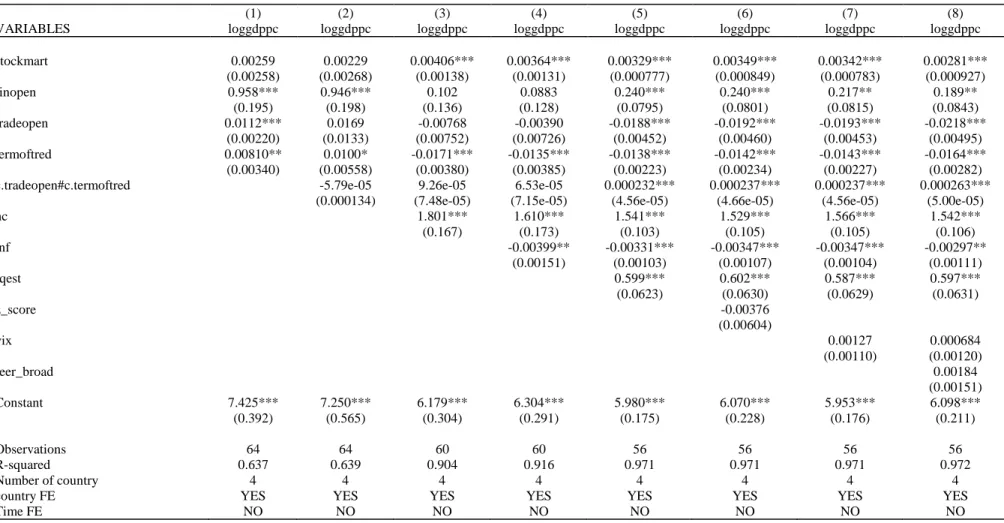
35 Table 7 describes the estimation about the effect of Financial Institutions on the growth in gross domestic product per capita, and the results indicate that the Financial Institution has a positive significant impact on growth in gross domestic product per capita in the four countries. On the other hand, the estimation about the effect of Financial Markets on the growth in economy is shown by Table 8, and the outcome reveals that the effect of Financial Markets on growth in gross domestic product per capita in the four countries is not clear.
Table 9 shows the estimation about the effect of Financial Development over all for the four countries on the growth in gross domestic product per capita, and the results reveal that Financial Development has a positive impact on growth in gross domestic product per capita in the four countries.
Difference Between the Four Countries
Concerning difference among the four countries , Table 10 shows the effect of Financial Institutions on GDP per capita, and it is significant for all countries, but this effect is strongest on Turkey first, then on Poland, then on Brazil and, finally on Hungary. Also, the difference in impact of Financial Development on GDP per capita between the four countries is illustrated by Table 11; it is significant for all countries, while the highest effect is on Turkey, then on Poland, Hungary and Brazil respectively. Also the study has run the same estimations for other indexes, private credit in Table 12, domestic credit in Table 13, and stock market capitalization in Table 14, and the results show that the indicators have the largest impact in Turkey first, then Poland, then Hungary and finally in Brazil.
36
Table 4.1 - The estimation about the effect of the privet credit on the growth in GDPP-PC
(1) (2) (3) (4) (5) (6) (7) (8)
VARIABLES loggdppc loggdppc loggdppc loggdppc loggdppc loggdppc loggdppc loggdppc
privcrdt 0.0116*** 0.0141*** 0.00980*** 0.00951*** 0.00303* 0.00387** 0.00318 0.00296 (0.00108) (0.000997) (0.00192) (0.00176) (0.00179) (0.00185) (0.00195) (0.00178) finopen 0.417*** 0.412*** 0.228* 0.203* 0.280*** 0.265*** 0.283*** 0.191** (0.118) (0.0970) (0.116) (0.106) (0.0906) (0.0898) (0.0933) (0.0902) tradeopen 0.00753*** -0.0290*** -0.0213*** -0.0173** -0.0181*** -0.0186*** -0.0182*** -0.0255*** (0.00130) (0.00696) (0.00738) (0.00688) (0.00544) (0.00537) (0.00552) (0.00555) termoftred 0.000128 -0.0133*** -0.0160*** -0.0124*** -0.0120*** -0.0114*** -0.0119*** -0.0177*** (0.00208) (0.00304) (0.00327) (0.00320) (0.00250) (0.00250) (0.00255) (0.00299) c.tradeopen#c.termoftred 0.000363*** 0.000255*** 0.000225*** 0.000232*** 0.000235*** 0.000233*** 0.000307***
(6.82e-05) (7.61e-05) (7.04e-05) (5.61e-05) (5.53e-05) (5.70e-05) (5.71e-05)
hc 0.747*** 0.580** 1.202*** 1.150*** 1.181*** 1.168*** (0.252) (0.237) (0.218) (0.217) (0.242) (0.220) inf -0.00416*** -0.00391*** -0.00337*** -0.00387*** -0.00252** (0.00128) (0.00117) (0.00121) (0.00120) (0.00118) rqest 0.525*** 0.488*** 0.523*** 0.542*** (0.0893) (0.0913) (0.0909) (0.0831) z_score 0.0100 (0.00655) vix -0.000291 -0.00128 (0.00137) (0.00129) reer_broad 0.00424*** (0.00136) Constant 8.376*** 9.676*** 8.413*** 8.487*** 6.676*** 6.668*** 6.723*** 7.026*** (0.241) (0.314) (0.534) (0.490) (0.504) (0.496) (0.554) (0.515) Observations 64 64 60 60 56 56 56 56 R-squared 0.881 0.921 0.926 0.939 0.961 0.963 0.961 0.968 Number of country 4 4 4 4 4 4 4 4
country FE YES YES YES YES YES YES YES YES
Time FE NO NO NO NO NO NO NO NO
Standard errors in parentheses *** p<0.01, ** p<0.05, * p<0.1
37
Table 4.1 - The estimation about the effect of the domestic credit on the growthin GDPP-PC
Standard errors in parentheses *** p<0.01, ** p<0.05, * p<0.1
(1) (2) (3) (4) (5) (6) (7) (8)
VARIABLES loggdppc loggdppc loggdppc loggdppc loggdppc loggdppc loggdppc loggdppc
domecrd 0.0113*** 0.0126*** 0.00961*** 0.00931*** 0.00466*** 0.00461*** 0.00480*** 0.00409*** (0.000880) (0.000835) (0.00142) (0.00129) (0.00137) (0.00137) (0.00143) (0.00135) finopen 0.459*** 0.484*** 0.310*** 0.283*** 0.311*** 0.306*** 0.319*** 0.236*** (0.102) (0.0904) (0.104) (0.0946) (0.0829) (0.0833) (0.0860) (0.0855) tradeopen 0.00724*** -0.0182*** -0.0157** -0.0121** -0.0168*** -0.0165*** -0.0167*** -0.0228*** (0.00115) (0.00629) (0.00606) (0.00557) (0.00470) (0.00472) (0.00475) (0.00494) termoftred 0.00272 -0.00602** -0.0111*** -0.00782*** -0.00984*** -0.00949*** -0.00963*** -0.0149*** (0.00177) (0.00265) (0.00296) (0.00283) (0.00234) (0.00238) (0.00242) (0.00294) c.tradeopen#c.termoftred 0.000253*** 0.000196*** 0.000169*** 0.000218*** 0.000215*** 0.000218*** 0.000279***
(6.19e-05) (6.14e-05) (5.60e-05) (4.76e-05) (4.80e-05) (4.81e-05) (4.99e-05)
hc 0.682*** 0.528*** 1.004*** 1.027*** 0.979*** 1.028*** (0.210) (0.194) (0.184) (0.187) (0.196) (0.183) inf -0.00396*** -0.00387*** -0.00360*** -0.00380*** -0.00268** (0.00113) (0.00108) (0.00112) (0.00110) (0.00110) rqest 0.441*** 0.436*** 0.439*** 0.475*** (0.0834) (0.0837) (0.0842) (0.0795) z_score 0.00508 (0.00585) vix -0.000474 -0.00121 (0.00120) (0.00115) reer_broad 0.00359*** (0.00130) Constant 8.128*** 8.973*** 8.075*** 8.149*** 6.967*** 6.840*** 7.010*** 7.150*** (0.206) (0.275) (0.381) (0.345) (0.364) (0.393) (0.384) (0.361) Observations 64 64 60 60 56 56 56 56 R-squared 0.907 0.928 0.941 0.953 0.967 0.968 0.967 0.972 Number of country 4 4 4 4 4 4 4 4
country FE YES YES YES YES YES YES YES YES
Time FE NO NO NO NO NO NO NO NO
38
Table 4.2 - The estimation about the effect of the stock market capitalization on the growth in GDPP-PC
(1) (2) (3) (4) (5) (6) (7) (8)
VARIABLES loggdppc loggdppc loggdppc loggdppc loggdppc loggdppc loggdppc loggdppc
stockmart 0.00259 0.00229 0.00406*** 0.00364*** 0.00329*** 0.00349*** 0.00342*** 0.00281*** (0.00258) (0.00268) (0.00138) (0.00131) (0.000777) (0.000849) (0.000783) (0.000927) finopen 0.958*** 0.946*** 0.102 0.0883 0.240*** 0.240*** 0.217** 0.189** (0.195) (0.198) (0.136) (0.128) (0.0795) (0.0801) (0.0815) (0.0843) tradeopen 0.0112*** 0.0169 -0.00768 -0.00390 -0.0188*** -0.0192*** -0.0193*** -0.0218*** (0.00220) (0.0133) (0.00752) (0.00726) (0.00452) (0.00460) (0.00453) (0.00495) termoftred 0.00810** 0.0100* -0.0171*** -0.0135*** -0.0138*** -0.0142*** -0.0143*** -0.0164*** (0.00340) (0.00558) (0.00380) (0.00385) (0.00223) (0.00234) (0.00227) (0.00282)
c.tradeopen#c.termoftred -5.79e-05 9.26e-05 6.53e-05 0.000232*** 0.000237*** 0.000237*** 0.000263***
(0.000134) (7.48e-05) (7.15e-05) (4.56e-05) (4.66e-05) (4.56e-05) (5.00e-05)
hc 1.801*** 1.610*** 1.541*** 1.529*** 1.566*** 1.542*** (0.167) (0.173) (0.103) (0.105) (0.105) (0.106) inf -0.00399** -0.00331*** -0.00347*** -0.00347*** -0.00297** (0.00151) (0.00103) (0.00107) (0.00104) (0.00111) rqest 0.599*** 0.602*** 0.587*** 0.597*** (0.0623) (0.0630) (0.0629) (0.0631) z_score -0.00376 (0.00604) vix 0.00127 0.000684 (0.00110) (0.00120) reer_broad 0.00184 (0.00151) Constant 7.425*** 7.250*** 6.179*** 6.304*** 5.980*** 6.070*** 5.953*** 6.098*** (0.392) (0.565) (0.304) (0.291) (0.175) (0.228) (0.176) (0.211) Observations 64 64 60 60 56 56 56 56 R-squared 0.637 0.639 0.904 0.916 0.971 0.971 0.971 0.972 Number of country 4 4 4 4 4 4 4 4
country FE YES YES YES YES YES YES YES YES
Time FE NO NO NO NO NO NO NO NO
Standard errors in parentheses *** p<0.01, ** p<0.05, * p<0.1
39
Table 3.4 - The estimation about the effect of the credit to government on the growth in GDPP-PC
(1) (2) (3) (4) (5) (6) (7) (8)
VARIABLES loggdppc loggdppc loggdppc loggdppc loggdppc loggdppc loggdppc loggdppc
crdgov -0.0208*** -0.0206*** -0.0111*** -0.0106*** -0.00468* -0.00467 -0.00501* -0.00398* (0.00574) (0.00582) (0.00365) (0.00341) (0.00244) (0.00282) (0.00249) (0.00233) finopen 1.086*** 1.072*** 0.361** 0.328** 0.357*** 0.357*** 0.346*** 0.247** (0.165) (0.172) (0.142) (0.133) (0.0950) (0.0993) (0.0964) (0.0955) tradeopen 0.0124*** 0.0162 -0.00246 0.00105 -0.0136** -0.0136** -0.0138*** -0.0211*** (0.00203) (0.0118) (0.00734) (0.00697) (0.00508) (0.00514) (0.00511) (0.00535) termoftred 0.0106*** 0.0118** -0.0115*** -0.00802** -0.0102*** -0.0102*** -0.0104*** -0.0162*** (0.00310) (0.00486) (0.00385) (0.00379) (0.00257) (0.00260) (0.00259) (0.00311)
c.tradeopen#c.termoftred -3.94e-05 5.35e-05 2.91e-05 0.000185*** 0.000185*** 0.000187*** 0.000260***
(0.000118) (7.29e-05) (6.86e-05) (5.10e-05) (5.16e-05) (5.13e-05) (5.37e-05)
hc 1.602*** 1.408*** 1.440*** 1.441*** 1.453*** 1.432*** (0.177) (0.179) (0.123) (0.133) (0.124) (0.115) inf -0.00427*** -0.00397*** -0.00397*** -0.00411*** -0.00282** (0.00148) (0.00116) (0.00124) (0.00118) (0.00118) rqest 0.574*** 0.574*** 0.563*** 0.584*** (0.0742) (0.0752) (0.0760) (0.0706) z_score 6.90e-05 (0.00727) vix 0.000978 -9.55e-05 (0.00127) (0.00123) reer_broad 0.00398*** (0.00137) Constant 7.566*** 7.445*** 6.294*** 6.430*** 6.020*** 6.018*** 6.006*** 6.320*** (0.358) (0.511) (0.310) (0.293) (0.209) (0.292) (0.210) (0.223) Observations 64 64 60 60 56 56 56 56 R-squared 0.701 0.702 0.904 0.918 0.962 0.962 0.962 0.969 Number of country 4 4 4 4 4 4 4 4
country FE YES YES YES YES YES YES YES YES
Time FE NO NO NO NO NO NO NO NO
Standard errors in parentheses *** p<0.01, ** p<0.05, * p<0.1
40
Table 4.5 - the estimation about the effect of the Lerner index on the growth in GDPP-PC
Standard errors in parentheses *** p<0.01, ** p<0.05, * p<0.1
(1) (2) (3) (4) (5) (6) (7) (8)
VARIABLES loggdppc loggdppc loggdppc loggdppc loggdppc loggdppc loggdppc loggdppc
lerind 0.256 0.240 0.463*** 0.349** 0.109 0.0758 0.117 0.0569 (0.255) (0.258) (0.148) (0.158) (0.113) (0.136) (0.114) (0.107) finopen 0.960*** 0.939*** 0.143 0.138 0.286*** 0.286*** 0.275*** 0.189** (0.194) (0.199) (0.132) (0.129) (0.0926) (0.0934) (0.0958) (0.0929) tradeopen 0.0108*** 0.0182 -0.00654 -0.00322 -0.0155*** -0.0151*** -0.0158*** -0.0228*** (0.00220) (0.0130) (0.00739) (0.00746) (0.00524) (0.00536) (0.00530) (0.00544) termoftred 0.00865** 0.0110** -0.0147*** -0.0121*** -0.0119*** -0.0115*** -0.0121*** -0.0177*** (0.00337) (0.00536) (0.00368) (0.00387) (0.00257) (0.00271) (0.00263) (0.00307)
c.tradeopen#c.termoftred -7.41e-05 8.40e-05 5.78e-05 0.000200*** 0.000195*** 0.000202*** 0.000273***
(0.000130) (7.36e-05) (7.34e-05) (5.28e-05) (5.42e-05) (5.34e-05) (5.49e-05)
hc 1.709*** 1.586*** 1.516*** 1.527*** 1.529*** 1.489*** (0.167) (0.178) (0.120) (0.124) (0.124) (0.115) inf -0.00303* -0.00357*** -0.00349*** -0.00364*** -0.00249* (0.00168) (0.00125) (0.00128) (0.00127) (0.00124) rqest 0.597*** 0.598*** 0.589*** 0.613*** (0.0757) (0.0765) (0.0775) (0.0719) z_score 0.00348 (0.00785) vix 0.000707 -0.000417 (0.00131) (0.00126) reer_broad 0.00419*** (0.00143) Constant 7.419*** 7.195*** 6.169*** 6.244*** 5.914*** 5.829*** 5.899*** 6.248*** (0.392) (0.557) (0.301) (0.297) (0.205) (0.283) (0.209) (0.226) Observations 64 64 60 60 56 56 56 56 R-squared 0.637 0.640 0.905 0.911 0.959 0.960 0.960 0.967 Number of country 4 4 4 4 4 4 4 4
country FE YES YES YES YES YES YES YES YES
Time FE NO NO NO NO NO NO NO NO
41
Table 4.6 - The estimation about the effect of the Boone indicator on the growth in GDPP-PC
(1) (2) (3) (4) (5) (6) (7) (8)
VARIABLES loggdppc loggdppc loggdppc loggdppc loggdppc loggdppc loggdppc loggdppc
booneind 0.155** 0.158** 0.0796 0.0768 0.146 0.168* 0.157* 0.115 (0.0695) (0.0698) (0.0536) (0.0502) (0.0906) (0.0916) (0.0924) (0.0867) finopen 0.944*** 0.906*** 0.172 0.147 0.201* 0.179 0.180 0.120 (0.179) (0.185) (0.141) (0.132) (0.108) (0.109) (0.113) (0.106) tradeopen 0.0111*** 0.0213* -0.00322 0.000484 -0.0124** -0.0117** -0.0125** -0.0203*** (0.00212) (0.0125) (0.00782) (0.00744) (0.00530) (0.00530) (0.00534) (0.00563) termoftred 0.00841** 0.0117** -0.0146*** -0.0108*** -0.0111*** -0.0104*** -0.0113*** -0.0170*** (0.00326) (0.00515) (0.00394) (0.00393) (0.00252) (0.00255) (0.00256) (0.00307)
c.tradeopen#c.termoftred -0.000103 4.70e-05 2.18e-05 0.000166*** 0.000156*** 0.000166*** 0.000246***
(0.000125) (7.76e-05) (7.33e-05) (5.41e-05) (5.42e-05) (5.44e-05) (5.75e-05)
hc 1.787*** 1.575*** 1.507*** 1.535*** 1.524*** 1.488*** (0.177) (0.182) (0.118) (0.119) (0.121) (0.113) inf -0.00446*** -0.00640*** -0.00633*** -0.00671*** -0.00469** (0.00158) (0.00193) (0.00192) (0.00199) (0.00197) rqest 0.552*** 0.532*** 0.539*** 0.571*** (0.0821) (0.0830) (0.0845) (0.0789) z_score 0.00810 (0.00644) vix 0.000904 -0.000190 (0.00129) (0.00125) reer_broad 0.00402*** (0.00140) Constant 7.484*** 7.171*** 6.057*** 6.212*** 5.987*** 5.817*** 5.973*** 6.292*** (0.380) (0.536) (0.319) (0.304) (0.209) (0.247) (0.211) (0.224) Observations 64 64 60 60 56 56 56 56 R-squared 0.661 0.665 0.891 0.907 0.961 0.962 0.961 0.968 Number of country 4 4 4 4 4 4 4 4
country FE YES YES YES YES YES YES YES YES
Time FE NO NO NO NO NO NO NO NO
Standard errors in parentheses *** p<0.01, ** p<0.05, * p<0.1
42
Table 4.7 - The estimation about the effect of the financial institutions on the growth in GDPP-PC
Standard errors in parentheses *** p<0.01, ** p<0.05, * p<0.1
(1) (2) (3) (4) (5) (6) (7) (8)
VARIABLES loggdppc loggdppc loggdppc loggdppc loggdppc loggdppc loggdppc loggdppc
FI 2.747*** 2.754*** 1.887*** 1.791*** 1.066*** 1.028*** 1.068*** 0.949*** (0.202) (0.206) (0.256) (0.255) (0.245) (0.251) (0.250) (0.227) finopen 0.197* 0.202* 0.0161 0.0225 0.162* 0.157* 0.162* 0.0946 (0.104) (0.106) (0.0972) (0.0950) (0.0820) (0.0826) (0.0841) (0.0784) tradeopen 0.00265** 0.000862 -0.00458 -0.00293 -0.0106** -0.0103** -0.0106** -0.0169*** (0.00116) (0.00631) (0.00541) (0.00536) (0.00443) (0.00447) (0.00449) (0.00448) termoftred 0.00139 0.000815 -0.00857*** -0.00704** -0.00886*** -0.00865*** -0.00885*** -0.0138*** (0.00152) (0.00251) (0.00293) (0.00298) (0.00237) (0.00240) (0.00243) (0.00267)
c.tradeopen#c.termoftred 1.87e-05 5.11e-05 4.15e-05 0.000133*** 0.000129*** 0.000133*** 0.000199***
(6.49e-05) (5.47e-05) (5.37e-05) (4.55e-05) (4.60e-05) (4.61e-05) (4.62e-05)
hc 0.937*** 0.866*** 1.135*** 1.171*** 1.134*** 1.126*** (0.204) (0.203) (0.175) (0.182) (0.180) (0.162) inf -0.00201* -0.00243** -0.00223** -0.00242** -0.00144 (0.00111) (0.00101) (0.00105) (0.00104) (0.000983) rqest 0.423*** 0.425*** 0.423*** 0.454*** (0.0756) (0.0761) (0.0768) (0.0696) z_score 0.00421 (0.00548) vix -4.50e-05 -0.000791 (0.00108) (0.000996) reer_broad 0.00371*** (0.00115) Constant 7.803*** 7.850*** 6.956*** 7.004*** 6.405*** 6.277*** 6.407*** 6.671*** (0.174) (0.241) (0.280) (0.275) (0.249) (0.301) (0.256) (0.244) Observations 56 56 56 56 52 52 52 52 R-squared 0.929 0.929 0.951 0.955 0.971 0.972 0.971 0.978 Number of country 4 4 4 4 4 4 4 4
country FE YES YES YES YES YES YES YES YES
Time FE NO NO NO NO NO NO NO NO
43
Table 4.4-The estimation about the effect of the financial markets on the growth in GDPP-PC
(1) (2) (3) (4) (5) (6) (7) (8)
VARIABLES loggdppc loggdppc loggdppc loggdppc loggdppc loggdppc loggdppc loggdppc
FM 0.515 0.533 -0.232 -0.156 0.202 0.135 0.198 0.0219 (0.377) (0.450) (0.267) (0.259) (0.185) (0.195) (0.188) (0.180) finopen 1.008*** 1.009*** 0.0555 0.0645 0.230** 0.211** 0.222** 0.116 (0.183) (0.186) (0.142) (0.137) (0.0994) (0.101) (0.102) (0.0990) tradeopen 0.00921*** 0.00802 -0.00152 0.000116 -0.0165** -0.0147** -0.0165** -0.0205*** (0.00228) (0.0161) (0.00917) (0.00884) (0.00632) (0.00655) (0.00638) (0.00594) termoftred 0.00596* 0.00552 -0.0150*** -0.0122*** -0.0135*** -0.0125*** -0.0136*** -0.0181*** (0.00348) (0.00684) (0.00439) (0.00441) (0.00289) (0.00302) (0.00292) (0.00303)
c.tradeopen#c.termoftred 1.23e-05 1.43e-05 1.08e-05 0.000200*** 0.000178** 0.000199*** 0.000239***
(0.000164) (9.32e-05) (8.95e-05) (6.58e-05) (6.89e-05) (6.65e-05) (6.17e-05)
hc 2.103*** 1.864*** 1.616*** 1.665*** 1.624*** 1.597*** (0.210) (0.229) (0.159) (0.165) (0.162) (0.147) inf -0.00350** -0.00346*** -0.00302** -0.00354*** -0.00214* (0.00158) (0.00119) (0.00126) (0.00121) (0.00119) rqest 0.614*** 0.601*** 0.609*** 0.604*** (0.0802) (0.0812) (0.0824) (0.0747) z_score 0.00716 (0.00674) vix 0.000507 -0.000399 (0.00128) (0.00120) reer_broad 0.00443*** (0.00145) Constant 7.580*** 7.614*** 5.524*** 5.779*** 5.827*** 5.602*** 5.815*** 6.092*** (0.378) (0.590) (0.395) (0.396) (0.263) (0.337) (0.267) (0.259) Observations 56 56 56 56 52 52 52 52 R-squared 0.668 0.668 0.895 0.906 0.959 0.960 0.959 0.967 Number of country 4 4 4 4 4 4 4 4
country FE YES YES YES YES YES YES YES YES
Time FE NO NO NO NO NO NO NO NO
Standard errors in parentheses *** p<0.01, ** p<0.05, * p<0.1
44
Table 4.5 - The estimation about the effect of the financial development on the growth in GDPP-PC
(1) (2) (3) (4) (5) (6) (7) (8)
VARIABLES loggdppc loggdppc loggdppc loggdppc loggdppc loggdppc loggdppc loggdppc
FD 2.165*** 2.460*** 0.807** 0.799** 0.635** 0.580** 0.629** 0.429* (0.387) (0.418) (0.382) (0.363) (0.246) (0.262) (0.250) (0.243) finopen 0.563*** 0.564*** 0.0613 0.0686 0.229** 0.221** 0.225** 0.144 (0.166) (0.163) (0.137) (0.130) (0.0918) (0.0933) (0.0946) (0.0926) tradeopen 0.00537*** -0.0141 -0.0124 -0.00924 -0.0181*** -0.0173*** -0.0181*** -0.0226*** (0.00193) (0.0117) (0.00829) (0.00800) (0.00537) (0.00555) (0.00544) (0.00530) termoftred 0.000860 -0.00604 -0.0177*** -0.0142*** -0.0131*** -0.0127*** -0.0132*** -0.0176*** (0.00278) (0.00491) (0.00387) (0.00396) (0.00253) (0.00263) (0.00258) (0.00289) c.tradeopen#c.termoftred 0.000199* 0.000127 0.000109 0.000216*** 0.000206*** 0.000216*** 0.000262***
(0.000118) (8.43e-05) (8.06e-05) (5.54e-05) (5.78e-05) (5.61e-05) (5.47e-05)
hc 1.718*** 1.494*** 1.415*** 1.453*** 1.421*** 1.435*** (0.250) (0.255) (0.173) (0.184) (0.177) (0.164) inf -0.00360** -0.00326*** -0.00303** -0.00330*** -0.00224* (0.00150) (0.00111) (0.00117) (0.00114) (0.00113) rqest 0.576*** 0.574*** 0.574*** 0.591*** (0.0732) (0.0739) (0.0750) (0.0699) z_score 0.00413 (0.00639) vix 0.000273 -0.000453 (0.00121) (0.00115) reer_broad 0.00375** (0.00138) Constant 7.797*** 8.335*** 6.316*** 6.507*** 6.140*** 6.000*** 6.131*** 6.332*** (0.301) (0.434) (0.425) (0.413) (0.275) (0.351) (0.281) (0.271) Observations 56 56 56 56 52 52 52 52 R-squared 0.791 0.803 0.903 0.914 0.964 0.964 0.964 0.970 Number of country 4 4 4 4 4 4 4 4
country FE YES YES YES YES YES YES YES YES
Time FE NO NO NO NO NO NO NO NO
Standard errors in parentheses *** p<0.01, ** p<0.05, * p<0.1