Renewable Energy Consumption in EU-28 Countries: Policy
Toward Pollution Mitigation and Economic Sustainability
Seyi Saint Akadiri
1, Andrew Adewale Alola
2, Ada Chigozie Akadiri
1,
Uju Violet Alola
2Abstract
A major challenge facing humans in the 21st century is how to strike a balance between the mitigation of environmental degradation and the achievement of sustainable economic growth. On this note, this investigation applies an autoregressive distributed lag (ARDL) methodology to a panel data of 28 European Union (EU-28) countries over the period 1995-2015. The study confirms the existence of positive and significant long-run nexus among environmental sustainability, renewable energy consumption and economic growth in the EU-28 countries. In addition, empirical results indicate that real gross fixed capital formation, carbon emissions and other environmental factors are principal determinants of long-run growth in the EU. Using Dumitrescu and Hurlin (2012) Granger non-causality in heterogeneous panel, results show long-run bidirectional causal relationships among renewable energy consumption, economic growth and other growth determinants. Based on these results, we infer that the exploitation of renewable energy sources in the EU-28 countries is a reliable pathway toward environmental pollution mitigation. This indicates that achieving the sustainable development goals (SDGs) by the year 2030 through renewable energy consumption and carbon emission mitigation is very much achievable in the EU-28 countries, and should also be adopted by all countries as an effective global policy.
Keywords: Renewable energy consumption; economic growth; economic sustainability; pollution mitigation;
European Union.
JEL Classifications : Q42, Q43, C23, C33
1. Introduction
In recent times, the relationship between renewable energy and economic growth, alongside other key growth determinants, has been a topic of discussion among policymakers and
1
Eastern Mediterranean Univ, Dept Econ, Fac Business & Econ, Via Mersin 10, Famagusta, North Cyprus, Turkey,
Istanbul Gelisim Univ, Fac Econ Adm & Social Sci, Istanbul, Turkey, [email protected]
1
Eastern Mediterranean Univ, Dept Econ, Fac Business & Econ, Via Mersin 10, Famagusta, North Cyprus, Turkey,
2
researchers (see Adjaye, 2000; Sari and Soytas, 2004; Ewing, Mahadevan and Asafu-Adjaye, 2007; Sari and Soytas, 2007; Sadorsky, 2009a, 2009b; Apergis and Payne, 2010a, 2010b; Apergis et al., 2010; Bartleet and Gounder, 2010; Marques, Fuinhas and Manso, 2010; Menyah and Wolde-Rufael, 2010; Menegaki, 2011; Atasoy, 2017; Dogan and Aslan, 2017; Paramati, Mo and Gupta, 2017; Alola & Alola, 2018; Emir & Bekun, 2018; Akadiri et al., 2019; Akadiri, Saint Akadiri & Gungor, 2019; Bekun, Emir & Sarkodie, 2019). Governments, policymakers, private institutions and individuals across the globe have come to realize the indispensable contributions of renewables in creating employment opportunities and thereby sustaining economic growth. For instance, by consuming more of renewable energy, the European Union has the tendency to reduce its dependency on fossil fuel importation, thereby making its energy production and consumption more sustainable for both the economies of the bloc countries and it respective environment. In addition, the curiosity of environmentalist and other researchers have continued to unveil further studies into non-economic drivers of the environment like immigration, healthcare, and other similar determinants (Alola, 2019a & b; Alola et al., 2019; Bekun, Alola & Sarkodie, 2019; Akadiri et al., 2019).
The European Council and the European Union Parliament recently adopted the renewable energy directive (RED) goals for the year 2020. This RED program sets progressive targets for member countries. The overall aim is to ensure that renewable energy share in the final energy consumption mix by the year 2020 reaches 20%. The specifics for achieving this objective include; sectorial targets for transportation, temperature control and electricity, planned energy policy measures for combining various types of renewable technologies, and the use of corporate mechanism to enforce joint support schemes, joint projects and statistical transfer among member states. However, to achieve these stated goals, it is crucial to have a clear understanding of the long-run equilibrium impacts and benefits of renewable energy in promoting and sustaining economic growth. It is on this premise that our current study seeks to contribute to the recent and ongoing debate on renewable energy-economic growth relationship, using the EU-28 countries as a case study. However, unlike the existing studies that focus solely on the causal relationship between macroeconomic variables, this study examines not only the causal relationship but also investigates whether there is a significant long-run equilibrium relationship
between the variables of interest and its implication towards environmental sustainability across Europe.
In contrast to the existing studies, our study focuses on the long-run environmental sustainability between renewable energy consumption and economic growth in EU-28 countries. We estimate a dynamic panel growth model using an autoregressive distributed lag (ARDL) model framework. We build a panel of 28 European Union member countries for the period 1995-2017, which is used in the specification of an error correction model set up within an ARDL framework and estimated via three alternative approaches—the pooled mean group (PMG), the mean group (MG) and the dynamic fixed effect (DFE) techniques. The use of these estimation techniques is suitable when working with heterogeneous panels. The macro panel data in our study is evaluated for stationarity and cointegration. Our findings indicate that with regards to renewable energy, EU-28 countries are converging towards the long-run environmental sustainability path, whereas renewable energy consumption and economic growth are significantly positively correlated. Our results are consistent with the findings of Sadorsky (2009a) for G7 countries, and Apergis and Payne (2010b) for Eurasian countries.
Following existing related studies and the aforementioned motivation, the contribution of this study is two-fold; (i) this study is the first to examine the relationship through the pooled mean group (PMG), the mean group (MG) and the dynamic fixed effect (DFE) techniques for Europe. We employ a relatively new and unique method of evaluating short- and long-run relationships between renewable energy and economic growth in a dynamic panel framework that also reports the speed of adjustment which shows how fast or slow the EU-28 countries are converging towards or diverging from the steady state long-run environmental sustainability path. (ii) Unlike the neutrality hypothesis reported by Menegaki (2011) which claims that there is uneven and insufficient exploitation of renewable energy across the EU-27 countries over the period 1997-2007, our study employs a larger and more recent panel dataset which covers the period 1995-2015 for all the EU-28 countries. Based on our updated panel dataset for the EU-28 countries and estimation techniques employed, we find long-run bidirectional dynamic causality between renewable energy and economic growth. This indicates that the exploitation of renewable energy across Europe is an effective means of attaining sustainable mitigation of environmental pollution and risks. This indicates that the region is now moving towards environmental
sustainability path. Our results are indicative and provide valuable insight for the corresponding renewable energy-growth policy decision making across Europe.
The study layout is as follows; section-2 gives an overview of the previous studies and the state of renewable energy in EU-28 countries, section-3 introduces the data and empirical models used, section-4 presents and discusses the empirical results, while section-5 is the concluding part.
2. Overview of previous studies
Previous studies have subsequently discussed and provides insight into the environmental and renewable energy-economic growth relationship. For instance, the study of Sadorsky (2009a) examines the nexus between renewable energy consumption, CO2 emissions and oil prices in G7
countries over the period 1980-2005, using panel cointegration regression techniques of Pedroni (2004). The author concludes that there is an existence of a long-run equilibrium relationship between the variables. Empirical findings reveal that CO2 emissions and real GDP per capita are
the main determinants of renewable energy consumption, while oil prices have significantly weak negative effect on renewable energy. Similarly, Menyah and Wolde-Rufael (2010) examine causal nexus between CO2 emissions, real GDP, nuclear and renewable energy
consumption in the United States over the period 1960-2007. By employing modified Granger causality test, they find unidirectional causality between nuclear energy and CO2 emissions and
no causal relationship between CO2 emissions and renewable energy. They opine that renewable
energy consumption is still in its infancy since it has no significant impact on emissions reduction. Also, Apergis and Payne (2009a, 2009b, 2010a, 2010b) carry out contextual studies on Central America, Organization for Economic Co-operation and Development (OECD), Commonwealth of Independent States (CIS), and most recently, Eurasian countries over the period 1992-2007 using multivariate panel data model. They find a bidirectional causality between economic growth and renewable energy in both the short-run and long-run. Additionally, Marques et al. (2010) examine the motivation for the adoption of renewable energy within the European countries, using fixed effect vector decomposition panel data methodology over the period 1990-2006. The empirical findings reveal that CO2 emissions and traditional
Furthermore, Menegaki (2011) examines the relationship between economic growth and renewable energy in 27 European countries via a multivariate panel model over the period 1997-2007. The author includes in the model additional variables such as employment, GHG emissions, and final energy consumption. The empirical results fail to provide any evidence in support of a causal relation between renewable energy consumption and economic growth; hence, the author concludes that the neutrality hypothesis holds within the examined countries. This is suggested to be due to biased and inadequate utilization of the renewable energy sources across Europe. Likewise, Ocal and Aslan (2013) investigate the renewable energy consumption-economic growth Granger causality relationship for Turkey within country-specific and multi-country empirical frameworks, using Autoregressive Distributed Lag (ARDL) and Johansen cointegration techniques. The empirical findings from the study are inconsistent and show no consensus on the direction of causality between economic growth and renewable energy consumption. In a related study, Lin and Moubarak (2014) examine the long-run relationship between renewable energy and economic growth in China. The empirical findings show that there is long-run bidirectional causality running between economic growth and renewable energy consumption. This is line with the study of Shahbaz et al. (2015) where renewable energy, labor and capital are found to contribute immensely to the economic growth of Pakistan.
Moreover, the recent studies by Alola et al (2019) importantly reveals the impact of immigration on the environmental condition of the EU largest states. The EU largest states (France, Germany, and the United Kingdom) have all contended with the socio-economic challenges associated with the inflow of migrants on one hand and other migrant classifications on the other hand. In addition, Alola 2019a & 2019b respectively hints on the significant impact of healthcare policy and immigration policy in the United States. While both studies posit recent evidence of immigration-environment nexus, it importantly provides information on the pertinent challenge of immigration and the healthcare system with fresh evidence. By considering a different perspective, Akadiri et al 2019, examined the potential impact of globalization of the environment by employing the Environmental Kuznets Curve (EKC) hypothesis for the tourism destination states. By observing a positive effect of globalization and income on carbon emission, Akadiri et al (2019) thus confirms the globalization-tourism-induced EKC hypothesis.
2.1 EU Renewable Energy Outlook: Indication for global environmental
sustainability
Globally, and specifically among the 28 member states of the European Union, there has been conscious effort directed towards reducing CO2 emissions and consistent switching from
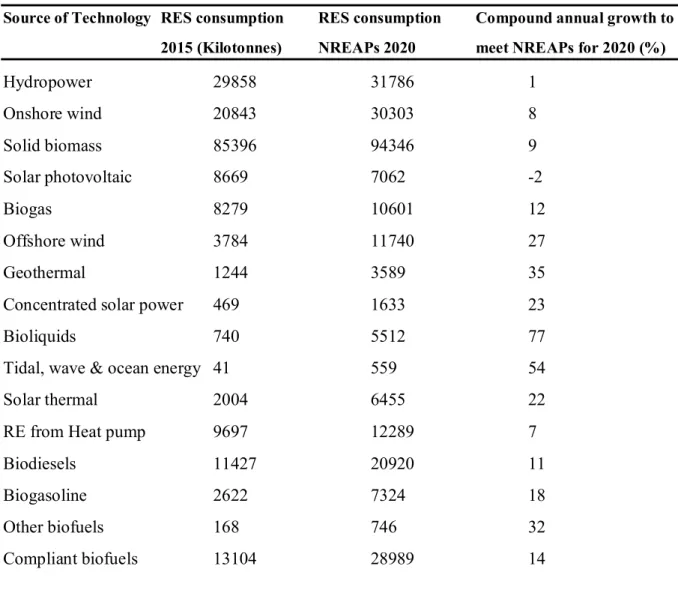
traditional energy sources to renewable sources. A handful of renewable energy sources (RES) are currently being explored through innovative technologies across Europe (World Energy Resources, 2016). Information provided in the reports of the European Environmental Agency (EEA), Eurostat and the National Renewable Energy Action Plan (NREAP) as indicated in Table-1 affirm the rapidly increasing trend of renewable energy consumption in the EU-28 countries. In mid-2010, the EU-28 member states submitted the NREAP which was adopted as the indicative supranational path to meet the renewable energy source target for 2020. The guidelines contained in the document were subsequently updated as interim trajectories noted in REN21 (2016) and the Renewable Energy Directive3 (EEA, 2017). Renewable energy is mainly consumed in three major renewable energy market sectors in the EU, namely; renewable electricity, renewable temperature control (heating and cooling) and transportation.
3
The Renewable Energy Directive3 (Directive 2009/28/EC, RED), sets minimum indicative trajectories for each
member country that end in the binding national RES share targets for 2020. The years 2013 and 2014 have observed RED target for the EU as 12.1 %. For the years 2015 and 2016, it is 13.8%. It has already surpassed the target level in 2014 since it achieved a RES share of 16.0%.
Table 1: Sources of renewable energy technology and volume of consumption in EU-28 countries
Source of Technology RES consumption RES consumption Compound annual growth to 2015 (Kilotonnes) NREAPs 2020 meet NREAPs for 2020 (%)
Hydropower 29858 31786 1 Onshore wind 20843 30303 8 Solid biomass 85396 94346 9 Solar photovoltaic 8669 7062 -2 Biogas 8279 10601 12 Offshore wind 3784 11740 27 Geothermal 1244 3589 35
Concentrated solar power 469 1633 23
Bioliquids 740 5512 77
Tidal, wave & ocean energy 41 559 54
Solar thermal 2004 6455 22
RE from Heat pump 9697 12289 7
Biodiesels 11427 20920 11
Biogasoline 2622 7324 18
Other biofuels 168 746 32
Compliant biofuels 13104 28989 14
______________________________________________________________________________
Sources include the Renewable energy in Europe 2017 by EEA, Eurostat and the NREAP reports. The RES biofuel sources for transportation energies (biodiesels, bio gasoline, other biofuels and complaint biofuels) are second generation biofuels based on the Indirect land use change (ILUC) for biofuels and bioliquids (ILUC Directive; EU 2015).
The EU-28, as part of the signatory of the Kyoto protocol of the United Nations Framework Convention on Climate Change (UNFCCC), has fulfilled the Kyoto Protocol's first commitment period of 2008-2012 (European Commission’s Progress Report, 2016). It is indicated in the report that the commission (and the member states) is firmly on course to attain its 2020 target for reducing GHG emissions, which is the Kyoto Protocol's second commitment period of 2013-2020. The regional body (EU-28) and individual constituent nations have implemented several
policies that include 2001/77/EC and 2009/28/EC4 to aid the drive toward meeting the set of targets mentioned above and specifically to promote the use of energy from renewable sources. This is in line with the recent move by the French government regarding the policy to ban or end the sales of petrol and diesel vehicles by 2040 as part of ambitious and far-reaching efforts to wean the country’s economy from fossil fuels, and as such, meeting its targets under the Paris climate accord.
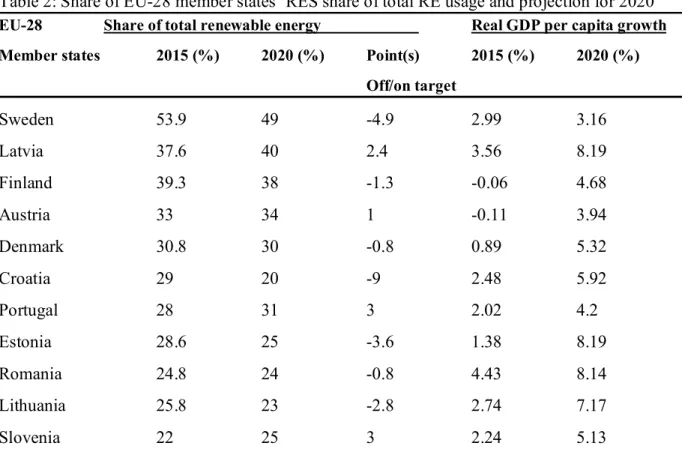
The reports made available through the World Economic Forum (2017) and EEA (2017) indicate the progression of renewable energy consumption for 2015 and projection for 2020 among the EU-28 member countries. Evidence from these reports as indicated in Table-2 confirm that eleven (11) of the members states (countries with negative point target in Table-2) have attained the 2020 targets in good time.
Table 2: Share of EU-28 member states’ RES share of total RE usage and projection for 2020
EU-28 Share of total renewable energy Real GDP per capita growth Member states 2015 (%) 2020 (%) Point(s) 2015 (%) 2020 (%)
Off/on target Sweden 53.9 49 -4.9 2.99 3.16 Latvia 37.6 40 2.4 3.56 8.19 Finland 39.3 38 -1.3 -0.06 4.68 Austria 33 34 1 -0.11 3.94 Denmark 30.8 30 -0.8 0.89 5.32 Croatia 29 20 -9 2.48 5.92 Portugal 28 31 3 2.02 4.2 Estonia 28.6 25 -3.6 1.38 8.19 Romania 24.8 24 -0.8 4.43 8.14 Lithuania 25.8 23 -2.8 2.74 7.17 Slovenia 22 25 3 2.24 5.13 4
The 2001/77/EC and 2009/28/EC are European commission directives in 2001 and 2009 respectively that are both aimed at promoting the use of energy from renewable source.
Bulgaria 18.2 16 -2.2 4.28 6.73 Italy 17.5 17 -0.5 0.88 3.63 Spain 16.2 20 3.8 3.28 5.05 Greece 15.4 18 2.6 0.44 6.02 France 15.2 23 7.8 0.62 4.46 Germany 14.6 18 3.4 0.84 4.10 Czech Republic 15.1 13 -2.1 4.33 1.57 Slovakia 12.9 14 1.1 3.73 6.54 Poland 11.8 15 3.2 3.91 7.48 Hungary 14.5 13 -1.5 3.39 4.62 Cyprus 9.4 13 3.6 2.26 4.25 Ireland 9.2 16 6.8 24.66 4.55 Belgium 7.9 13 5.1 0.89 3.84 United Kingdom 8.2 15 6.8 1.39 5.82 Netherlands 5.8 14 8.2 0.60 5.3 Malta 5 10 5 6.31 6.44 Luxemburg 5 11 6 1.58 4.70 ______________________________________________________________________________
Sources: Renewable Energy in Europe 2017 by EEA and World Economic Forum 2017
The EU has recently put in place a new set of targets to be met by 2030, for GHG emissions mitigation, energy efficiency, and renewable energy. Policies directed towards meeting these targets are mandatory for the member countries. With the European Commission (EC), the Council of Ministers and the European Parliament reaching a political pact in June 2018, the European Union now has a clear direction on its energy and climate targets for 2030. These targets, among others include; first, the achievement of 40 percent mitigation in domestic GHG emissions, with binding yearly GHG emission mitigation targets for EU-28 member states over the period 2021- 2030, second, an imperative target to improve the proportion of renewable energy sources in the EU-28 member states to about 32 percent of total final energy consumption by 2030, and third, a symptomatic target of about 32.5 percent increase in energy efficiency in 2030 at EU level (EEA, 2018).
3. Data and Empirical Models
3.1 Data
For the empirical estimations, we construct a panel dataset of 28 European Union countries (as presented in Tables-1 and 2) over the period 1995-2017 from the World Bank database (online). The study coverage was restricted to the specified time span due to unavailability of longer historical data. The variables employed in this study are discussed as follows:
Real GDP (RGDP) is the dependent variable; it is used as a proxy for economic growth, and measured in constant 2010 US dollars. Renewable energy consumption (REN) is energy obtained from renewable sources such as geothermal heat, waves, rain, tides and sunlight. They are naturally replenished on human timescale and have been proven to generate negligible amounts of GHGs. Renewable energy consumption is measured as a percentage of total final energy consumption. We also include in our estimation two frequently used control variables in the renewable energy-economic growth literature—carbon emissions (CO2) and real gross fixed
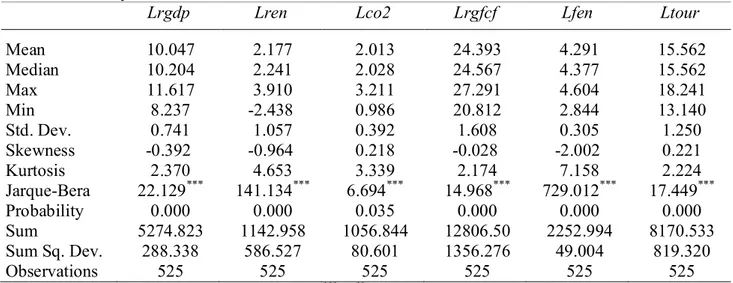
capital formation (RGFCF). These variables have been found to be significant determinants of growth (see Sadorsky, 2009a; Apergis and Payne, 2010b). Finally, an alternative form of energy—fossil fuel (FEN)—and an alternative determinant of growth—tourism (TOUR)—are employed in conducting robustness tests in line with Lee and Brahmasrene (2013).We use tourist arrivals as a proxy for tourism. This is done to eradicate the likelihood of running into multicollinearity problem when tourist receipts are used. The descriptive statistics of the variables is reported in Table-3.
Table 3: Summary statistics of the variables
Lrgdp Lren Lco2 Lrgfcf Lfen Ltour
Mean 10.047 2.177 2.013 24.393 4.291 15.562 Median 10.204 2.241 2.028 24.567 4.377 15.562 Max 11.617 3.910 3.211 27.291 4.604 18.241 Min 8.237 -2.438 0.986 20.812 2.844 13.140 Std. Dev. 0.741 1.057 0.392 1.608 0.305 1.250 Skewness -0.392 -0.964 0.218 -0.028 -2.002 0.221 Kurtosis 2.370 4.653 3.339 2.174 7.158 2.224 Jarque-Bera 22.129*** 141.134*** 6.694*** 14.968*** 729.012*** 17.449*** Probability 0.000 0.000 0.035 0.000 0.000 0.000 Sum 5274.823 1142.958 1056.844 12806.50 2252.994 8170.533 Sum Sq. Dev. 288.338 586.527 80.601 1356.276 49.004 819.320 Observations 525 525 525 525 525 525
Note: Refer to section 3 for the definition of variables. *** & ** significant at 0.01 & 0.05 levels
3.2 Empirical models
3.2.1 ECM-ARDL cointegration approach
Improving on the work of Menegaki (2011) and following other existing studies in renewable energy-economic growth literature such as Apergis and Payne (2010a, 2010b) and Marques et al. (2010), we employ a multivariate framework in examining the long-run relationship between renewable energy consumption and real GDP by incorporating carbon emissions and real gross fixed capital formation as additional determinants of economic growth and renewable energy consumption. The specified model for the study is as follows:
, , , 2 ,, ,
i t i t i t i t
RGDP f REN CO RGFCF (1)
Basically, the natural logarithm in linear specification of Eq.1 is given below:
, 0 1 , 2 , 3 , ,
lnRGDPi t lnRENi t lnCO2i t lnRGFCFi t i t (2)
Following Pesaran et al. (1999), the study commences with the following economic growth model within the common Autoregressive Distributed Lag (ARDL: ,p q ) framework that
, 1 , , 0 , , .
lnRGDPi t i
pji jlnRGDPi t j
qj i jZi t j i t (3)Where,Zi t,
lnRENi t,, lnCO2 , lni t, RGFCFi t,
In equation-3, for i1, 2,...,N and t1, 2,..., ,T the vector Z is a vector of the explanatory i t,
variables of interest and the control variables that are generally employed in energy-growth empirical analyses. While i is the country-level fixed effects, i j, represents the coefficient of the lagged lnRGDPi t, and i j, represents the coefficients of the lagged independent variables.
The ARDL cointegration technique is widely employed among researchers due to its unique econometric merits when compared to other conventional cointegration methods. The approach takes into consideration endogeneity problems, and also reports short-run as well as long-run parameter estimates individually in a single model. The cointegration technique is applicable no matter the integration order of the variables or model, i.e., whether I(0), I(1) or partly integrated.
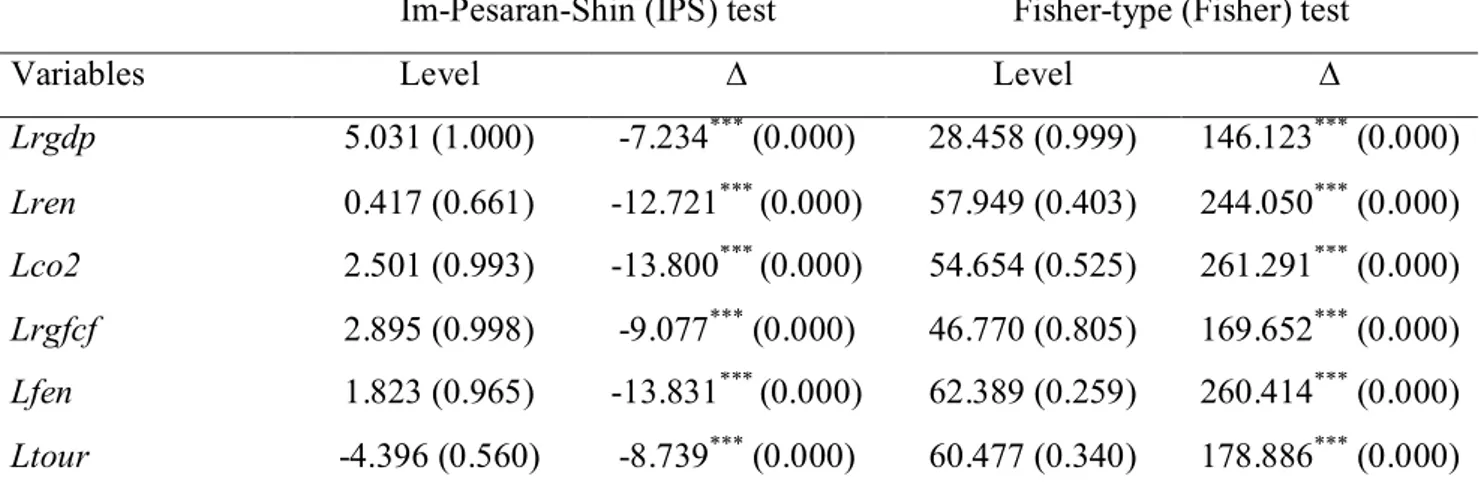
Panel unit tests as proposed by Choi (2001) and Im et al. (2003) are reported in Table-4. From the results, we find that the key variables are non-stationary at levels, but stationary at first difference. Thus, we conclude that the variables are integrated at first order, i.e. I(1). The stationarity or integration order of our variables necessitate further cointegration test on the basis of consistency of the regressors. This is done to complement the ARDL test of cointegration. The panel cointegration test proposed by Pedroni (2004) with the null hypothesis of no cointegration in heterogeneous panels and long-run coefficients estimate is used as sensitivity or robustness check. The cointegrating vectors are estimated using Fully Modified Ordinary Least Square (FMOLS) estimation approach for heterogeneous cointegrated panel as advanced by Pedroni (2001). This approach allows efficient and consistent estimation of cointegration vectors. It also addresses any problem arising from the endogenous nature of regressors and clearly spells out the time-series properties of the variable in terms of integration and cointegration properties.
Table 4: Panel unit root test results
Im-Pesaran-Shin (IPS) test Fisher-type (Fisher) test
Variables Level ∆ Level ∆
Lrgdp 5.031 (1.000) -7.234*** (0.000) 28.458 (0.999) 146.123*** (0.000) Lren 0.417 (0.661) -12.721*** (0.000) 57.949 (0.403) 244.050*** (0.000) Lco2 2.501 (0.993) -13.800*** (0.000) 54.654 (0.525) 261.291*** (0.000) Lrgfcf 2.895 (0.998) -9.077*** (0.000) 46.770 (0.805) 169.652*** (0.000) Lfen 1.823 (0.965) -13.831*** (0.000) 62.389 (0.259) 260.414*** (0.000) Ltour -4.396 (0.560) -8.739*** (0.000) 60.477 (0.340) 178.886*** (0.000)
Note: Variables are in their natural logarithm and stationary at *** 0.001 significant level.
The cointegration test results reported in Tables-5 and 6 confirm the existence of a long-run cointegration equilibrium relationship between the variables of interest at 1% significance level.
Table 5: Panel cointegration test
Weighted Coefficients Prob. Coefficients Prob. Alternative hypothesis: common AR coefs. (within-dimension)
Panel rho-Statistic 3.789*** 0.999 4.115*** 1.000 Panel PP-Statistic -6.439*** 0.000 -5.792*** 0.000 Panel ADF-Statistic -6.083*** 0.000 -5.592*** 0.000 Alternative hypothesis: individual AR coefs. (between-dimension)
Group rho-Statistic 5.817*** 1.000 Group PP-Statistic -9.571*** 0.000 Group ADF-Statistic -7.113*** 0.000
Note: Null hypothesis is specified under no cointegration vector. The table shows Pedroni (2004) residual cointegration tests. The test presume deterministic intercept and trend. Automatic lag length selection based on Schwarz Information Criteria (SIC) with lags between 0 and 2. Newey-West automatic bandwidth selection and Barlett kernel.
It is possible to conduct the selected ARDL specification by rewriting equation-3 into the error correction model (ECM) as follows:
1 * 1 * , , 1 , 1 , , 0 , , , lnRGDPi t ilnRGDPi t iZi t pj i j lnRGDPi t j qj i j Zi t j i t
(4) Where,, 1 1 p i i j j
, , , 0 0 , 1 1 q q i j i j j j i p i i j j
, *, , 1 p i j i d d j
and *, , 1 q i j i d d j
The former part of equation-4, i(lnRGDPi t, 1 iZi t, ), represents the speed of adjustment in the level of growth to deviation from the long-run equilibrium level with the independent variables, while the latter part represents the short-run dynamics of economic growth. The vector parameter
i
is the coefficient of the independent variables in estimating the long-run growth, while the parameter coefficient i captures the error-correcting speed of adjustment term. Meanwhile, if the error-correcting speed of adjustment term is less than zero
i 0
, the growth model provides evidence in support of a long-run relationship between lnRGDPi t, and the explanatoryvariables (determinants of dependent variables). The larger the absolute value of the speed of adjustment (i), the faster the rate of convergence of the model from the deviation path in the short-run towards the long-run equilibrium path, and vice versa. On the other hand, if the error-correcting speed of adjustment term is greater than or equal to zero
i 0
, this indicates the absence of stable linkage between the dependent variable and its determinants in the long-run. Thus, in order to achieve the study objective, the long-run coefficients
and the speed of iadjustment
parameter estimates are the main attractions in our empirical estimation. iIn applying ARDL models, pq1is mostly specified. This model specification is mostly used in literature that employ ARDL frameworks to carry out empirical investigations (see Bassanini and Scarpetta, 2002; Martı́ nez-Zarzoso and Bengochea-Morancho, 2004; Frank, 2009; Xing, 2012). Our study also suggests a model withpq1. Therefore, we can derive the equation below by presuming ARDL (1, 1) in equation-4:
, , 1 ,0 , ,1 , 1 ,
Thus, we can now reformulate equation-5 in the following error correction model (ECM):
, , 1 0.1 , ,1 . , lnRGDPi t i lnRGDPi t iZi t i Zi t i t (6) Wherei
1i
, ,0 ,1 i i i i and 0, i i i In order to estimate equation-6, the following estimators are employed: the Mean Group (MG) estimator, the Pooled Mean Group (PMG) estimator and the Dynamic Fixed-Effect (DFE) estimator. The MG estimator remains consistent when both N and T are large, it also does not enforce restrictions. The MG estimator is however reactive to outliers and sample size, especially when time dimension (T) is small, even when cross-section ( N ) is significantly large (Blackburne and Frank, 2007). As for the DFE estimator, it presumes homogeneity, in both the short-run and long-run coefficients across cross-sections, while excluding the constant term (intercept). The PMG estimator as advanced by Pesaran et al. (1999) is a comparative estimator between MG and DFE estimators. The PMG estimator suggests that the long-run coefficients
are homogeneous, it however allows other slope coefficients to vary across cross-sections. iThe PMG estimator becomes inconsistent when the heterogeneity assumption of the long-run slope coefficient is verifiable. The PMG estimator becomes more robust, consistent and efficient compared to the MG estimator whenever the homogeneity assumption holds. According to Pesaran and Smith (1995), the Pooled Mean Group (PMG) estimator and the Dynamic Fixed-Effect (DFE) estimator exhibit some complementary characteristics. Pesaran et al. (1999) states that the PMG estimator is robust and more reliable to lag orders and outliers. The most appropriate of these estimators is selected via Hausman tests.
3.2.2 Panel Granger causality test approach
We apply the Dumitrescu and Hurlin (2012) Granger causality test for heterogeneous non-causality. This test is applicable when T is larger than N, and vice versa. It is built on vector autoregressive model (VAR) and robust even in the presence of cross-sectional dependency. Two distinct distributions are present in this test—the asymptotic and the semi-asymptotic. The asymptotic distribution is employed when T is larger than N, and the semi-asymptotic distribution when N is larger than T. The linear model specification is as follows:
yit i(k ) k1 K
yi ,tk i(k ) k1 K
xi ,tki ,t (7)Where K depicts the lag length, ( )k i
is the autoregressive parameter, while ( )k i
represents the regression coefficient which is allowed to vary within the groups. The causality test is normally distributed and allows for heterogeneity. Homogenous non-stationary hypothesis (HNC) is used to estimate causal relationship with heterogeneous models. Under the test, the null and alternative hypotheses for HNC are specified as follows:
0: i 0 H i 1,...N 1: i 0 H i 1,...N1 0 i i N11,N12,....N
Where N1 represents the unknown parameter, which satisfies the condition
0 £ N
1/ N 1
. In any situation, the ratio of N1/N should be inevitably less than 1. IfN1N, it implies no causality across cross-sections. This indicates a failure to reject the null of HNC. However, ifN 1 0, it shows a causal nexus in the macro panel5.4. Empirical Results and Discussion
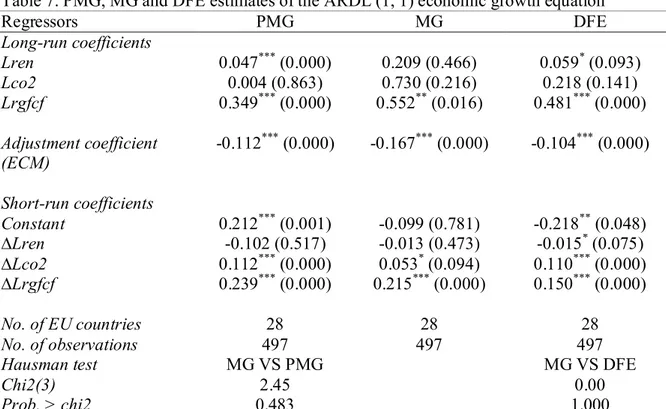
Given that the macro panel data share common integration properties, i.e. I(1), coupled with the fact that the existence of a long-run cointegration relationship between the variables has been confirmed at 1% level of significance (Tables-4, 5 and 6), we proceed with empirical estimations. Table-7 shows the PMG, MG and DFE estimation outcomes for equation-6, which are the study’s main estimation results. We present the long-run coefficients, the speed of adjustment coefficient and the short-run coefficients for each method. The first row of Table-7 shows that the long-run coefficients of renewable energy consumption are positive and statistically significant at 1% and 10% levels in the PMG and DFE estimations, but statistically insignificant in the MG estimation. To determine the most appropriate estimation result for the long-run nexus between economic growth and renewable energy consumption, pairwise
5
For brevity, we did not discuss the panel causality techniques in detail. For more information on the approach, interested reader should see Dumitrescu, E. I., & Hurlin, C. (2012). Testing for Granger non-causality in heterogeneous panels. Economic Modelling, 29(4), 1450-1460.
comparisons are carried out, first between the MG and PMG estimators, and then between the MG and DFE estimators. These comparisons are conducted with the aid of Hausman tests that estimate the supplementary homogeneity restrictions enforced by the PMG and DFE estimators relative to the MG estimator respectively.
Table 6: Regression for FMOLS model
Variables/Models lRGDP = ƒ (lren2. lco2, lrgfcg, lfen, lta)
Lren 0.043*** (2.718) Lco2 0.037 (0.580) Lgfcf 0.487*** (20.298) Lfen -0.068 (-0.710) Lta 0.102*** (3.865) N 497
Long run variance 0.009
Note: variables are all significant at 0.01 percent level while t-statistics values are in ().
As discussed earlier, the PMG and DFE estimators are more efficient and consistent than the MG estimator, under the null hypothesis that homogeneity restrictions hold. The Hausman test statistics are reported in Table-7, it is 2.45 with a corresponding probability value of 0.483 when MG and PMG estimators are compared, and 0.00 with a corresponding probability value of 1.000 when the MG and DFE estimators are compared. Based on the Hausman test results, since we could not reject the null hypothesis in both cases, we conclude that the PMG and DFE estimators are more efficient and suitable than the MG estimator. Consequently, since the PMG and DFE have been taken as the preferred model specifications, then the results reported in Table-7 show that renewable energy consumption has a positive and statistically significant long-run impact on the economic growth of the EU-28 countries. The Hausman test results also suggest that regardless of the disparities in several characteristics among EU countries (for instance, environmental resources, climate change, economic policies, developmental levels, GDP per capita, etc), the proposition of slope homogeneity across EU countries cannot be statistically rejected. Simply put, the EU countries appear to display common long-run relationships between renewable energy consumption, economic growth and other determinants. The above-mentioned advantages of the PMG and DFE models is an indication that equally informs on the appropriateness of the Autoregressive Distributed Lag (ARDL). The ARDL is considered appropriate because it models variables with either I (0) or I (1) or both. Also, the
model suitably provides state-wide cross-sectional short-run information in addition to the panel long-run and short-run estimates.
In addition, the estimated speed of adjustment coefficient reported in Table-7 is negative and statistically significant at 1% level across all estimations. This indicates convergence and existence of a long-run equilibrium relationship between renewable energy consumption and economic growth. Out of the three estimates of the short-run speed of adjustment coefficients, we discover that the DFE adjustment coefficient of -0.104 is the lowest, followed by the PMG adjustment coefficient of -0.112 and the MG with the highest adjustment coefficient of -0.167. These results indicate that a deviation from the long-run equilibrium level of real GDP in a year is corrected by 0.10% to 0.11% annually. Moreover, a significant adjustment coefficient confirms the existence of a stable long-run equilibrium relationship between economic growth and its determinants. For the record, our speed of adjustment coefficients from the PMG, MG and DFE estimators are not quite different in absolute values when compared to the estimates in Apergis and Payne (2010b) which ranges between 0.11% and 0.14%. This indicates that the speed of adjustment or convergence towards the long-run renewable energy-economic growth relationship among the EU countries is similar to that of the Eurasian countries.
Table 7: PMG, MG and DFE estimates of the ARDL (1, 1) economic growth equation Regressors PMG MG DFE Long-run coefficients Lren 0.047*** (0.000) 0.209 (0.466) 0.059* (0.093) Lco2 0.004 (0.863) 0.730 (0.216) 0.218 (0.141) Lrgfcf 0.349*** (0.000) 0.552** (0.016) 0.481*** (0.000) Adjustment coefficient (ECM) -0.112*** (0.000) -0.167*** (0.000) -0.104*** (0.000) Short-run coefficients Constant 0.212*** (0.001) -0.099 (0.781) -0.218** (0.048) ∆Lren -0.102 (0.517) -0.013 (0.473) -0.015* (0.075) ∆Lco2 0.112*** (0.000) 0.053* (0.094) 0.110*** (0.000) ∆Lrgfcf 0.239*** (0.000) 0.215*** (0.000) 0.150*** (0.000) No. of EU countries 28 28 28 No. of observations 497 497 497
Hausman test MG VS PMG MG VS DFE
Chi2(3) 2.45 0.00
Prob. > chi2 0.483 1.000
Note: The number of observations drops from 532 to 497 since the first order lag of the dependent variable is included in the right-hand side of the economic growth equation specified in equation (4). P-values are in (). Variables are significant at *** (p < 0.01), ** (p < 0.05 and * (p < 0.10) levels respectively.
A quantitative evaluation of the renewable energy-economic growth relationship on the basis of the superior PMG and DFE estimation techniques shows that 1% increase in renewable energy consumption will increase economic growth by 0.047% and 0.059% in the long-run, with no significant impact in the short-run. These are negligible effects, especially when compared with the value of 0.195% reported for Eurasia by Apergis and Payne (2010b). This type of comparison indicates that the renewable energy-economic growth relationship can indeed differ across various economies. Other results presented in Table-7 for the long-run are the coefficients for real gross fixed capital formation which are positive and statistically significant at 1% level of significance in both models. This affirms the crucial role real gross fixed capital formation plays in the growth of EU countries. This is consistent with the finding of Apergis and Payne (2010b) who obtained a coefficient value of 0.225% in their estimation of the impact of real gross fixed capital formation on the growth of Eurasian countries. Real gross fixed capital formation seems to play a more significant role in the long-run (0.349% and 0.481%) and in the short-run (0.239% and 0.150%) in both the PMG and DFE growth models for the EU than it
does in the models for Eurasian countries. The coefficient of carbon emissions is positive but insignificant in the long-run, it is however positive and statistically significant in the short-run in all the estimations at 1% and 10% levels, while carbon emissions appear not to have a significant impact on growth in the case of EU-28 countries in the long-run.
4.1 Robustness test: estimation based on alternative energy measure and tourism
To further examine the role played by renewable energy consumption in the EU-28 countries, we employ an alternative form of energy and also introduce tourism which is a significant contributor to economic growth within the region (see Lee and Brahmasrene, 2013). We re-estimate equation-6 by including natural log of fossil fuel (lnFEN ) and natural log of tourism (i t,
,
lnTOURi t) in the growth model simultaneously. The estimation results for the PMG and DFE
estimators are shown in Table-8. Table-8 reveals that across the PMG results in columns (1) – (2) and the DFE result in column (3), the estimated long-run equilibrium coefficient of renewable energy consumption remains positive and statistically significant at 1%, 5% and 10% levels respectively. However, only real gross fixed capital formation consistently reports significant positive coefficients across both the PMG and DFE models, irrespective of whether the additional variables are included or not. Carbon emissions become significant at 1% level for the PMG estimation in column (2) in the long-run, and still maintain a significantly positive impact in the short-run at 1% level across the PMG and DFE estimations. However, the estimated speed of adjustment coefficients remain quantitatively related and consistent with the results reported in Table-7. The estimation results suggest that the significant positive impact of carbon emissions on growth in the long-run shown in Table-8 basically originates from the inclusion of fossil fuel (though not significant in the short-run) and tourism in the growth model. Tourism has been reported to play significant role in carbon emissions growth in the EU countries. These results are in accordance with the findings of Lee and Brahmasrene (2013).
Table-6 reports possible long-run equilibrium robustness check. We estimate cointegrating vectors using Fully Modified Ordinary Least Square (FMOLS) estimation approach for heterogeneous cointegrated panel as advanced by Pedroni (2001). This approach allows efficient and consistent estimation of cointegrating vectors. In addition, it maintains consistency of the
long-run relations and accounts for endogeneity of regressors problem, and takes the time-series properties of the variables into consideration in terms of integration and cointegration properties. Table 8: Robustness test with fossil fuel and tourism for PMG and DE estimations of the ARDL (1, 1) economic growth equation.
Regressors PMG DFE (1) (2) (3) (4) Long-run coefficients Lren 0.047*** (0.000) 0.038** (0.014) 0.059* (0.093) 0.044 (0.200) Lco2 0.004 (0.863) 0.564*** (0.000) 0.218 (0.141) 0.209 (0.170) Lrgfcf 0.349*** (0.000) 0.221*** (0.000) 0.481*** (0.000) 0.444*** (0.000) Lfen 0.340*** (0.000) 0.351 (0.140) Lta 0.331*** (0.000) 0.112** (0.000) Adjustment coefficient (ECM) -0.112*** (0.000) -0.113*** (0.000) -0.104*** (0.000) -0.106*** (0.000) Short-run coefficients Constant 0.212*** (0.001) -0.315*** (0.000) -0.218** (0.048) -0.469*** (0.000) ∆Lren -0.102 (0.517) -0.009 (0.654) -0.015* (0.075) -0.015* (0.059) ∆Lco2 0.112*** (0.000) 0.093*** (0.000) 0.110*** (0.000) 0.109*** (0.000) ∆Lrgfcf 0.239*** (0.000) 0.217*** (0.000) 0.150*** (0.000) 0.139*** (0.000) Lfenergy -0.276 (0.000) -0.380 (0.383) Lta 0.054*** (0.000) 0.047*** (0.000) No. of EU countries 28 28 28 28 No. of observations 497 497 497 497
Note: The number of observations drops from 532 to 497 since the first order lag of the dependent variable is included in the right-hand side of the economic growth equation specified in equation (4). P-values are in (). Variables are significant at *** (p < 0.01), ** (p < 0.05 and * (p < 0.10) levels respectively.
4.2 Granger causality results
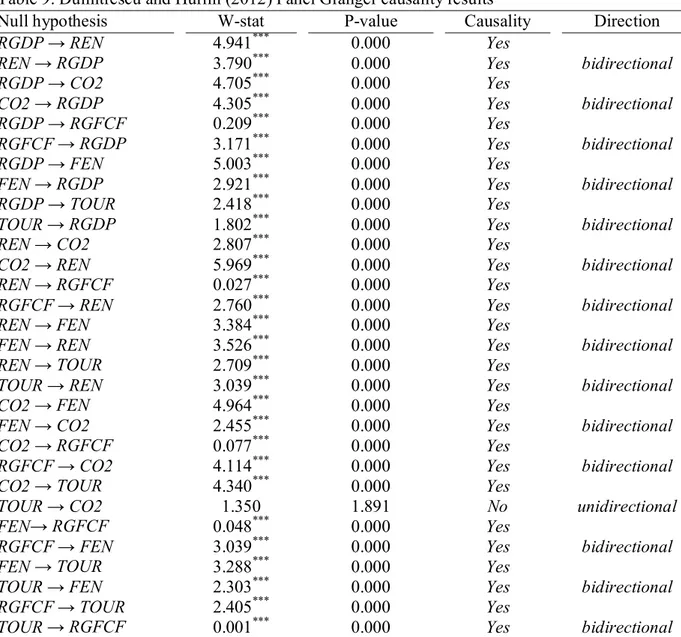
To complement the ARDL estimation results, Granger causality tests are conducted using the Dumitrescu and Hurlin (2012) approach, and the results reported in Table-9. The statistical
significance of the Wald statistic signifies the following; a bidirectional causal relationship between real GDP and renewable energy consumption (Apergis and Payne, 2010b), a bidirectional causal relationship between real GDP and real gross fixed capital formation (Apergis and Payne, 2010a), a bidirectional causal relationship between real GDP and carbon emissions (Ang, 2007; Halicioglu, 2009), a bidirectional causal relationship between real GDP and tourism and fossil fuel (Katircioglu, Feridun and Kilinc, 2014; Tugcu, 2014). The bidirectional causality indicates a long-run interdependence between real GDP and renewable energy consumption and other growth determinants in the EU-28 countries. This is in sharp contrast to the findings of Menegaki (2011) which claims that there is no causal relationship between renewable energy consumption and economic growth in Europe and concludes that the neutrality assumption holds true in the region. Our findings provide evidence in support of unidirectional causality between tourism and carbon emissions.
Table 9: Dumitrescu and Hurlin (2012) Panel Granger causality results
Null hypothesis W-stat P-value Causality Direction
RGDP → REN 4.941*** 0.000 Yes REN → RGDP RGDP → CO2 CO2 → RGDP RGDP → RGFCF RGFCF → RGDP RGDP → FEN FEN → RGDP RGDP → TOUR TOUR → RGDP REN → CO2 CO2 → REN REN → RGFCF RGFCF → REN REN → FEN FEN → REN REN → TOUR TOUR → REN CO2 → FEN FEN → CO2 CO2 → RGFCF RGFCF → CO2 CO2 → TOUR TOUR → CO2 FEN→ RGFCF RGFCF → FEN FEN → TOUR TOUR → FEN RGFCF → TOUR TOUR → RGFCF 3.790*** 4.705*** 4.305*** 0.209*** 3.171*** 5.003*** 2.921*** 2.418*** 1.802*** 2.807*** 5.969*** 0.027*** 2.760*** 3.384*** 3.526*** 2.709*** 3.039*** 4.964*** 2.455*** 0.077*** 4.114*** 4.340*** 1.350 0.048*** 3.039*** 3.288*** 2.303*** 2.405*** 0.001*** 0.000 0.000 0.000 0.000 0.000 0.000 0.000 0.000 0.000 0.000 0.000 0.000 0.000 0.000 0.000 0.000 0.000 0.000 0.000 0.000 0.000 0.000 1.891 0.000 0.000 0.000 0.000 0.000 0.000 Yes Yes Yes Yes Yes Yes Yes Yes Yes Yes Yes Yes Yes Yes Yes Yes Yes Yes Yes Yes Yes Yes No Yes Yes Yes Yes Yes Yes bidirectional bidirectional bidirectional bidirectional bidirectional bidirectional bidirectional bidirectional bidirectional bidirectional bidirectional unidirectional bidirectional bidirectional bidirectional
Note: the notation ≠>for null hypothesis implies that the variables does not Granger cause one another, against its alternative hypothesis that, the variables Granger-cause one another for at least one panel-var (id).
5. Conclusion and Policy Implications
This study examines the long-run relationship between renewable energy consumption and economic growth for a panel of 28 European Union (EU-28) countries over the period 1995-2015. The study also investigates the environmental impact of carbon emissions mitigation in attaining a sustainable economic growth. By evaluating the error correction model of an autoregressive distributed lag (ARDL) dynamic panel framework, the study finds significant positive long-run equilibrium relationship between renewable energy consumption and economic
growth in the EU-28 countries. This finding is consistent and robust in terms of model specifications, estimation techniques and choice of variables. Furthermore, by comparing our results to those obtained by Apergis and Payne (2010b), the following observations are made; first, Eurasian countries, with regards to renewable energy, are converging faster towards the long-run equilibrium growth path than the European Union countries. Second, the positive impact of renewable energy on economic growth is greater for Eurasian countries than it is for the EU-28 countries. Third, the positive impact of real gross fixed capital formation is greater for the EU-28 countries than it is for Eurasian countries. In addition, carbon emissions only impact on growth in the long-run when fossil fuel and tourism are added to the growth equation. This justifies the fossil fuel and tourism on the growth impact of carbon emissions. Finally, we find that tourism plays a significant and consistent role in enhancing the economic growth of the EU-28 countries. The bidirectional causal relationship between renewable energy consumption and economic growth provides evidence in support of a feedback hypothesis. The evidence in support of a bidirectional causal relationship between renewable energy consumption and economic growth is consistent with the study by Sadorsky (2009a) for the G7 countries and Apergis and Payne (2009a, 2010b) for Central America and Eurasia, but in sharp contrast with that of Menegaki (2011) for Europe.
From the results, we infer that increase in the use of renewable energy would discourage fossil fuel consumption and thereby mitigate carbon emissions. Thus, governments and policymakers in the EU region must put in place suitable economic and energy policies that would urge marketability and development of renewable energy towards achieving environmental sustainability of the region. As posited by Apergis and Payne (2010a), subsidies and/or tax credits on renewable energy production and consumption, introduction of renewable energy portfolio principles among others could serve as useful policy tools. Interestingly, the result of the current study is in line with the recently adopted and revised energy transition and efficiency policies of the EU (European Commission, 2019). Hence, this study further urge for a proactive implementation of the Renewable Energy Directive (EU) 2018/2001, Energy Efficiency Directive (EU) 2018/2002, Governance Regulation (EU) 2018/1999, and the Energy Performance of Building Directive. The implementation of the aforementioned regulations across the bloc EU states will not only drive the sustainable energy efficiency goals, it hopes to
significantly aids job creations, improve health, providing platforms for innovations and thus largely driving the sustainable development goals (SDGs) 2030. From the global perspective, the adoption of corporate mechanism especially toward optimizing the use of renewable energy for economic growth stimulation and sustainability is encouraged. In doing so, the global drive toward attaining the SDGs by 2030 will become realizable rather than remain a mere aspiration.
References
Akadiri, S. S., Lasisi, T. T., Uzuner, G., & Akadiri, A. C. (2019). Examining the impact of globalization in the environmental Kuznets curve hypothesis: the case of tourist destination states. Environmental science and pollution research international.
Akadiri, A. C., Saint Akadiri, S., & Gungor, H. (2019). The role of natural gas consumption in Saudi Arabia's output and its implication for trade and environmental quality. Energy Policy, 129, 230-238.
Alola, A. A. (2019a). Carbon emissions and the trilemma of trade policy, migration policy and health care in the US. Carbon Management, 1-10.
Alola, A. A. (2019b). The trilemma of trade, monetary and immigration policies in the United States: Accounting for environmental sustainability. Science of The Total
Environment, 658, 260-267.
Alola, A. A., Yalçiner, K., Alola, U. V., & Saint Akadiri, S. (2019). The role of renewable energy, immigration and real income in environmental sustainability target. Evidence from Europe largest states. Science of The Total Environment.
Alola, A. A., & Alola, U. V. (2018). Agricultural land usage and tourism impact on renewable energy consumption among Coastline Mediterranean Countries. Energy &
Environment, 29(8), 1438-1454.
Ang, J. B. (2007). CO2 emissions, energy consumption, and output in France. Energy Policy, 35(10), 4772-4778.
Apergis, N. and Payne, J. E. (2009a). Energy consumption and economic growth in Central America: evidence from a panel cointegration and error correction model. Energy
Apergis, N. and Payne, J. E. (2009b). Energy consumption and economic growth: evidence from the Commonwealth of Independent States. Energy Economics, 31(5), 641-647.
Apergis, N. and Payne, J. E. (2010a). Renewable energy consumption and economic growth: evidence from a panel of OECD countries. Energy policy, 38(1), 656-660.
Apergis, N. and Payne, J. E. (2010b). Renewable energy consumption and growth in Eurasia. Energy Economics, 32.6(2010): 1392-1397.
Apergis, N., Payne, J. E., Menyah, K. and Wolde-Rufael, Y. (2010). On the causal dynamics between emissions, nuclear energy, renewable energy, and economic growth. Ecological
Economics, 69(11), 2255-2260.
Asafu-Adjaye, J. (2000). The relationship between energy consumption, energy prices and economic growth: time series evidence from Asian developing countries. Energy
economics, 22(6), 615-625.
Atasoy, B. S. (2017). Testing the environmental Kuznets curve hypothesis across the US: Evidence from panel mean group estimators. Renewable and Sustainable Energy
Reviews, 77, 731-747.
Bartleet, M. and Gounder, R. (2010). Energy consumption and economic growth in New
Zealand: Results of trivariate and multivariate models. Energy Policy, 38(7), 3508-3517. Bassanini, A. and Scarpetta, S. (2002). Does human capital matter for growth in OECD
countries? A pooled mean-group approach. Economics letters, 74(3), 399-405.
Bekun, F. V., Alola, A. A., & Sarkodie, S. A. (2019). Toward a sustainable environment: Nexus between CO2 emissions, resource rent, renewable and nonrenewable energy in 16-EU countries. Science of The Total Environment, 657, 1023-1029.
Bekun, F. V., Emir, F., & Sarkodie, S. A. (2019). Another look at the relationship between energy consumption, carbon dioxide emissions, and economic growth in South Africa. Science of The Total Environment, 655, 759-765.
Blackburne, E. F. and Frank, M. W. (2007). Estimation of nonstationary heterogeneous panels. Stata Journal, 7(2), 197.
Bowden, N. and Payne, J. E. (2010). Sectoral analysis of the causal relationship between renewable and non-renewable energy consumption and real output in the US. Energy
Choi, I. (2001). Unit root tests for panel data. Journal of international money and
Finance, 20(2), 249-272.
Dogan, E. and Aslan, A. (2017). Exploring the relationship among CO2 emissions, real GDP,
energy consumption and tourism in the EU and candidate countries: Evidence from panel models robust to heterogeneity and cross-sectional dependence. Renewable and
Sustainable Energy Reviews, 77, 239-245.
Dumitrescu, E. I. and Hurlin, C. (2012). Testing for Granger non-causality in heterogeneous panels. Economic Modelling, 29(4), 1450-1460.
Emir, F., & Bekun, F. V. (2018). Energy intensity, carbon emissions, renewable energy, and economic growth nexus: new insights from Romania. Energy & Environment, 0958305X18793108.
European Commission. (2016). EU’s progress report. Implementing the Paris Agreement Progress of the EU towards the at least -40% target.
https://ec.europa.eu/clima/policies/strategies/progress_en.
European Commission. (2019). New Renewables, Energy Efficiency and Government
Legislation comes into force on 24 December 2018. https://ec.europa.eu/info/news/new- renewables-energy-efficiency-and-governance-legislation-comes-force-24-december-2018-2018-dec-21_en.
European Environmental Agency. (2017). Recent growth and knock-on effects. No. 3(2017). https://www.eea.europa.eu/publications/renewable-energy-in-europe-2017.
European Environmental Agency. (2018). https://www.eea.europa.eu/themes/energy.
Ewing, B. T., Sari, R. and Soytas, U. (2007). Disaggregate energy consumption and industrial output in the United States. Energy Policy, 35(2), 1274-1281.
Frank, M. W. (2009). Inequality and growth in the United States: Evidence from a new state‐ level panel of income inequality measures. Economic Inquiry, 47(1), 55-68.
Holtz-Eakin, D. and Selden, T. M. (1995). Stoking the fires? CO2 emissions and economic
growth. Journal of Public Economics, 57(1), 85-101.
Im, K. S., Pesaran, M. H. and Shin, Y. (2003). Testing for unit roots in heterogeneous panels. Journal of Econometrics, 115(1), 53-74.
Katircioglu, S. T., Feridun, M. and Kilinc, C. (2014). Estimating tourism-induced energy
consumption and CO2 emissions: the case of Cyprus. Renewable and Sustainable Energy Reviews, 29, 634-640.
Lee, J. W. and Brahmasrene, T. (2013). Investigating the influence of tourism on economic growth and carbon emissions: Evidence from panel analysis of the European
Union. Tourism Management, 38, 69-76.
Lin, B. and Moubarak, M. (2014). Renewable energy consumption–Economic growth nexus for China. Renewable and Sustainable Energy Reviews, 40, 111-117.
Mahadevan, R. and Asafu-Adjaye, J. (2007). Energy consumption, economic growth and prices: a reassessment using panel VECM for developed and developing countries. Energy
Policy, 35(4), 2481-2490.
Marques, A. C., Fuinhas, J. A. and Manso, J. P. (2010). Motivations driving renewable energy in European countries: A panel data approach. Energy policy, 38(11), 6877-6885.
Martı́ nez-Zarzoso, I. and Bengochea-Morancho, A. (2004). Pooled mean group estimation of an environmental Kuznets curve for CO2. Economics Letters, 82(1), 121-126.
Menegaki, A. N. (2011). Growth and renewable energy in Europe: a random effect model with evidence for neutrality hypothesis. Energy Economics, 33(2), 257-263.
Menyah, K. and Wolde-Rufael, Y. (2010). CO2 emissions, nuclear energy, renewable energy and
economic growth in the US. Energy Policy, 38(6), 2911-2915.
Ocal, O. and Aslan, A. (2013). Renewable energy consumption–economic growth nexus in Turkey. Renewable and Sustainable Energy Reviews, 28, 494-499.
Paramati, S. R., Mo, D. and Gupta, R. (2017). The effects of stock market growth and renewable energy use on CO2 emissions: Evidence from G20 countries. Energy Economics, 66,
360-371.
Payne, J. E. (2009). On the dynamics of energy consumption and output in the US. Applied
Energy, 86(4), 575-577.
Pedroni, P. (2001). Fully modified OLS for heterogeneous cointegrated panels. In Nonstationary
panels, panel cointegration, and dynamic panels (pp. 93-130). Emerald Group Publishing
Limited.
Pedroni, P. (2004). Panel cointegration: asymptotic and finite sample properties of pooled time series tests with an application to the PPP hypothesis. Econometric theory, 20(3), 597-625.
Pesaran, M. H. and Smith, R. (1995). Estimating long-run relationships from dynamic heterogeneous panels. Journal of econometrics, 68(1), 79-113.
Pesaran, M. H., Shin, Y. and Smith, R. P. (1999). Pooled mean group estimation of dynamic heterogeneous panels. Journal of the American Statistical Association, 94(446), 621-634. REN21 (2016). Renewables 2016 Global Status Report, Paris, REN21 Secretariat and
Washington, DC. World-watch Institute. http://www.ren21.net/about-ren21/annual-reports/.
Sadorsky, P. (2009a). Renewable energy consumption, CO2 emissions and oil prices in the G7
countries. Energy Economics, 31(3), 456-462.
Sadorsky, P. (2009b). Renewable energy consumption and income in emerging economies. Energy policy, 37(10), 4021-4028.
Saint Akadiri, S., Alkawfi, M. M., Uğural, S., & Akadiri, A. C. (2019). Towards achieving environmental sustainability target in Italy. The role of energy, real income and globalization. Science of The Total Environment.
Sari, R. and Soytas, U. (2004). Disaggregate energy consumption, employment and income in Turkey. Energy Economics, 26(3), 335-344.
Sari, R., Ewing, B. T. and Soytas, U. (2008). The relationship between disaggregate energy consumption and industrial production in the United States: an ARDL approach. Energy
Economics, 30(5), 2302-2313.
Shahbaz, M., Loganathan, N., Zeshan, M. and Zaman, K. (2015). Does renewable energy consumption add in economic growth? An application of auto-regressive distributed lag model in Pakistan. Renewable and Sustainable Energy Reviews, 44, 576-585..
Tugcu, C. T. (2014). Tourism and economic growth nexus revisited: A panel causality analysis for the case of the Mediterranean Region. Tourism Management, 42, 207-212.
Union, E. (2009). Directive 2009/28/EC of the European Parliament and of the Council of 23 April 2009 on the promotion of the use of energy from renewable sources and amending and subsequently repealing Directives 2001/77/EC and 2003/30/EC. Official Journal of
the European Union, 5, 2009.
World Economic Forum. (2017). https://www.weforum.org/agenda/2017/04/who-s-the-best-in-europe-when-it-comes-to-renewable-energy/.
World Energy Resource. (2016). World Energy council. https://www.worldenergy.org/wp-content/uploads/2016/10/World-Energy-Resources-Full-report-2016.10.03.pdf
Xing, J. (2012). Tax structure and growth: How robust is the empirical evidence? Economics