. i p ¡ ; r : í r , j i ^ ' . .; .■., . . . 2 . . I C . U ' U . ч - J ч. U· J i ; ¿ .· · //& ■
570é-5
-J:88
0 3 8/936
PRICE PERFORMANCE OF INITIAL PUBLIC OFFERINGS
IN ISTANBUL STOCK EXCHANGE
A THESIS
Submitted to the Faculty o f Management
and the Graduate School o f Business Administration
o f Bilkent University
in Partial Fulfillment o f the Requirements
For the Degree o f
Master o f Business Administration
By
Ibraliim Halil Öztop
I certify that I have read this thesis and in my opinion it is fully adequate, in scope and quality, as a thesis for the degree o f Master o f Business Administration.
/ >
'Assoc. P ro f Can §imgayMuga
I certify that I have read this thesis and in my opinion it is fully adequate, in scope and quality, as a thesis for the degree o f Master o f Business Administration.
Assoc. Prof Erdal Erel
I certify that I have read this thesis and in my opinion it is fully adequate, in scope and quality, as a thesis for the degree o f Master o f Business Administration.
Assistant. P ro f Zeynep Önder
Approved for the Graduate School o f Business Administration.
и (о
ъ
■ : п іо а г
i d s éß053783
ABSTIÍACT
PRICE PERFORMANCE OF INITIAL PUBLIC OFFERINGS IN ISTANBUL STOCK EXCHANGE
İBRAHİM HALİL ÖZTOP
M.B.A. Thesis
Supervisor: Assoc. Prof. Can Şımga Mugan
Tliis study aims at investigating the price behavior o f initial public offerings (IPOs) in Istanbul Stock Exchange (ISE) during 1994 and 1995 in the short- and medium-term. The study is also devoted to the structure, pricing methods, timing, advantages and disadvantages o f IPOs and the existing regulatory environment. The existence o f significant abnormal positive returns o f new issues on the first and fifth trading days is the proof o f underpricing. However, no significant excess returns are observed for the second and third week following the initial trading. The absence o f significant abnormal initial returns in the IPO market in ISE during the same period suggests that new issues follow the general market movement. On the first and third month after the initial trading, the IPOs are overpriced since there exist significant abnormal negative initial returns. The observed high variability on average returns indicates that there might be some stocks that are underpriced while there might be some stocks that are overpriced. Investors purchasing new issues at the initial offering earn positive abnormal returns in the early aftermarket period. IPOs are profitable investments in the short-term (until the fifth trading day), but perform quite poorly over longer periods (after the first month following the initial trading date).
ÖZET
İSTANBUL MENKUL KIYMETLER BORSA’SINDA HALKA AÇILAN ŞİRKETLERİN FİYAT PERFORMANSLARI
İBRAHİM HALİL ÖZTOP
M.B.A. Tezi
Tez Yöneticisi; Doç. Dr. Can Şımga Muğan
Bu çalışmanın amacı, 1994 ve 1995 yılında İstanbul Menkul Kıymetler Borsa’sında (İMKB) halka açılan şirketlerin kısa ve orta vadede fiyat davranışlarını araştırmaktır. Halka arzların yapısı, fiyatlandırma metodlan, zamanlaması, avantajları, dezavantajları ve mevcut yasal düzenlemeler de bu çalışmada incelenmiştir. Birinci ve beşinci işlem gününde yeni hisse senetlerindeki anormal pozitif getirilerin varlığı düşük fiyatlandırmanın kanıtıdır. Ancak, ikinci ve üçüncü haftada önemli sayılabilecek fazla bir getiri görülmemiştir. Bu dönemde önemli anormal ilk getirilerin olmayışı yeni hisselerin genel piyasa hareketini izlediğini göstermektedir. İlk işlem tarihinden bir ve üç ay sonra, önemli anormal negatif getirilerin mevcudiyetinden halka arz edilen şirketler yüksek fıyatlandırılmışlardır. Bazı hisselerin düşük veya yüksek fıyatlandırılabileceği, gözlemlenen yüksek sapmalardan anlaşılmaktadır. Yeni hisse senetlerini halka arz zamanında alan yatırımcılar ilk işlem gördüğü tarihlerde anormal pozitif getiri sağlamaktadır. Halka arzlar kısa vadede (ilk beş güne kadar) karlı bir yatırım iken, ancak orta dönemde kötü bir performans göstermektedir.
A B STR A C T... 1 Ö Z E T ... ii TABLE OF C O N T E N T S... iii LIST OF T A B L E S ...v I. IN TRO D U C TIO N ...1 II. BACKGROUND ON I P O ...3 II. 1. Definition... 3
II. 2. Advantages o f Going Public... 4
II. 3. Disadvantages o f Going Public... 5
II. 4. Structure... 7
II. 5. P ricin g ... 11
III. REGULATION OF IPOs IN T U R K E Y ... 14
IV. PREVIOUS RESEARCH ON I P O ... 19
V. DATA AND M ETHODOLOGY... 25
V. 1. Istanbul Stock Exchange... 25
V. 2. Data... 27
V. 3. M ethodology... 29
TABLE OF CONTENTS
VI. RESULTS... 32
VI. 1. Short-Term Price Behavior o f IPOs... 32
VI. 2. Medium-Term Price Behavior o f IP O s ...37
VII. CONCLUSION AND RECOMMENDATIONS... 40
R EFE R EN C ES... 42
APPENDICES... 44
LIST OF TABLES
Table 1 The performance o f IPOs on the first trading day following the offer...33
Table 2 The performance o f IPOs on the fifth trading day following the offer...34
Table 3 The performance o f IPOs on the tenth trading day following the offer...35
Table 4 The performance o f IPOs on the third week after the initial trading... 36
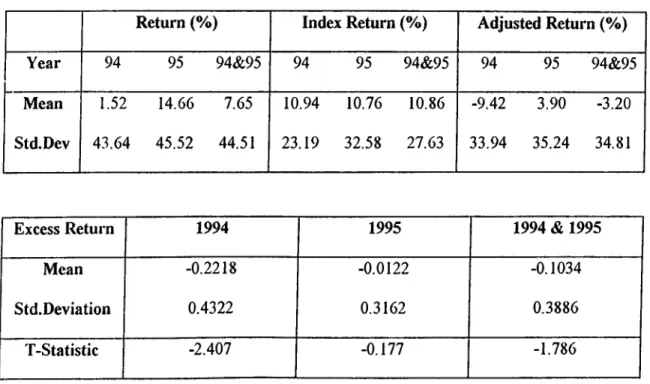
Table 5 The performance o f IPOs on the first month after the first trading day... 38
Most companies start up by raising equity capital from a small number o f investors, with no liquid market to accommodate those investors who wish to sell their stock later. If a company prospers and needs additional equity capital, it generally finds desirable to go public by selling stock to a large number o f diversified investors.
Going public refers to the change in status o f a private company that wants to access the public capital market. The decision to go public may be due to the need for capital, the prestige o f owning part o f a public company or the desire to set up a profitable exit from the company for major shareholders.
Historically, Turkish firms have relied on bank loans to finance their on-going operations. However, after the establishment o f Istanbul Stock Exchange (ISE) in 1985, companies began to use equity finance. The motives behind this preference o f the companies were high interest rates and insufficiency o f medium and long term credits in our country. Consequently, initial public offerings (IPOs) have become very popular. The sparkling performance o f ISE has provided a suitable environment for the launch o f new issues.
I. INTRODUCTION
In the initial public offering process, there exist three stakeholders: issuer (firm), investor, investment banker (underwriter). The cmcial point in the process is the pricing o f initial public offering. If the price is set too low, the issuer does not get the füll advantage o f its ability to raise capital. If the stock is priced too high, the investor will get an inferior return
and the oftering will not be successful. Investors, moreover, would be unwilling to purchase offering from an investment banker with a record o f overpriced offerings.
Many studies have been conducted on the IPO market from different perspectives. The documented studies in finance literature covered the short-run and long-run performance o f IPOs, the reasons o f the underpricing o f IPOs, underwriter price support, underwriter reputation and its impact on the ^pricing o f new issues, the choice o f the offering method in IPOs and the firm value.
In the light o f the available literature, this study aims at investigating the pricing o f the new issues in ISE. The purposes o f the study are to analyze the initial return characteristics o f IPOs in ISE, and to determine whether the new issues are underpriced or overpriced. The stocks that have been offered to the public during 1994 and 1995 constitute the sample o f this study. This study concentrates on short-term and medium-term price behavior o f IPOs in the days and weeks following the offer.
The paper is organized along the following lines. The following chapter presents the definition, advantages, disadvantages and structure o f initial public offerings. Chapter 3 is devoted to the recent IPOs in ISE, focusing on the various pricing methods employed and the existing regulatory environment. The documented studies in finance literature is presented in Chapter 4. In Chapter 5, data and methodology o f the study are discussed. The results o f the tests and concluding comments constitute Chapter 6 and the last chapter, respectively.
n . BACKGROUND ON IPO
IT. 1. Definition
The first public equity issue that is made by a company is referred to as an initial public offering (IPO). It is the first effort by private firms to raise capital in a equity market. From the financial point o f view, a firm’s ability to carry its operations in a healthy manner depends on its financial resource’s strength and composition. For a firm it is necessary to find additional funds to make investments and implement its capabilities. Although a firm is able to use bank loans, it must strengthen its equity base to provide a feasible and rational combination o f debt and equity. For this purpose, companies should increase their equity or find new shareholders. Publicly traded stocks have greater liquidity, which allow the companies to raise capital on more favorable terms than if it were privately held. Although there are different reasons behind the companies’ decision to issue new stocks, basically to strengthen financial base, to be protected from undesired economic conditions and growth are the main objectives.
The executives and shareholders o f the company considering going public should raise several questions before beginning the process. The alternatives to going public, the existence o f cheaper and faster ways to raise capital and the influence o f IPO on future performance o f the company are some issues that management should bear in mind. Management also must evaluate the advantages and disadvantages o f going public.
Financial stability from the raising of needed capital: When growth can no longer be financed internally or through borrowing, management will consider a public offering. Future capital requirements for manufacturing facilities, working capital, marketing efforts, acquisitions funded with cash, expanding into new industries or products, research and development are some expenses to consider when analyzing how much cash a company needs to raise. However, the planning process should start well before the capital is required, bearing in mind that an ottering will take at least six months.
A vailability of stock for acquisitions: Today mergers and acquisitions are very popular means o f corporate expansion often financed through an exchange o f stock. It is difficult to establish a fair market value for the shares being exchanged. The shares o f a public company are valuated by the market which makes this process simpler than private mergers and buyouts. Having publicly traded stock to offer allows companies and individuals who receive the stock to know they will have a profitable exit from the transaction, via a public market ready to accept their shares when they sell.
IT. 2. A d v a n ta g e s o f G o in g P u b lic
M eans of exiting for inside share holders: By going public, officers and directors and early shareholders have a way o f exiting from the company and knowing what they will get. It can be also realized as an employee compensation incentive. Stock options and other incentive programs help employees feel that they are part o f the organization and that they benefit beyond a paycheck for doing a good job. When employees see that there is a ready market available for their shares, the job becomes more attractive to them.
A dded prestige an d increased visibility for the com pany: Newspapers may carry news about important corporate events. Analysts may provide company information for brokers and investors who spread the word about the great things happening at the company. Suppliers and customers are eager to do business with public company because they assume public entities are more financially reliable.
Im proved borrow ing capability: The equity capital generated by an IPO improves the debt- equity ratio and enhances the company’s cash position. These two improvements are the key factors that the bankers love to see. The news about important corporate events and their reliable positions in the marketplace are the positive factors for the bankers in the evaluation o f the company.
F o u n d er diversification: As a company grows and becomes more valuable, its founders often have most o f their wealth tied up in the company. By selling some o f their stock in a public ofl'ering, they can diversify their holdings thereby reducing somewhat the riskiness o f their personal portfolios.
IL 3. D isadvantages of G oing Public
Closure of fu tu re financing from v en tu re capitalists: The offering process is the final step for venture capitalists as an exit from a company. An IPO is the incentive for them to be in the deal in the first place. Once a company has gone public, there is very little reason for a venture capitalist to become involved in the company.
New m anagem ent techniques: New management techniques may be required o f company ofticers to increase the stock price o f the company. New owners may want to determine how the company runs. If the company’s earnings or the stock price is not improving, shareholder approval may be difficult to get. Keeping stockholders, brokers and analysts informed also requires certain techniques. Management may want to retain a financial public relations firm to help fulfill disclosure requirements. It takes time and money to provide regular reports, press releases and other information that must be provided to the investors and regulators in order to keep them informed about their company.
Full disclosure o f personal and com pany skeletons: Complete and adequate disclosure is the primary focus o f Capital Markets Board (CMB). All details relating to the company, its officers, directors and major shareholders must be announced. If the company is relatively new and has a short track record, the risks inherent in investing in the company must be also detailed.
Expense of going public: There are many costs that management has to pay for application, disclosure, road shows to attorneys, auditors, printers, underwriters and regulatory agencies.
Possible loss of control: The stock market is going to indicate at what level the company’s stock compares to the stock price o f similar companies in the same industry. If the price is not high enough to raise the amount o f capital required, the size o f the offering may have to be increased. In this case, it is possible that the buying public shareholders could gain control such as changing the board o f directors and management.
O ngoing expense of being a public com pany: The cost o f remaining a public company is another expense that management should consider. The cost o f preparing periodic reports, the proper disclosure and reporting documents are some examples.
Inactive m ark et and low price: If the firm is very small and its shares are traded infrequently, its stock will not be liquid and the market price may not be representative o f expected value o f the stock.
II. 4. S tru ctu re
The goal o f the company must be to raise an adequate amount o f capital via the offering in the most effective way. One o f the considerations must be what is an appropriate means o f structuring the offering. There are two types o f going public: direct issue and indirect issue. In the first method, the company issue new stocks by itself The latter one is issue new stocks using an intermediary. The important ingredient to complete a successful offering is to use the right vehicle. For example, to do a straight stock offering may result in substantial ownership dilution, unacceptable to current stockholders.
There are two major components to the valuation process o f an IPO: the total amount o f money to be raised based on the capitalization and the per share price based on the market. The amount o f money to be raised through the offering should be determined considering the financial needs analysis o f the company together with investment banker. The selection o f the investment banker depends upon several factors such as: reputation in IPOs, expertise in the company’s particular industry, marketing strengths (including whether the bank will sell
primarily to institutional or retail customers), the quality o f post-public offering support, investment bank’s research analysts, market-making capabilities and strengths in other strategic areas (for example mergers and acquisitions). The company should also assess the underwriter’s level o f commitment to the deal and whether the underwriter has competitive offerings scheduled at the same time as the company’s offering is proposed.
In indirect issue, the other crucial point is the choice o f offering method. When a firm goes public with an initial equity offering, it has two options on how to issue the stock. Using an investment banker, the firm can issue stock to the public with either a firm-commitment (underwriting) or a best-efforts agreement. In the period from 1977 to 1982, Ritter (1987) found that for firms using investment bankers, 64.6% used firm-commitment offerings while 35.4% used best-efforts offerings. A third, but less frequently used, possibility is a direct offering without any use o f an investment banker. In both types o f offerings the investment banker distributes the new shares, but in a firm-commitment agreement he or she performs the additional function o f insuring the proceeds to the issuer. In addition, a firm-commitment agreement uses the reputational capital o f the investment banker to certify the value o f the issue to a greater degree than in best-efforts offering.
In Nancy L. Bower (1989), the offering method chosen affects both the firm’s cost o f obtaining capital and investors’ perceptions about a firm value. A partially pooling, partially separating equilibrium is found where high valued firms have information about their values revealed in a firm commitment offering, while low valued firms use best-efforts offerings and are unable to distinguish themselves from other firms. Firm-commitment offerings are more correctly valued by investors and one would expect to see a low variance o f returns across companies. The value o f a best-efforts offering, on the other hand, is in general incorrectly
perceived by investors. During the period following the offering, investors would be expected to learn more information about the firm and revise their price perceptions toward the actual value. The initial inaccurate pricing and revisions during the year will lead to greater variance in post-oflering returns for best-efforts offerings than for firm commitment offerings.
Once management has determined the amount o f capital to be raised, the question o f price per share takes on added significance since that will determine the number o f shares to be offered. The number o f shares offered impacts how much o f the company must be given up and possibly, who controls the company. The key during this part o f the process is how the company is valued and the importance o f that valuation to investors who may buy the offering. The price range o f the company’s stock is determined by negotiations between the company and the underwriters. It is important that the company discuss valuation at the earliest stages o f the offering, including as part o f the process o f selecting an investment bank. The valuation is prepared after the study o f current market conditions, past and projected financial performance, product or technology position, management team, potential for growth and new products in development. The underwriter obtains pricing comparisons by selecting several companies in the same industry that are closely related as possible to the offering company in revenues, earnings, total capitalization, length o f operating history and the product line to identify a range o f values.
The real key to successful pricing is for underwriter to get accurate and timely comparables. The comparables help set a pricing range, at the time o f actual pricing it is all supply and demand. Once those companies are identified and the stock prices tracked, the price the stock is trading at can be used as a benchmark for the pricing o f the offering. The factors considered by the underwriter when comparing the company with already public
companies are financial ratios, profit margins, amount and type o f debts, growth potential o f the company. Prior to writing the prospectus, part o f the registration statement filed with CMB which is the source o f disclosure o f all the negative and positive information about the company, a detailed analysis is done by the underwriter including: thorough review o f the industry, company’s history, investigation o f all products and services, a review o f company relationships with affiliated companies and subsidiary arrangements, review o f employment and management, financial statement analysis, projections for earnings, investments, strength and weaknesses o f the company, threat and opportunities in the sector.
Understanding the principles that will be applied and the comparable companies that will be considered will help the company better understand the variations in valuation. The company should also take an active role in identifying comparable companies in the industry. The underwriters and the company will agree on a range o f prices at the outset, which will be refined before filing, with the exact price o f the shares determined just prior to commencement o f the offering, based on the market and the reaction o f potential purchasers to the offering. The company and the underwriters will agree on the size o f the offering by taking into account the company’s capital needs, dilution to the existing stockholders, the level o f public ‘float’ desirable to achieve active trading market and liquidity for current stockholders, market receptivity and proposed price per share. Among these factors, creating liquid market for the stocks has a crucial place for the successful offering. Institutional investors, who have a tremendous impact on the market, like to see deep and active trading market for the stocks. If there are fewer shares, large investors concerned with any buy or sell orders will create large fluctuations in the price.
The ultimate responsibility for determining the timing o f an offering is with the company. Once the general scope o f the timing has been determined, the undew riters prepare a time and responsibility schedule indicating key dates in the process and assigning responsibilities for the various tasks that must be accomplished. The key to successful offering above the company considerations is market timing. It should be emphasized that timing the market influences how the stock is valued. This does not mean that a company cannot go public. A company can do a public offering at almost any time but at what price. Management must decide whether it is willing to accept the stock price the market dictates at any given time. Obviously when the market is hot, the stock will receive a more favorable valuation. A company in need for capital may not be in a position to wait for a down market to turn around. In some cases, even in a good market, particular industries are not in favor. Again this does not mean that a company in that industry can not raise money. The company will pay a penalty o f reduced capital raised or increase the number o f shares sold through an offering. Management and underwriter, after all paperwork and documentation has been done, can select the most suitable time for offering. To do so, they should watch overall stock market, the industry, selected public companies in the industry and their price actions.
II. 5. Pricing
The pricing o f IPOs is very difficult, because there is no observable market price prior to the offering and many o f the issuing firms may have little or no operating history. If the price is set too low, the issuer does not get the full advantage o f its ability to raise capital. If the stock is priced too high, the investor will get an inferior return and the offering will not be successful. Investors, moreover, would be unwilling to purchase offering from an investment banker with a record o f overpriced offerings.
There is no universally applicable mathematical formula which will give a precise quotient o f value. The uncertainty o f the company’s future performance within a changing economic/business environment, the lack o f precision with which one can pinpoint the realizable synergetic benefits and the impact o f human/psychological attitudes, create a wide area within which value o f the subject company may fall. It is necessary to draw low and high parameters o f value within which the stakeholders intend to execute their strategies. Forming the lower parameter will be the value o f the company in its existing form without any synergetic benefits arisen from the proposed offering. At the higher parameter, the strategic benefits formed by the offering will be taken into account and the optimistic environment will be assumed to exist. Within the lower and higher parameter range, the value o f the stock is determined considering the benefits o f stakeholders; issuer, investor and investment banker.
There are 3 commonly used valuation approaches, each with their own advantages and limitations: discounted cash-flow valuation, relative valuation and contingent-claim valuation.
The most intellectual and logical valuation method, discounted cash-flow valuation, is to project forward performance o f the company and to discount that future stream o f cashflow to a present value with an appropriate discount rate, then to subtract debts from the present value. In our country, the applicability o f this method is very difficult due to economic and business environments and discount rate.
In relative valuation, the value o f an asset is derived from the pricing o f comparable assets, standardized using a common variable such as earnings, cash flows, book value and sales. One illustration o f this approach is the use o f an industry-average price/earnings ratio to
value a firm assuming that the other firms in the industry are comparable to the firm being valued and the market on average price these firms, correctly. The other multiples in use are price/book value ratio, price/sales ratio, price/cash flows and price/dividends. In our countiy, the most common used method is relative valuation especially P/E multiple.
A contingent claim or option is an asset that pays off only under certain contingencies: if the value o f the underlying asset exceeds a prespecified value for a call option, or is less than a prespecified value for a put option. An asset can be valued as a call option if the payoffs on it are a function o f the value o f an underlying asset; if that value exceeds a prespecified level, the asset is worth difference; if not, it is worth nothing. It can be valued as a put option if it gains value as the value o f the underlying asset drops below a prespecified level and if it is worth nothing when the underlying asset’s value exceeds that specified level. This method is not widely used in both developed and emerging markets.
m.
REGULATION OF IPOs IN TURKEYIn 1981, a new Capital Markets Law was enacted which established the Capital Markets Board (CMB) as the main regulatory body with responsibility for supervision and regulation o f Turkish securities markets. The ISE was established in 1985 and commenced business in early 1986.
The principal function o f the CMB is to take such measures to foster the development o f the securities markets in Turkey, thereby contributing to the efficient allocation o f financial resources in the Turkish economy and ensuring adequate protection for investors. The CMB supervises and regulates among public companies, banks and other financial intermediaries, mutual funds, investment corporations, investment consultancy firms and audit firms which offer their services to institutions operating in the capital markets.
The CMB performs its regulatory role through the promulgation o f regulations defining the capital markets and the rules which participants in such markets are required to observe. The CMB regulations require that all securities publicly offered by issuers in Turkey be registered with the CMB. A prospectus filed with the CMB for registration must include such information as is necessary to enable a prospective investor to assess the merits o f the issuer and the proposed investment. The CMB may refuse registration in the event that the CMB is not satisfied with the level o f disclosure in the prospectus. The type and scope o f information
required to be disclosed to the public under the CMB regulations is considerably less detailed than disclosure requirements o f more developed securities markets such as the United States.
In connection with its supervisory role, the CMB requires companies which are subject to its jurisdiction prepare and publish balance sheets, income statements and annual reports, all o f which must be prepared in accordance with accounting principles and standards set forth by the CMB. These companies must hold its annual meeting o f shareholders within three months after the end o f its fiscal year and within one month thereafter file its balance sheet, income statement and annual report in respect o f the previous fiscal year, in a form audited by the CMB-approved auditors. In addition, unaudited quarterly reports must be filed in respect o f each financial period ending in March and September, and semi-annual report, subject to limited review o f the independent auditors, must be filed with the CMB in respect o f the first six months o f each year. In the event o f any special circumstance such as a merger or acquisition, the CMB may require that additional information be disclosed by a public company or directors or major shareholders o f a public company or other related parties in order to protect the interests o f small investors.
Capital Market Law defines first issue o f shares as going public. However, Turkish Capital Market Law has a very broad definition o f going public; besides issuing new shares it also includes arrangements for selling the shares in the definition. Consequently, this definition considers firm’s invitation o f public to buy the shares as going public.
Companies may issue new stocks either by themselves, called direct issue or use an intermediaiy, called indirect issue. Regulation considers issuing shares to the public, related arrangements, conducting financial analysis, industry analysis, preparing documents and
applying to the Board as intermediary activities. In indirect issue, the offering method is classified into two; firm-commitment (underwriting) and best-efforts. In a firm-commitment agreement, the firm can issue equity using an underwriter who determines the value o f the firm and certifies this value to investors for a fee. Thus a firm that employs underwriter has its value revealed, so the firm will get the planned amount o f money from the issue less the underwriter’s fee. In the best-efforts agreement, the investment banker does not guarantee that the stocks will be sold or that the company will get the cash it needs, only that it will put forth its best eflbrts to sell the issue. In this agreement, the underwriter fee is less than fee in the firm-commitment agreement so the company will save the remaining portion. There exist two ways o f equity issue in the firm-commitment agreement according to Turkish Capital Market Law : full underwriting and underwriting. In the first one, the value o f all shares offered to public must be fully paid to the firm in cash after public sales. There exists an upper limit for the financial responsibility in the firm-commitment agreement. By law, the underwriter can not guarantee more than two times o f the amount o f paid-in capital plus reserves o f the bank. In the latter method, the banker agrees to buy the remaining shares that can not be sold in the specified period and pay for these shares after the issue.
There are two ways o f initial public offering in Turkey:
a) Increase capital and sell the new issued shares to the public ( preemptive rights not used).
b) Sell the existing shares to the public (selling from the portfolio).
I
The information to be disclosed during the public offering o f shares shall be included in the prospectus. According to the type o f capital market instruments and going public, the Capital Market Board has determined the content o f the information to be included in the
prospectus. Information and documents determined by the CMB is attached to the application for registration to the board. The CMB observes the deficiencies in the documents and requires the documents to be completed. Before the registration o f the shares to the CMB, the prospectus shall not be delivered to the public or any other institutions. After the registration o f shares with the CMB, the prospectus shall be registered and announced at the official gazette. The prospectus requires companies to disclose; a description o f the company’s business, its properties, identification o f officers and directors, the plan for distributions o f securities, the last three-year’s financial statements. The prospectuses are not prepared as fill- in-the-blanks forms but similar to brochures. The financial statements in prospectuses must be audited by an independent external audit firm. In addition to the information required by the form, the issuer must also provide any other information necessary to make the statements complete and not misleading. The invitation to the public to buy the shares by means o f circular is determined by the CMB and published at official gazette. The announcement and explanations directed to the public may include neither wrong, exaggerated nor misleading information. The CMB may prohibit the advertisements which it considers misleading. The sale o f shares to the public shall be influenced within the context o f the principles and within the sales period set forth in prospectus. The CMB requires that selling from the portfolio should be made according to flill-commitment agreement. The issuer or the intermediary institutions must provide the registered prospectus to all purchasers. The sale o f shares may be performed in stock exchange or out o f stock exchange.
There are two ways o f selling methods in initial public offerings: book building and selling in the stock exchange. In the method o f book building, after all orders are gathered within the sales period, the distribution o f shares will be made by satisfying at least all investors if demand exceeds supply. In this method, there are two ways o f pricing: book building by
fixed price and book-building by receiving offer for price. In the latter method, the first trading price is quoted as the initial offering price in the prospectus in the stock exchange and the margin is 5% for the trading days. This lasts for five days and for these periods, only the intermediary can quote bid order and other intermediaries are on the ask side.
IV. PREVIOUS RESEARCH ON IPO
In finance literature, a number o f studies documented the performance o f initial public offerings for almost every equity market. The documented studies in finance literature covered the short-run and long-run performance o f IPOs, the reasons o f the underpricing o f IPOs, the impacts o f underwriter price support and underwriter reputation on the pricing o f new issues, the choice o f the offering method in IPOs and the firm value.
Previous research shows that, on average, the difference between the IPO offering price and the first trading market price is greater than reasonable risk premium. Different researchers (Tinig 1988; Carter and Manaster 1990; Ritter 1991; Rock 1986) have attempted to provide some explanations for the abnormal initial returns. In the research o f Ibbotson, Sindelar and Ritter (1988), measured from the offering price to the market price at the end o f the first trading, IPO produce an average initial return that has been estimated at 16.4%. Over time researchers used different models to explain underpricing o f IPOs. The study o f Keasey and Short (1992) on UK Securities Market and Kunz’s and Aggarwal’s (1994) research on Swiss Market are the similar attempts related to the underpricing o f initial public offerings.
One o f the model explaining the underpricing is adverse selection models based on winner’s curse phenomenon suggested by Rock in 1986 and advanced further by Carter and Manaster in 1990. W inner’s curse is based on asymmetric information. There are two groups o f potential investors in the market: a) the informed investors who invest in information production and subscribe to IPOs only when they expect the after-market price to exceed the
oftering price and b) uninformed investors who subscribe to every IPO indiscriminately. Since there is always uncertainty about the market prices o f IPOs, if the issuers and their investment bankers attempt to offer the securities at their expected market clearing prices, the uninformed investors will end up purchasing disproportionately large shares o f the overpriced issues. In order to keep up the uninformed investors in the IPO market, the investment bankers have to ofler the securities at discounts from their expected after market prices. Their losses from the overpriced allocations would be compensated by the excess returns on the underpriced issues.
The signaling models predict that issuing firms try to signal positive information to the investor by underpricing IPOs. Michaely and Shaw (1994), consistent with the winner’s curse hypothesis, show that in markets where investors know a priori that they do not have to compete with informed investors, IPOs are not underpriced. IPOs underwritten by reputable investment banks experience significantly less underpricing and perform significantly better in the long run. It is found that firms, that underprice more, return to the reissue market less frequently and for lesser amounts, than firms that underprice less, and firms, that underprice less, experience higher earnings and pay higher dividends, contrary to the models’ predictions. Enhancing banker relations with investors formulated by Welch (1989) based on signaling is that good firms underprice to leave a good taste in investor’s mouth. Jegadeesh, Weinstein and Welch (1993) signaling models in which firms underprice their initial public offerings o f equity so that they can subsequently issue seasoned equity at more favorable prices. A positive relation is found between IPO underpricing and the probability and the size o f subsequent seasoned offerings.
In Information Cascades model, stated by Ibbotson, Sindelar and Ritter (1994), potential investors pay attention to not only their own information about a new issue but also
to whether other investors are purchasing. An investor may decide not to buy even if he has favorable information when he observes that no one else is buying. Therefore, the issuer may underprice to induce first few potential investors to buy and thereby setting o if a cascade in which all subsequent investors want to buy irrespective o f their private information.
One way to explain underpricing o f IPOs is a form o f insurance to reduce legal liability o f investment banker. TinÍ9 (1988) develops and tests the hypothesis that underpricing serves as a form o f insurance against legal liability and the associated damages to the reputations o f investment bankers. The empirical results based on samples o f IPOs that are brought to the market before and after the Securities Act o f 1933 provide considerable support for implicit insurance hypothesis. Specifically, gross underpricing and market segmentation between prestigious investment bankers in originating unseasoned new issues appear to be peculiar to the post 1933 era.
A popular explanation for underpricing o f unseasoned equity is based on risk aversion o f underwriters: investment bankers purposely underprice new common stocks to reduce their risks and costs o f underwriting. In other words, underpricing serves as a method o f reducing the chances o f ending up with an unsuccessful issue and the associated losses.
Monopsony-Power Hypothesis, another explanation proposed by Ritter (1984), is that gross underpricing may be a result o f the monopsony power o f the investment bankers in underwriting common stocks o f small speculative firms. Large and reputable investment bankers generally do not accept to underwrite common stocks o f small, speculative, start-up firms. According to Ritter, the IPO market is segmented. The IPOs o f small firms are underwritten by investment bankers who can exercise greater bargaining power over the
issuers. These investment bankers intentionally underprice the securities and ration them to their large customers who regularly buy a variety o f investment services from them.
Consequently, difi'erent hypotheses about the reasons o f underpricing in the IPO market suggest differences in the degree o f abnormal returns across different offer size and price categories, different risk classes o f firms and different classes o f underwriters. Thus, some types o f IPOs, such as high risk IPOs, are underpriced more (Ritter, 1984). This observation leads to another stream o f research in the IPO market: namely the presence o f hot and cold issue markets. Hot issue markets refer to the periods during which initial returns o f IPOs are excessively high.
The investment bank’s reputation will have an explanatory power in the question o f why IPOs are underpriced. It is argued that the level o f investment banker prestige is negatively related to the riskiness o f IPOs. In the research o f Johnson and Miller(1988), three main hypotheses explaining the issues underwritten by prestigious investment bankers should exhibit lower initial returns are tested and the following conclusions are derived: The first one is that prestigious bankers underprice less than non-prestigious bankers. The second is that the lower initial returns that are exhibited by prestigious underwriter are caused by differences in risk alone and that banker prestige has no explanatory power in its own right. The third one is that the low initial returns exhibited prestigious bankers are caused by the tendency to associate with less risky issues more than non prestigious bankers. Carter and Manaster(1990) examined the returns earned by subscribing to initial public offerings o f equity. It is shown that in IPOs, more informed investor require higher returns. The marketing o f underwriter’s reputation reveals the expected level o f informed activity. Prestigious underwriters are associated with lower risk offerings. With less risk there is less incentive to acquire information and fewer
informed investors. Consequently, prestigious underwriters are associated with IPOs that have lower returns.
Aftermarket support o f an initial public offering (IPO) is an effort by the underwriter to prop up aftermarket prices when the market price would decline without intervention. Schultz and Zaman (1994) studied the aftermarket for 72 IPOs using comprehensive trade and quote- change data from every market maker for the first three days o f trading is studied. Underwriters quote higher bid prices than other market makers for issues that commence trading at or below the offer price. Underwriters repurchase large quantities o f stock in the aftermarket without risk by overselling the issue by the amount o f the overallotment option. If the IPO is hot, the overallotment option is exercised. If not, the short position is covered with aftermarket selling. Ruud (1993), after the investigation o f the distribution o f initial returns following IPOs, showed that positive mean initial returns may reflect the existence o f a partially unobserved left(negative) tail. Most IPOs with zero one-day returns subsequently fall in price, suggesting that underwriter price support may account for the skewed distribution and hence the phenomenon o f positive average initial IPO returns, even if offering prices are set at expected market value.
Ibbotson, Sindelar and Ritter (1994) in a recent paper find that underpricing persists over time and there are three anomalies associated with IPOs: (1) first day returns that average 10-15%, (2) cycles in both the volume o f new issues and the magnitude o f the first day returns and (3) long run underperformance. The argument related with these anomalies in the paper is that periodic overoptimism by investors creates windows o f opportunity during which many firms rush to the market resulting in disappointing returns to long term investors when the issuers fail to live up to overly optimistic expectations. In contrast, firms that issue during
volume periods typically experience neither high initial price run-ups nor subsequent long run underperformance.
The other phenomenon documented by Ritter(1991) is in the long run, initial public offerings appear to be overpriced. In his study, issuing firms during 1975-1984 substantially underperformed a sample o f matching firms from the closing price on the first day o f the public trading to their three year anniversaries. There is substantial variation in the underperformance year to year and across industries, with companies that went public in high volume years faring the worst. The patterns are consistent with an IPO market in which (l)investors are periodically overoptimistic about the earnings potential o f young growth companies and (2)firms take advantage o f these windows o f opportunity.
V. DATA AND M E TH O D O LO G Y
The stocks that have been offered to the public during 1994 and 1995 in ISE constitute the sample o f the study. In 1994 and 1995, there were 25 and 29 new stocks issued in ISE, respectively. One out o f 25 stocks in 1994 and 6 out o f 29 stocks in 1995 are the stocks o f investment partnership. In constructing the sample, investment partnership due to their characteristics o f relying on the performance o f the stocks on their portfolios are excluded. Two out o f 47 companies, namely Özfinans Factoring and Borova Yapı listed on regional market were also excluded. 45 companies constituting the sample corresponds to approximately 30 % o f the total stocks since there were 158 stocks that were being traded on the market before these public offerings. The relevant raw data is obtained from Reuters and the initial offering prices and the closing prices are adjusted considering the realized paid in capital increases and dividend payments up to June 28, 1996, announced in annual and monthly factbook o f ISE.
V. 1. Istan b u l Stock Exchange
The Istanbul Stock Exchange, ISE, was established in 1985 and commenced business in early 1986. The trading on the ISE has traditionally been characterized by a high degree o f short-term speculative trading which is attributable in part to the relatively underdeveloped institutional investor base in Turkey and to the relatively small size o f retail investor base. Trading prices for securities listed on the ISE are generally limited a range established daily by the ISE. Traders are not permitted to place orders at prices which are more than 10% higher
or 10% lower than the weighted average price o f the relevant security in the preceding trading session.
Turkish disclosure and regulatory standards are less stringent in many respects than standards in more developed securities market. Less information on Turkish companies may be publicly available than regularly published by and about companies in developed securities market. Furthermore, there is lower level o f regulation and monitoring o f the Turkish securities markets and activities o f investors in such markets as compared with the securities markets in the US, UK and certain other countries.
The ISE is considerably smaller and less liquid than securities market in USA, UK and certain other countries. As o f March 31, 1995, the total market capitalization o f all companies whose equities regularly trade on the ISE was 2,213.4 trillion TL. The average daily traded value o f the stocks o f all companies, for 1995, was 9.5 trillion TL. A disproportionately large percentage o f the market capitalization and trading value o f the ISE is represented by a small number o f listed companies. The average daily traded value o f the five most actively-traded stocks on the ISE for 1995 was 2,612 billion TL which represented approximately 27.5% o f the average daily traded value o f all stocks traded on the ISE in 1995. As o f December 31,1995, the shares o f 205 companies were regularly traded on the ISE. Five companies are offered to the public and traded on the ISE as o f May 1,1996. As o f December 31,1995, the combined market capitalization o f the ten companies with greatest market capitalization whose equity securities regularly trade on the ISE was 42.54 percent o f the market capitalization o f all companies regularly trading on the ISE as o f that date.
The i s e İs highly volatile market. The ISE reflected the political and economic
uncertainty in Turkey in 1994 and 1995. On April 4, 1994, following a series o f devaluations o f Turkish Lira in January and February 1994, and increases in certain macroeconomic imbalances, but prior to the adoption o f the Austerity Package, the ISE Composite Index stood at 16356.48. Following the announcement o f the Austerity Package, the Index declined to 14737.37 as o f May 30,1994 and began to rise and stood at 27257.14 on December 30, 1994. In 1995, the highest daily closing value o f the ISE is 54653.93 on April 21. Due to the political uncertainty faced in the fourth quarter o f 1995, the Index dropped to 37757.81 on November 29 and began to rise to 38779 on December 30, 1995 and at 67045 on March 31,
1996.
V. 2. D ata
As aforementioned, the purpose o f the study is to analyze the initial return characteristics o f IPOs in ISE and to determine whether the new issues are underpriced or overpriced. The study concentrates on short term and medium term price behavior o f IPOs in the days, weeks and months following the offer. Initial return characteristics are analyzed through the use o f the closing prices o f the first trading day, five, ten and fifteen successive trading days to make inferences about short term price behavior o f IPOs in ISE during 1994 and 1995. The initial return characteristics for medium term price behavior are analyzed through the use o f closing prices after one month and three months following the first trading day. Although the returns for a month and three months can be regarded as a short term returns in developed securities markets, these durations are considered as medium terms for the investors in ISE due to reflections o f economic and political uncertainty in our country on ISE, highly volatile market.
The sample in 1994 contained 24 IPOs managed by 13 different leader intermediaries (Appendix A. 1.). The size o f the issues and the offering prices spanned a wide range. Issue size ranged from 3,700,000 shares to 145,000,000 shares and from 54 billion TL to 780 billion TL. The shares o f the companies offered to the public spanned from 8.62% to 38.5%. The offering prices ranged from 4,000 to 65,000 in nominal TL. The volume o f the offerings in 1994 totaled to 7,683,665,012,000 TL. Seventeen firms issued their stocks to the public with a firm-commitment (underwriting) agreement, whereas seven firms preferred best-efforts agreement in their offerings. Again, seventeen firms issued their stocks by increasing the paid- in capital and selling the new issued shares to the public (constraining their preemptive rights) and the rest o f the sample; seven companies, sold the existing shares to the public (selling from their portfolio). Among twenty-four IPOs, the shares o f eighteen and four firms were sold according to book building by receiving offer for price and book building by fixed price, respectively and the stocks o f other two companies were sold in the stock exchange.
In 1995, the sample contained 21 firms which were offered to the public by 12 different leader brokers (Appendix A.2.). The issue size spanned from 750,000 shares to 300,000,000 shares and from 15 billion TL to 1,950 billion TL. The shares o f the companies offered to the public ranged from 0.99% to 31.82%. The offering prices were in the range o f 2,800 and 25,500 in nominal TL. The volume o f the offerings in 1995 totaled to 10,698,461,750,000 TL. Nineteen firms and two firms issued their stocks to the public with a firm-commitment agreement and best-efforts agreement, respectively. Among twenty-one IPOs, the shares o f thirteen and five firms were sold by collecting orders with a fixed price and with a book building, respectively, and the stocks o f other three companies were sold in the stock exchange. Ten firms issued their stocks by increasing the paid-in capital and selling the new
issued shares to the public and eight companies sold the existing shares to the public. Three firms used two ways in their initial public offerings at the same time.
V. 3. M ethodology
Initially, the price returns were analyzed for short-term and medium-term price behavior o f new issues in 1994 and 1995. The first day price returns have been calculated through the use o f the offering prices and the closing prices o f the first trading day. The weekly price returns have been calculated for five, ten and fifteen successive days following the first trading day. The monthly returns were calculated for one month and three months after the first trading day. The raw price returns were computed in the following manner;
R(it) = ( ( P(it) -P(iO)) / P(i0))*100 where
R ( it) : the price return o f stock i in t periods after the offering.
P ( it); the closing price o f stock i in t periods after the offering which is adjusted for the stocks dividends and splits if any.
P(iO): the adjusted initial offering price o f stock i.
Since the stocks have been offered to public in different periods, the market adjusted returns, AR(it) will be calculated for the EPOs for the mentioned periods through the use o f the following formula:
AR(it) = ( ( P(it) -P(iO)) / P(iO) - ( I(t)-I(0) )/I(0 )) * 100 where
A R (it): the market adjusted price return o f stock i in t periods after the offering.
P(it) : the closing price o f stock i in t periods after the offering which is adjusted for the stocks dividends and splits if any.
P(iO) : the adjusted initial offering price o f stock i.
I(t) : the ISEC-100 market index at t periods after the corresponding offer. 1(0) : the ISEC-100 market index at the date o f offering each stock.
To test whether the new issues are underpriced or overpriced, the initial returns o f the IPOs must be adjusted. To do so for overall market movements, ISEC-100 index was selected as the proxy for the market. ISEC-100 index is a composite index including the most active 100 companies listed on ISE. Each stock’s excess return, Eit, from the offer date to the market price observed at time t was computed in the following manner (Tınıç, 1988);
E(it) = In (P(it) / P(i0)) - In (I(t) /1(0)) where
E ( it) ; the excess return o f each stock i in t periods after the offer.
P ( it) : the closing price o f each stock i in t periods after the offering which is adjusted for the stocks dividends and splits if any.
P(i0): the adjusted initial offering price o f each stock i.
I(t) ; the ISEC-100 market index at t periods after the corresponding offer. 1(0); the ISEC-100 market index at the date o f offering each stock.
The procedure used to adjust for market returns in the formula assumes that beta coefficient o f the IPOs are all equal to one (Tımç, 1988). However, there are veiy good
reasons to expect that the unseasoned new stocks would tend to be riskier than the existing stocks. Ibbotson (1975) documented that the volatility o f the IPOs is considerably larger than the market’s and that their beta coefficients tend to be large, particularly during the first two months following the offering date. Thus, the excess return, E(it), calculated in the formula provides a somewhat upward-biased estimate o f the initial performance o f an IPO relative to the market. The existence o f abnormal returns in IPOs during the period under analysis was tested by t-statistics. The hypothesis is that at 0.05 level o f significance or less the excess return, Eit, is larger than zero.
VI. RESU LTS
The results o f the study are presented in two sections : short-term and medium-term price behaviors o f IPOs in 1994 and 1995 (Appendix B). In the first section, I have analyzed raw, adjusted and excess returns o f IPOs on the first, fifth, tenth and fifteenth trading day. The initial return characteristics for medium-term price behavior are analyzed on the first month and third month following the offer in the next section.
VI. 1. Short-T erm Price B ehavior of IPOs
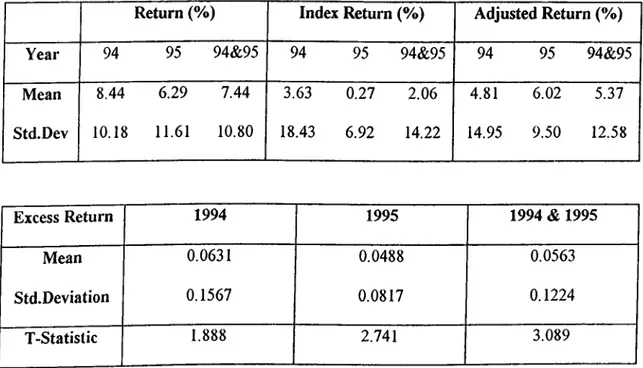
The average return o f 45 initial public offerings in 1994 and 1995 on the first day after the issue has been 7.44% with a standard deviation o f 10.80%. During the same period, ISE market index had an average return o f 2.06% with a variability o f 14.22%. The average o f market adjusted return on the first day after the issue was 5.37% with a standard deviation o f 12.58% in the same period. The average return on the first day after the issue o f 24 IPOs in 1994 and 21 IPOs in 1995 has been 8.44% and 6.29%, respectively. The ISE market index in 1994 had higher average return than the index return in 1995. However, the market adjusted initial returns o f IPOs in 1994 was less than the market adjusted returns in 1995. The highest abnormal return on the first trading day, 26.65%, belongs to Otokar, whereas the investor who bought Alternatifbank had a loss o f 14.26% on the first day. Roughly, one fifth o f the sample was overpriced, while 73.3% o f the sample had positive abnormal first day returns. Three out o f forty-five companies had zero return on the first day following the offer. To test whether the stocks are underpriced or overpriced on the first day, the first step is to calculate the excess
return o f the individual IPOs in 1994 and 1995. The excess returns o f new issues from the offering date to first trading date averaged to 0.0563 with a variability o f 0.1224. The null hypothesis that mean excess return o f the sample is zero can be rejected at the 0.05 level o f significance. The t-statistic is equal to 3.089 with 44 degrees o f freedom. Hence it can be concluded that IPOs in ISE during 1994 and 1995 are underpriced.
Table 1. The performance o f IPOs on the first trading day following the offer.
Return (%) Index Return (%) Adjusted Return (%)
Year 94 95 94«&95 94 95 94«&95 94 95 94&95
Mean 8.44 6.29 7.44 3.63 0.27 2.06 4.81 6.02 5.37
Std.Dev 10.18 11.61 10.80 18.43 6.92 14.22 14.95 9.50 12.58
Excess Return 1994 1995 1994 & 1995
Mean 0.0631 0.0488 0.0563
Std.Deviation 0.1567 0.0817 0.1224
T-Statistic 1.888 2.741 3.089
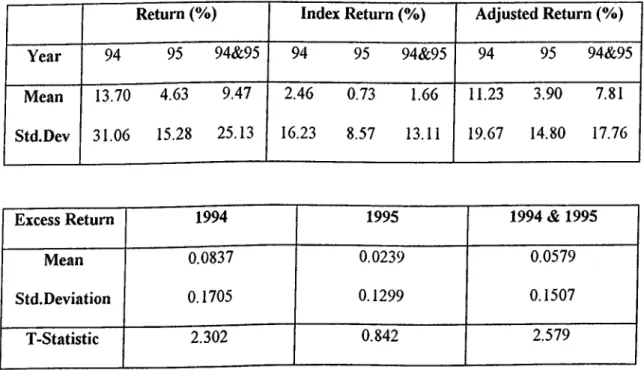
The second investigation o f the short-term price behavior is on the weekly returns o f new issues during the same period. Initially, I have analyzed returns o f IPOs from the date o f the offering to the date o f five successive days following the first trading day. The first weekly return o f 45 IPOs in 1994 and 1995 averaged to 9.47% with a variability o f 25.13%. During the period under analysis, the average weekly return o f ISE market index was 1.66% with a standard deviation o f 13.11%. The average and standard deviation o f market adjusted return for the first week have been 7.81% and 17.76%, respectively. As in the case o f the first day abnormal return, the average first week return o f 24 companies in 1994 was considerable
higher than the average weekly return o f companies in 1995. This is also valid for both average weekly index return and average weekly market adjusted return. The lucky investor in Kerevita? realized an abnormal return o f 104.17% in the first week, the highest return for the period. The biggest loser in the first week was Ihlas Holding with 36% negative return. One fourth o f the sample had a negative return at the end o f the first week, while the remainings were underpriced. The excess returns o f the new issues from the offering date to the date o f first week later than initial trading day averaged to 0.0579 with a standard deviation o f 0.1507. As in the case o f the first day abnormal return, the mean excess returns o f IPOs for the first week is statistically different from zero at 0.05 level o f significance. The t-statistic is equal to 2.579 with 44 degrees o f freedom. It can be inferred that IPOs in 1994 and 1995 are underpriced regarding the performance o f the new issues one week later than the initial trading date.
Table 2. The performance of IPOs on the fifth trading day following the offer.
Return (%) Index Return (%) Adjusted Return (%)
Year 94 95 94&95 94 95 94&95 94 95 94&95
Mean 13.70 4.63 9.47 2.46 0.73 1.66 11.23 3.90 7.81
Std.Dev 31.06 15.28 25.13 16.23 8.57 13.11 19.67 14.80 17.76
Excess Return 1994 1995 1994 & 1995
Mean 0.0837 0.0239 0.0579
Std.Deviation 0.1705 0.1299 0.1507
T-Statistic 2.302 0.842 2.579
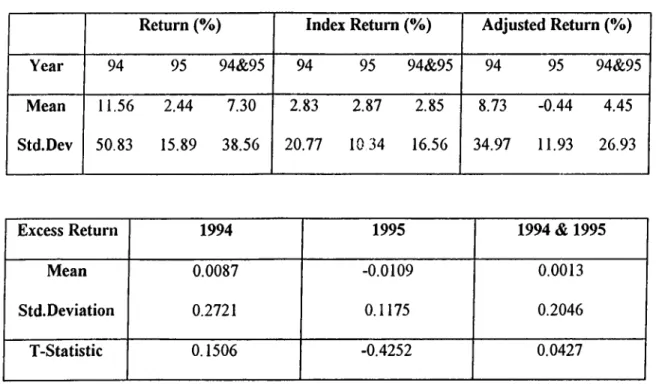
The third analysis o f IPOs during 1994 and 1995 is related with the performance o f the stocks after ten successive days following the first trading date. The average return o f the new issues on the tenth day following the initial trading day has been 7.30% with a variability o f 38.56%. The market index during the same period had average return o f 2.85% with a standard deviation 16.56% for two weeks. The average and standard deviation o f market adjusted returns o f IPOs for ten days were 4.45% and 26.93%, respectively. Kerevitaş has the highest return o f 150% while Yapı Kredi Leasing has the lowest return o f 59.17% for the same period. Twenty out o f forty-five companies had negative returns during 1994 and 1995. For the second week, there exists a considerable decrease in the average return o f new issues, from 11.56% in 1994 to 2.44% in 1995. The mean excess return o f IPOs for the second week was 0.0013 with a standard deviation o f 0.2046. Unlike the prior findings, IPOs are neither underpriced nor overpriced for the second week. The related t-statistics was 0.0427 insignificant at the level o f 0.05.
Table 3. The performance of IPOs on the tenth trading day following the olTer.
Return (%) Index Return (%) Adjusted Return (%)
Year 94 95 94&95 94 95 94&95 94 95 94«&95
Mean 11.56 2.44 7.30 2.83 2.87 2.85 8.73 -0.44 4.45
Std.Dev 50.83 15.89 38.56 20.77 1034 16.56 34.97 11.93 26.93
Excess Return 1994 1995 1994 & 1995
Mean 0.0087 -0.0109 0.0013
Std.Deviation 0.2721 0.1175 0.2046
T-Statistic 0.1506 -0.4252 0.0427
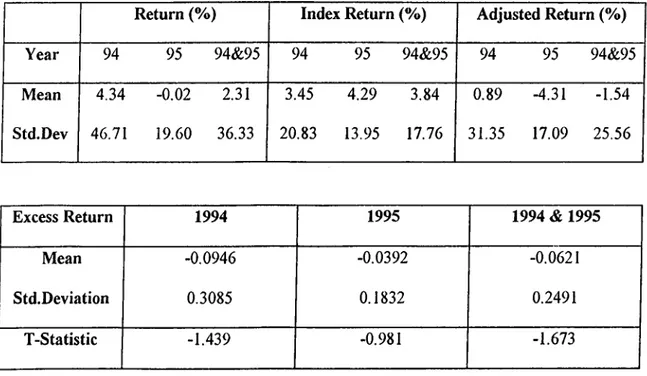
In the third week after their offer, the initial public offerings had an average return o f 2.31% with a high variability o f 36.33%. The average o f market index return was 3.84% with a standard deviation o f 17.76%. The market adjusted return for the third week following the first trading day had a mean o f -1.54% and standard deviation o f 25.56%. The number companies having positive and negative returns at the end o f third week is 24 and 21, respectively. The average return o f IPOs in 1995 was almost zero whereas new issues had an average return o f 4.34% in 1994. Considering the performance o f companies on the third week. Yapı Kredi Leasing was loss leader and Kerevitaş was gain leader. The mean excess return for the third week was -0.0621 with a standard deviation o f 0.2491. The related t- statistic was -1.673, insignificant at level o f 0.05. According to the test results, the new issues are neither overpriced nor underpriced on the fifteenth day following the initial trading day.
Table 4. The performance o f IPOs on the third week after the initial trading.
Return (%) Index Return (%) Adjusted Return (%)
Year 94 95 94&95 94 95 94«fc95 94 95 94&95
Mean 4.34 -0.02 2.31 3.45 4.29 3.84 0.89 -4.31 -1.54
Std.Dev 46.71 19.60 36.33 20.83 13.95 17.76 31.35 17.09 25.56
Excess Return 1994 1995 1994 & 1995
Mean -0.0946 -0.0392 -0.0621
Std.Deviation 0.3085 0.1832 0.2491
T-Statistic -1.439 -0.981 -1.673