i
FINDING AN OPTIMUM SURFACE CHEMISTRY FOR
BaO/TiO
2/Al
2O
3SYSTEMS AS NO
xSTORAGE MATERIALS
A THESIS
SUBMITTED TO THE DEPARTMENT OF CHEMISTRY AND
THE INSTITUTE OF ENGINEERING AND SCIENCES OF
BILKENT UNIVERSITY
IN PARTIAL FULFILLMENT OF THE REQUIREMENTS
FOR THE DEGREE
OF
MASTER OF SCIENCE
By
GÖKSU SEDA ŞENTÜRK
JULY 2010
ii
iii
I certify that I have read this thesis and in my opinion it is fully adequate, in scope and quality, as a thesis of the degree of Master of Science
___________________________________ Assistant Prof. Dr. Emrah ÖZENSOY (Supervisor)
I certify that I have read this thesis and in my opinion it is fully adequate, in scope and quality, as a thesis of the degree of Master of Science
___________________________________ Prof. Dr. Ömer DAĞ
I certify that I have read this thesis and in my opinion it is fully adequate, in scope and quality, as a thesis of the degree of Master of Science
___________________________________ Prof. Dr. Saim ÖZKAR
iv
I certify that I have read this thesis and in my opinion it is fully adequate, in scope and quality, as a thesis of the degree of Master of Science
_________________________________ Assoc. Prof. Dr. Margarita KANTCHEVA
I certify that I have read this thesis and in my opinion it is fully adequate, in scope and quality, as a thesis of the degree of Master of Science
___________________________________ Prof. Dr. Oğuz GÜLSEREN
Approved for the Institute of Engineering and Sciences
____________________________________ Prof. Dr. Levenet ONURAL
v
ABSTRACT
FINDING AN OPTIMUM SURFACE CHEMISTRY FOR
BaO/TiO
2/Al
2O
3SYSTEMS AS NO
xSTORAGE MATERIALS
GÖKSU SEDA ŞENTÜRK
M.S. in Chemistry
Supervisor: Assistant Prof. Dr. Emrah ÖZENSOY July 2010
Titania promoted NOx storage materials in the form of BaO/TiO2/Al2O3 were synthesized via two different sol-gel preparation techniques, with varying surface compositions and morphologies [1, 2]. The influence of the TiO2 units on the NOx storage component (8 - 20 wt. % BaO), the nature of the crystallographic phases, thermal stabilities and the dispersion of the surface oxide/nitrate domains were investigated.
The structural characterization of the synthesized NOx storage materials were analyzed by means of BET surface area analysis, X-ray diffraction (XRD), ex-situ Raman spectroscopy, scanning electron microscopy (SEM), energy dispersive X- ray (EDX) and transmission electron microscopy (TEM). Comparative analysis of the results showed that the TiO2/Al2O3 support material derived by the co-precipitation of the corresponding hydroxides via the sol-gel technique, exhibited distinctively more homogenous distribution of TiO2 domains.
The functionality/performance of these materials upon NOx and SOx adsorptions were monitored by temperature programmed desorption (TPD) and in-situ Fourier transform infrared (FTIR) spectroscopy. An improved Ba surface dispersion was observed for the BaO/TiO2/Al2O3 materials synthesized via the co-precipitation of alkoxide precursors which was found to originate mostly from the
vi
increased fraction of accessible TiO2/TiOx sites on the surface. These TiO2/TiOx sites functioned as strong anchoring sites for surface BaO domains and were tailored to enhance surface dispersion of BaO. The relative stability of the NOx species adsorbed on the BaO/TiO2/Al2O3 system was found to increase in the following order: NO+/N2O3 on alumina << nitrates on alumina < surface nitrates on BaO < bridged/bidentate nitrates on large/isolated TiO2 clusters < bulk nitrates on BaO on alumina surface and bridged/bidentate nitrates on TiO2 crystallites homogenously distributed on the surface < bulk nitrates on the BaO sites located on the TiO2 domains.
The detailed study of the interaction of SOx with BaO/TiO2/Al2O3 ternary oxide materials showed that titania (TiO2) was a promising candidate for improving the sulfur tolerance on these type of surfaces. Adsorption of SOx on both pure Al2O3 and TiO2 showed that Al2O3 formed strongly bound SOx species, that were thermally stable up to T > 1073 K. SOx adsorption directly altered stability of the nitrate species on the Ti/Al (Protocol 1, Protocol 2) samples. SOx uptake properties of the BaO/TiO2/Al2O3 materials were found to be strongly influenced by the morphology of the TiO2/TiOx domains and the BaO loadings (8/20 wt% BaO). Consequently, the presence of titania domains was seen to decrease the SOx desorption temperatures and enhance the sulfur-tolerance of these materials by destabilizing the accumulated sulfate species. SOx exposure on the synthesized materials led to a significant decrease in the NOx adsorption capacities. The results obtained from FT-IR spectra showed that the sulfur deposition on the NOx storage materials promoted by TiO2 were more readily removed with respect to the conventional 8(20)Ba/Al samples.
Keywords: NOx storage materials, NSR, LEANOX, BaO, Al2O3, TiO2, anatase, rutile, BaTiO3, sulfur poisoning, DeNOx, NO2, SOx, FTIR, TPD.
vii
ÖZET
BaO/TiO
2/Al
2O
3YAPISINDAKİ NO
xDEPOLAMA
MALZEMELERİNİN OPTİMUM YÜZEY KİMYASININ
BELİRLENMESİ
GÖKSU SEDA ŞENTÜRK
Kimya Bölümü Yüksek Lisans Tezi Tez Yöneticisi: Yrd. Doç. Emrah ÖZENSOY
Temmuz 2010
Bu çalışmada, iki farklı sol-jel hazırlama tekniği kullanılarak NOx depolama malzemesi olan BaO/TiO2/Al2O3 numuneleri sentezlenmistir. TiO2 birimlerinin NOx depolama bileşeni olan BaO (kütlece ağırlıkları % 8 ve % 20) ile etkileşimi, oluşan farklı kristalografik fazlar, malzemelerin ısıl kararlılıklarındaki değişiklikler ve yüzeydeki oksit/nitrat dağılımlarındaki farklılaşmalar incelenmiştir. Mevcut çalışmanın merkezindeki sav, NOx depolama malzemelerinin yüzeylerindeki BaO birimlerinin yüzey dağılımlarının ve yüzey difüzyon özelliklerinin, özel yapılardaki TiO2/TiOx bileşenleri kullanılarak kontrollü bir şekilde değiştirilebileceğinin gösterilmesidir.
Sentezlenen NOx depolama malzemelerinin yapısal karakterizasyonu, BET (Brunauer, Emmett, ve Teller) yüzey alanı ölçümleri, x-ışını kırınımı (XRD), Raman spektroskopisi, taramalı elektron mikroskobu (SEM), enerji saçınım x-ışını spektroskopisi (EDX) ve geçirimli elektron mikroskopisi (TEM) teknikleri kullanılarak yapılmıştır. Elde edilen sonuçlar detaylı bir şekilde karşılaştırılıp analiz
viii
edildiğinde, sol-jel tekniği kullanılarak eşzamanlı çöktürme yöntemiyle sentezlenen TiO2/Al2O3 destek malzemelerindeki TiO2 birimlerinin, daha türdeş bir dağılım sergilediği ortaya çıkmaktadır.
Bu malzemelerin NOx ve SOx adsorpsiyonları sırasındaki/sonrasındaki davranışları sıcaklık programlı yüzeyden buharlaştırma (TPD) ve Fourier Dönüşümlü Kızıl Ötesi Spektroskopisi (FTIR) teknikleri ile izlenmiştir. Alkoksit öncü malzemeleri kullanılarak sentezlenen BaO/TiO2/Al2O3 numuneleri üzerindeki barium oksit adacıkları daha iyi bir yüzey dağılımı göstermektedir. Bu numunelerin yüzeyinde türdeş ve iyi bir şekilde dağılmış olan TiO2/TiOx birimleri yüzeydeki BaO bileşenleri için güçlü çapa görevi görerek, BaO birimlerini kendilerine bağlamış ve böylece BaO birimlerinin yüzey dağılımını arttırmıştır. Yüzeyde depolanan NOx türlerinin ısıl kararlılıkları şu şekilde sıralanmaktadır: Al3+- NO/N2O3 << Al3+ -nitratları < BaO yüzeyi üzerindeki nitratlar < büyük TiO2 birimlerine bağlı köprülü nitratlar < BaO üzerindeki oylumsal (bulk) nitratlar ve yüzeye türdeş şekilde dağılmış küçük TiO2 birimlerine bağlı köprülü nitratlar < TiO2 üzerindeki BaO yüzeyine bağlı oylumsal (bulk) nitratlar.
SO2’nin üçlü oksit yapıdaki BaO/TiO2/Al2O3 malzemeleri ile olan etkileşiminin detaylı olarak incelenmesi sonucunda; bu tür malzemelere eklenen TiO2 birimlerinin, bu malzemelerdeki kükürt zehirlenme direncinin arttırılması için güçlü bir aday olduğunu göstermiştir. Ti/Al (P1, P2) yüzeylerine SOx’in tutunması, yüzeye bağlanan nitratların kararlılıklarını ve miktarlarını azaltmıştır. BaO/TiO2/Al2O3 malzemelerindeki SOx birikimi ve kükürt zehirlenme miktarları doğrudan, TiO2/TiOx birimlerinin yüzey morfolojisine ve malzemede kullanılan BaO’in kütlece ağırlık miktarına bağlı olduğu saptanmıştır. FTIR sonuçları TiO2 ile zenginleştirilmiş NOx depolama malzemelerinden kükürt salınımının, TiO2 içermeyen, sıradan 8(20) Ba/Al NOx depolama malzemelerine göre daha kolay olduğu ortaya koymuştur.
Anahtar Kelimeler: NOx depoloma malzemeleri, NSR, LEANOX, BaO, Al2O3, TiO2, anataz, rutil, BaTiO3, kükürt zehirlenmesi, DeNOx, NO2, SOx, FTIR, TPD.
ix
ACKNOWLEDGEMENT
I would like to express my gratitude to…
My supervisor Assistant Prof. Dr. Emrah Özensoy for his guidance, patience and supervision throughout my studies.
Prof. Ö. Dağ and Assoc. Prof. M. Kantcheva for fruitful discussions and help with the preparation of the binary oxide TiO2/Al2O3 support materials
Stanislava Andonova, Emine Kayhan and Evgeny Vovk for their partnership and help during this research.
Scientific and Technical Research Council of Turkey (TUBITAK) (Project Code: 108M379, 107Y115). This work was also partially supported by the European Union FP7 project called UNAM-REGPOT (Contract No: 203953).
Beril Baykal, Safacan Kölemen and my group members Emre Emmez, Zafer Say and Emrah Parmak for their valuable friendship.
Ahmet Yurttadur, my parents; Emin and Havva and my brother Anıl for their continuous support and love.
x
TABLE OF CONTENTS
1 INTRODUCTION ... 1
2 EXPERIMENTAL ... 9
2.1 Sample Preparation ... 9
2.1.1 Synthesis of TiO2/Al2O3 Support Materials ... 9
2.1.2 Synthesis of BaO/TiO2/Al2O3: NOx Storage Materials .. …………12
2.2 Experimental Techniques ... 12
2.2.1
BET...122.2.2 XRD ... 12 2.2.3 Raman Spectroscopy ... 12 2.2.4 SEM/EDX ... 13 2.2.5 TEM ... 13 2.2.6 FTIR ... 13
2.2.6.1 Surface Acidity via Pyridine Adsorption .. ...14
2.2.6.2 Stepwise NO2 (g) Adsorption Experiments ... 15
2.2.6.3 Temperature-Dependent FTIR Experiments ... 15
2.2.6.4 SO2 (g) + O2 (g) Adsorption Experiments ... 16
2.3.6.5 NO2(g) Adsorption on Prepoisoned Sample ... 16
2.2.7 TPD ... 17
2.2.7.1 Thermal Stability of NOx species on Fresh Materials ... 17
2.2.7.2 Thermal Stability of SOx/NOx species on Sulfated Materials. 17 3 RESULTS AND DISCUSSION ... 19
3.1 TiO2/Al2O3 Binary Oxide Support Materials ... 19
xi
3.1.1.1 Specific Surface Area Measurements ... 19
3.1.1.2 XRD Experiments ... 21
3.1.1.3 Raman Spectroscopy Experiments ... 25
3.1.1.4 SEM-EDX Measurements ... 29
3.1.1.5 TEM Measurements ... 31
3.1.1.6 Surface Acidity: FTIR Spectra of Chemisorbed Pyridine ... 32
3.1.2 NOx Uptake Protocol: Functionality/Performance of TiO2/Al2O3 .. 35
3.1.2.1 NOx Adsorption on Ti/Al via FTIR Spectroscopy ... 35
3.1.2.1.1 Stepwise NO2(g) Adsorption on Ti/Al (P1) ... 36
3.1.2.1.2 Stepwise NO2(g) Adsorption on Ti/Al (P2) ... 39
3.1.2.2 Thermal Behavior of Adsorbed NOx on Ti/Al via TPD ... 41
3.1.3 SOx Uptake of TiO2 promoted Al2O3 catalytic support materials ... 45
3.1.3.1 FTIR Study of SO2(g) + O2(g) Interaction with Ti/Al ... 45
3.1.3.2 SOx Poisoning on the NOx adsorption behaviour of Ti/Al ... 53
3.1.3.3 Thermal Stability of adsorbed NOx on the SOx treated Ti/Al . 61 3.1.3.4 Thermal Stability of adsorbed SOx on Ti/Al ... 68
3.2 BaO/TiO2/Al2O3 Ternary Oxide NOx Storage Materials ... 71
3.2.1 Structural Characterization of Ba/Ti/Al NOx Storage Materials ... 71
3.2.1.1 XRD Experiments ... 71
3.2.1.2 Raman Spectroscopy Experiments ... 78
3.2.1.3 SEM-EDX Measurements ... 81
3.2.1.4 Surface Acidity: FTIR Spectra of Chemisorbed Pyridine ... 83
3.2.2 NOx Uptake Protocol:Functionality of BaO/TiO2/Al2O3 ... 88
3.2.2.1 NOx Adsorption on Ba/Ti/Al via FTIR Spectroscopy ... 88
3.2.2.2 Thermal Behavior of Adsorbed NOx on Ba/Ti/Al via TPD .. 93
xii
3.2.3.1 FTIR Study of SO2(g) + O2(g) Interaction with Ba/Ti/Al ... 98
3.2.3.2 SOx Poisoning on NOx adsorption behaviour of Ba/Ti/Al .... 103
3.2.3.3 Thermal Stability of adsorbed NOx on SOx treated Ba/Ti/Al 107 3.2.3.4 Thermal Stability of adsorbed SOx on Ti/Al ... 111
4 CONCLUSIONS………. 113
5 REFERENCES………. .. 116
xiii
LIST OF TABLES
Table 1. Typical concentrations of untreated exhaust gases for diesel and gasoline
engines [7]. ... 2 Table 2. Compositions of the synthesized ternary oxide NOx storage materials. ... 11
Table 3. BET Specific surface area measurements of the samples calcined within
623-1273K ... 20 Table 4. Infrared Bands Assigned to SOx species [31, 100, 103, 104, 107, 124-126] ... 48
xiv
LIST OF FIGURES
Figure 1. Fuel consumption and 3-way performance of a gasoline engine as a
function of air–fuel (A/F) ratio [5]. ... 3 Figure 2. Specific surface area data for the samples after thermal treatments at
various temperatures ... 20 Figure 3. XRD patterns of the Ti/Al (P1) samples before and after calcination in the
temperature range of 423-1273 K, pure γ-Al2O3 calcined at 1273 K is also shown in the figure ... 22 Figure 4. XRD patterns of the Ti/Al (P2) samples before and after calcination in the
temperature range of 423-1273 K ... 23 Figure 5. Temperature-dependent ex-situ Raman spectra corresponding to the
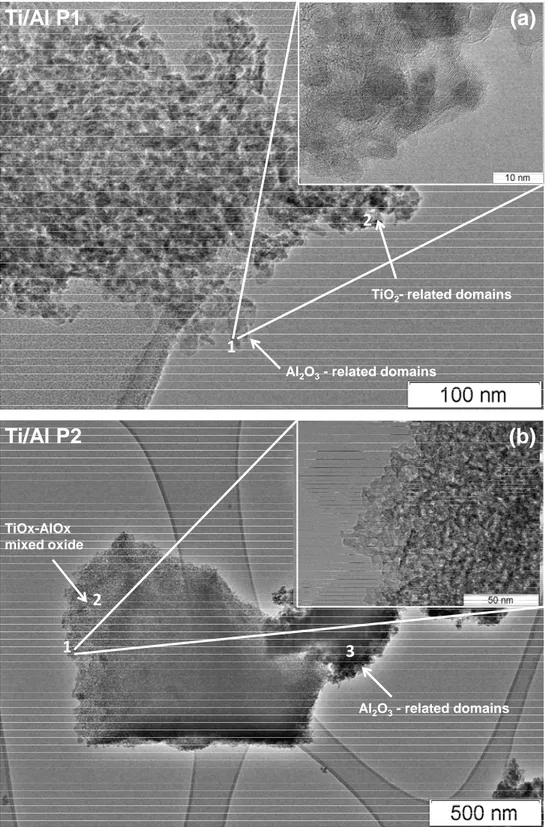
calcined (423-1273 K) Ti/Al samples (a) Ti/Al P1 (b) Ti/Al (P2), (c) and (d) present the Raman and XRD data for the bulk anatase and rutile reference materials ... 26 Figure 6. Ti and Al elemental EDX maping images for Ti/Al (P1) and Ti/Al P2. ... 30 Figure 7. Representative TEM images of a) Ti/Al (P1) 1) γ-Al2O3-rich domains 2) TiO2-rich domains on the sample b) Ti/Al (P2) 1-2) inset showing the sponge-like surface morphology of the TiOx-AlOx mixed oxide 3) darker area represents the Al2O3-rich domains on the sample ... 31
Figure 8. Temperature-dependent (323-723 K) FTIR spectra for chemisorbed
pyridine species formed at room temperature on the surface of pure γ-Al2O3 (a) and on Ti/Al (P1) precalcined at 873 K (b). ... 33 Figure 9. FTIR spectra corresponding to the stepwise NO2 adsorption at 323 K on (a) Ti/Al (P1), (b) Ti/Al (P2), (c) γ-Al2O3 and (d) TiO2 (anatase) surfaces. The spectrum corresponding to the NO2-saturated surfaces are marked with ”S”. ... 37
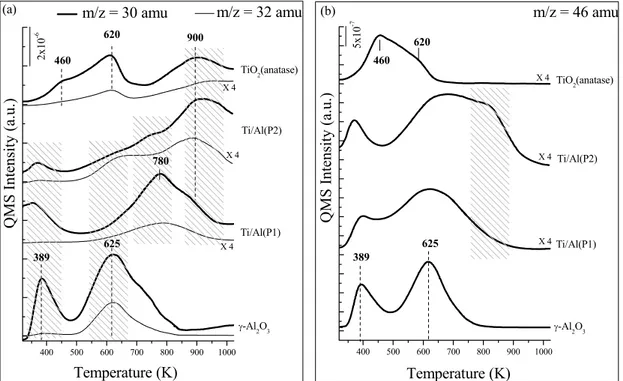
Figure 10. TPD profiles obtained after saturating Ti/Al (P1), Ti/Al (P2), γ-Al2O3 and TiO2 surfaces with NO2 at 323 K a) 30, 32 amu signals, b) 46 amu signal. ... 42
Figure 11. FTIR spectra for SO2 (g) + O2 (g) (SO2:O2, 0.1:1) co-adsorption on γ-Al2O3.a) After 1 h exposure to SO2 (g) + O2 (g) at 323 K (spectrum was obtained in the presence of the gas mixture), b) after flashing the sample in (a) to 473 K in SO2 + O2 and cooling to 323 K (spectrum was obtained in the presence of the gas mixture), c) after flashing the sample in (b) to 673 K in SO2 (g) + O2 (g) and further
xv
evacuation at 323 K for 20 min (Preactor < 1×10⁻⁴ Torr) , d) after flashing the sample in (c) to 673K in vacuum (Preactor < 1×10⁻⁴ Torr) and cooling to 323 K. ... 46
Figure 12. FTIR spectra for SO2 (g) + O2 (g) (SO2:O2, 0.1:1) co-adsorption on TiO2 (anatase). a) After 1 h exposure to SO2 (g) + O2 (g) at 323 K (spectrum was obtained in the presence of the gas mixture), b) after flashing the sample in (a) to 473 K in SO2 + O2 and cooling to 323 K (spectrum was obtained in the presence of the gas mixture), c) after flashing the sample in (b) to 673 K in SO2 (g) + O2 (g) and further evacuation at 323 K for 20 min (Preactor < 1×10⁻⁴ Torr), d) after flashing the sample in (c) to 673K in vacuum (Preactor < 1×10⁻⁴ Torr) and cooling to 323 K. ... 49
Figure 13. FTIR spectra for SO2 (g) + O2 (g) (SO2:O2, 0.1:1) co-adsorption on a) Ti/Al (P1) and b) Ti/Al (P2) i) After 1 h exposure to SO2 (g) + O2 (g) at 323 K (spectrum was obtained in the presence of the gas mixture), ii) after flashing the sample in (a) to 473 K in SO2+O2 and cooling to 323 K (spectrum was obtained in the presence of the gas mixture), iii) after flashing the sample in (b) to 673 K in SO2 (g) + O2 (g) and further evacuation at 323 K for 20 min (Preactor < 1×10⁻⁴ Torr), iv) after flashing the sample in (c) to 673K in vacuum (Preactor < 1×10⁻⁴ Torr) and cooling to 323 K. ... 52 Figure 14. FTIR spectra corresponding to NO2(g) adsorption at 323 K on fresh (black spectrum) and poisoned (red spectrum) γ-Al2O3 surface. Poisoning of the surface was performed by exposing γ-Al2O3 to SO2 (g)+ O2 (g) (SO2:O2, 0.1:1) at 323 K, followed by heating of the sample in the gaseous mixture at 473 K for 30 min and a final evacuation at 323 K (Preactor < 1x10⁻³ Torr). NOx uptake of the fresh and poisoned surfaces were performed by exposing the samples to 8 Torr of NO2 at 323 K for 20 min, followed by evacuation of the reactor to < 1x10⁻³ Torr. All of the FTIR spectra were acquired in vacuum at 323 K. ... 54 Figure 15. FTIR spectra corresponding to NO2(g) adsorption at 323 K on fresh (black spectrum) and poisoned (red spectrum) TiO2 (anatase)surface. Poisoning of the surface was performed by exposing TiO2 to SO2 (g)+ O2 (g) (SO2:O2, 0.1:1) at 323 K, followed by heating of the sample in the gaseous mixture at 473 K for 30 min and a final evacuation at 323 K (Preactor < 1x10⁻³ Torr). NOx uptake of the fresh and poisoned surfaces were performed by exposing the samples to 8 Torr of NO2 at 323 K for 20 min, followed by evacuation of the reactor to < 1x10⁻³ Torr. All of the FTIR spectra were acquired in vacuum at 323 K. ... 57
xvi
Figure 16. FTIR spectra corresponding to NO2(g) adsorption at 323 K on fresh (black spectra) and poisoned (red spectra) a) Ti/Al (P1) and b) Ti/Al (P2) samples. Poisoning of the surfaces were performed by exposing the samplesto SO2 (g)+ O2 (g) (SO2:O2, 0.1:1) at 323 K, followed by heating of the samples in the gaseous mixture at 473 K for 30 min and a final evacuation at 323 K (Preactor < 1x10⁻³ Torr). NOx uptake of the fresh and poisoned surfaces were performed by exposing the samples to 8 Torr of NO2 at 323 K for 20 min, followed by evacuation of the reactor to < 1x10⁻³ Torr. All of the FTIR spectra were acquired in vacuum at 323 K. ... 58 Figure 17. Comparison of the FTIR spectra revealing the species remaining on the
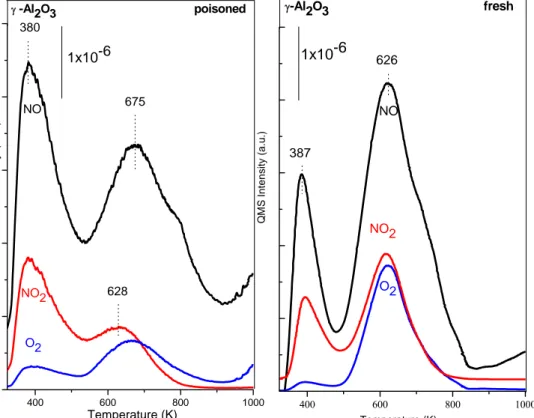
γ–Al2O3 (black spectrum), Ti/Al (P1) (red spectrum) and Ti/Al (P2) (blue spectrum) surfaces after a procedure consisting of SOx poisoning, NOx saturation and evacuation/desorption at 1023 K. Poisoning of the surfaces were performed by exposing the samples to SO2 (g) + O2 (g) (SO2:O2, 0.1:1) at 323 K, followed by heating of the samples in the gaseous mixture at 473 K for 30 min and a final evacuation at 323 K (Preactor < 1x10⁻³ Torr). NOx uptake of the fresh and poisoned surfaces were performed by exposing the samples to 8 Torr of NO2 at 323 K for 20 min, followed by evacuation of the reactor to < 1x10⁻³ Torr at 1023 K. All of the FTIR spectra were acquired in vacuum at 323 K. ... 60 Figure 18. TPD profiles obtained from poisoned and fresh γ-Al2O3 samples which are saturated with 8 Torr NO2 (g) at 323 K for 20 min. Black, blue and red curves correspond to 30 amu (NO), 32 amu (O2) and 46 amu (NO2) signals, respectively. (Before the NO2 adsorption, sample was poisoned via SO2 (g)+ O2 (g) exposure at 323 K, where SO2:O2 pressure ratio was 0.1 Torr :1 Torr, followed by further heating in the gaseous mixture at 473 K for 30 min and a final evacuation at 323 K). ... 63 Figure 19. TPD profiles obtained from poisoned and fresh TiO2 (anatase) samples which are saturated with 8 Torr NO2 (g) at 323 K for 20 min. Black, blue and red curves correspond to 30 amu (NO), 32 amu (O2) and 46 amu (NO2) signals, respectively. (Before the NO2 adsorption, sample was poisoned via SO2 (g)+ O2 (g) exposure at 323 K, where SO2:O2 pressure ratio was 0.1 Torr :1 Torr, followed by further heating in the gaseous mixture at 473 K for 30 min and a final evacuation at 323 K). ... 64 Figure 20. TPD profiles obtained from poisoned and fresh Ti/Al (P1) samples which
xvii
correspond to 30 amu (NO), 32 amu (O2) and 46 amu (NO2) signals, respectively. (Before the NO2 adsorption, sample was poisoned via SO2 (g)+ O2 (g) exposure at 323 K, where SO2:O2 pressure ratio was 0.1 Torr :1 Torr, followed by further heating in the gaseous mixture at 473 K for 30 min and a final evacuation at 323 K). ... 66 Figure 21. TPD profiles obtained from poisoned and fresh Ti/Al (P2) samples which
are saturated with 8 Torr NO2 (g) at 323 K for 20 min. Black, blue and red curves correspond to 30 amu (NO), 32 amu (O2) and 46 amu (NO2) signals, respectively. (Before the NO2 adsorption, sample was poisoned via SO2 (g)+ O2 (g) exposure at 323 K, where SO2:O2 pressure ratio was 0.1 Torr :1 Torr, followed by further heating in the gaseous mixture at 473 K for 30 min and a final evacuation at 323 K). ... 67 Figure 22. SO2 and H2S desorption profiles for a) γ-Al2O3 b) TiO2 c) Ti/Al (P1) d) Ti/Al (P2) surfaces which are first poisoned with SO2 (g) + O2 (g) at 323 K (SO2:O2 pressure ratio= 0.1 Torr : 1 Torr) and then heated in this gas mixture at 473 K for 30 min followed by saturation with NO2 at 323 K. ... 70
Figure 23. Thermal behavior of the XRD profiles corresponding to the as-prepared
8Ba/Ti/Al (P1) materials and the 8Ba/Ti/Al (P1) samples annealed at 423-1273 K in Ar(g). ... 72 Figure 24. Thermal behavior of the XRD profiles corresponding to the as-prepared
20Ba/Ti/Al (P1) materials and the 20Ba/Ti/Al (P1) samples annealed at 423-1273 K in Ar(g). ... 73 Figure 25. Thermal behavior of the XRD profiles corresponding to the as-prepared
8Ba/Ti/Al (P2) materials and the 8Ba/Ti/Al (P2) samples annealed at 423-1273 K in Ar(g). ... 75 Figure 26. Thermal behavior of the XRD profiles corresponding to the as-prepared
20Ba/Ti/Al (P2) materials and the 20Ba/Ti/Al (P2) samples annealed at 423-1273 K in Ar(g). ... 76 Figure 27. Temperature-dependent ex-situ Raman spectra corresponding to the
calcined (423-1273 K) and uncalcined Ba/Ti/Al (P1) samples with different Ba loadings: (a) 8Ba/Ti/Al and (b) 20Ba/Ti/Al. ... 78 Figure 28. Selected SEM/EDX images for 8 Ba/Ti/Al (P1) samples calcined at
623K. (a) SEM image, images given in b-d correspond to the elemental EDX mapping (b) Ba + Al, (c) Ti + Al, (d) Ba + Ti . ... 82
xviii
Figure 29. Temperature-dependent (323-723 K) FTIR spectra for chemisorbed
pyridine species formed at room temperature on the surface of the Ba/Al NOx storage materials with different BaO loadings precalcined at 873 K: (a) 8Ba/Al and (b) 20Ba/Al. All spectra were acquired in vacuum at 323 K after the pyridine exposure, followed by the evacuation at 323 K, annealing to the given temperature and then cooling to 323 K in vacuum ... 84 Figure 30. Temperature-dependent (323-723 K) FTIR spectra for chemisorbed
pyridine species formed at room temperature on the surface of the Ba/Ti/Al (P1) ternary oxide NOx storage materials with different BaO loadings precalcined at 873 K: (a) 8Ba/Ti/Al and (b) 20Ba/Ti/Al. All spectra were acquired in vacuum at 323 K after the pyridine exposure, followed by the evacuation at 323 K, annealing to the given temperature and then cooling to 323 K in vacuum. ... 86 Figure 31. FTIR spectra corresponding to the stepwise NO2 adsorption at 323 K on: (a) 8Ba/TiAl (P1) and (b) 8BaA/Ti/Al (P2) samples. The spectra corresponding to the fully saturated sample surfaces are marked with “S”. (All spectra are acquired in vacuum at 323 K) ... 89 Figure 32. FTIR spectra corresponding to the stepwise NO2 adsorption at 323 K on: (a) 20Ba/TiAl (P1) and (b) 20BaA/Ti/Al (P2) samples. The spectra corresponding to the fully saturated sample surfaces are marked with “S”. (All spectra are acquired in vacuum at 323 K) ... 92 Figure 33. TPD profiles obtained from 8Ba/Ti/Al (P1), 8Ba/Ti/Al (P2), γ-Al2O3 and 8Ba/Al samples which were initially saturated with NO2 (g) at 323 K. a) 30 amu and 32 amu signals, b) 46 amu signal. ... 94 Figure 34. TPD profiles obtained from 20Ba/Ti/Al (P1), 20Ba/Ti/Al (P2) and
20Ba/Al samples which were initially saturated with NO2 (g) at 323 K. a) 30 amu and 32 amu signals, b) 46 amu signal. ... 96 Figure 35. FTIR spectra acquired at 323 K for 20Ba/Al after exposure to SO2 (g) + O2 (g) (SO2:O2 Pressure Ratio = 0.1 Torr : 1 Torr) a) after 1 h in the mixture at 323 K, b) after flashing to 473 K in SO2+O2 and cooling back to 323 K in the gas mixture, c) after flashing the sample to 673 K in the gas mixture and further evacuation at 323 K for 20 min (Preactor < 1×10⁻⁴ Torr), d) after flashing the sample to 673 K in vacuum (Preactor < 1×10⁻⁴ Torr) and cooling back to 323 K. ... 99
xix
Figure 36. FTIR spectra acquired at 323 K for 20Ba/Ti/Al (P1) after exposure to
SO2 + O2 (SO2:O2 Pressure Ratio = 0.1 Torr : 1 Torr) a) after 1 h in the mixture at 323 K, b) after flashing to 473 K in SO2 + O2 and cooling back to 323 K in the gas mixture, c) after flashing the sample to 673 K in the gas mixture and further evacuation at 323 K for 20 min (Preactor < 1×10⁻⁴ Torr), d) after flashing the sample to 673 K in vacuum (Preactor < 1×10⁻⁴ Torr) and cooling back to 323 K. ... 101
Figure 37. FTIR spectra corresponding to 8 Torr of NO2 adsorption at 323 K on fresh (black spectra) and poisoned (red spectra) a) 8Ba/Ti/Al (P1) b) 20Ba/Ti/Al (P1) c) 20Ba/Ti/Al (P1) surfaces. Sulfation was performed by exposing SO2 (g) + O2 (g) (SO2:O2 Pressure ratio = 0.1 Torr : 1 Torr) on the sample at 323 K, followed by the heating of the sample in the gaseous mixture at 473 K for 30 min and a final evacuation at 323 (Preactor < 1x10⁻³). (NO2 saturation of the surfaces were performed by dosing 8 Torr of NO2 at 323 K for 20 min, followed by evacuation at 323 K. (All spectra are acquired at 323 K in vacuum). ... 104 Figure 38. FTIR spectra acquired after dosing 8 Torr of NO2 at 323 K on sulfated a) 8 Ba/Al (black spectra), 8 Ba/Ti/Al (P1) (red spectra), 8 Ba/Ti/Al (P2) (blue spectra) b) 20 Ba/Al (black spectra), 20 Ba/Ti/Al (P1) (red spectra), 20 Ba/Ti/Al (P2) (blue spectra) followed by further heating at 1023 K in vacuum. Sulfation was performed by exposing SO2 (g) + O2 (g) (SO2:O2 Pressure ratio = 0.1 Torr : 1 Torr) on the sample at 323 K, followed by the heating of the sample in the gaseous mixture at 473 K for 30 min and a final evacuation at 323 (Preactor < 1x10⁻³). (NO2 saturation of the surfaces were performed by dosing 8 Torr of NO2 at 323 K for 20 min, followed by evacuation at 323 K. (All spectra are acquired at 323 K in vacuum). ... 105 Figure 39. TPD profiles obtained from poisoned and fresh 8Ba/Ti/Al (P1) samples
which are saturated with 8 Torr NO2 (g) at 323 K for 20 min. Black, blue and red curves correspond to 30 amu (NO), 32 amu (O2) and 46 amu (NO2) signals, respectively. (Before the NO2 adsorption, sample was poisoned via SO2 (g)+ O2 (g) exposure at 323 K, where SO2:O2 pressure ratio was 0.1 Torr : 1 Torr, followed by further heating in the gaseous mixture at 473 K for 30 min and a final evacuation at 323 K). ... 108 Figure 40. TPD profiles obtained from poisoned and fresh 20Ba/Ti/Al (P2) samples
which are saturated with 8 Torr NO2 (g) at 323 K for 20 min. Black, blue and red curves correspond to 30 amu (NO), 32 amu (O2) and 46 amu (NO2) signals,
xx
respectively. (Before the NO2 adsorption, sample was poisoned via SO2 (g)+ O2 (g) exposure at 323 K, where SO2:O2 pressure ratio was 0.1 Torr : 1 Torr, followed by further heating in the gaseous mixture at 473 K for 30 min and a final evacuation at 323 K). ... 110 Figure 41. SO2 and H2S desorption profiles for a) 8Ba/Al, b) 8Ba/Ti/Al (P1) c) 8Ba/Ti/Al (P2) d) 20Ba/Al, e) 20Ba/Ti/Al (P1), f) 20Ba/Ti/Al (P2) surfaces which are first poisoned with SO2 (g) + O2 (g) at 323 K (SO2:O2 pressure ratio= 0.1 Torr : 1 Torr) and then heated in this gas mixture at 473 K for 30 min followed by saturation with NO2 at 323 K. ... 112
1
1 INTRODUCTION
Air pollution caused primarily by the exhaust gases from automotive and stationary sources (power plants, chemical industry) remains an important global environmental problem, especially with the increasingly stringent emission limits worldwide. These emissions are mainly formed through the combustion of fossil fuels (coal, petroleum and natural gas) which mainly produces water vapour (H2O) and carbon dioxide (CO2), known to cause the greenhouse effect. Moreover, toxic chemicals such as carbon monoxide (CO), unburned and/or partially burned hydrocarbons (HCs) or particulate matter (PM), nitrogen oxides (NOx) and sulfur oxides (SOx) are the other typical pollutants produced [3]. Many regulations and studies are taken into consideration worldwide, in order to reduce the harmful gases and convert them into harmless gases.
Global oil reserves are constantly decreasing and as a result, the fossil fuel costs show an increasing trend in long term projections. Therefore, the automobile sector is trying to find solutions to minimize the fuel consumption. In 1984, the burn engine attracted attention for its remarkable fuel economy [4]. The typical lean-burn engines operate at an air-fuel (A/F) ratio of 25/1, whereas the conventional gasoline engines operate at A/F ratios of 14.5/1 [5, 6]. Table 1 compares the representative compositions of the exhaust gases for diesel (lean-burn) vs. gasoline engines [7].
2
Table 1. Typical concentrations of untreated exhaust gases for diesel and gasoline
engines [7].
In Europe by the end of 2014, NOx emissions from diesel engines are required to go through a three-fold decrease from 0.25 g.km-1 to 0.08 g.km-1 as mentioned in the EURO 6 AECC regulations named as the “Emission Control Technologies and the Euro 5/6 Emission Legislation” [8]. In order to achieve these high environmental standards restricting the NOx emissions [8] from diesel-equipped vehicles, reduction of NOx through efficient catalytic emission after-treatment systems and fuel efficient engine technologies are required.
Different types of catalysts were developed for these purposes. One important catalyst used is the three-way-catalysts (TWCs) for gasoline after treatment applications. The commercially available TWCs typically contain Pt-Rh and/or Pd/Rh noble metals dispersed on a washcoat made up of Al2O3, CeO2, ZrO2, CaO, MgO and La2O3 [9]. These catalysts enable the reduction of NOx to N2 and O2, the oxidation of CO to CO2 and the oxidation of the unburned HCs to CO2 and H2O simultaneously [4].In Figure 1, it is visible that TWCs perform very well at an A/F ratio of 14.5/1. However, the problem arises in reducing NOx in the presence of large amounts of oxygen (i.e. under oxidizing or “lean” conditions, A/F = 25/1). Thus in a lean environment TWCs become ineffective for NOx removal.
Exhaust
Components
Diesel Engine
(Vol %)
Gasoline Engine
(Vol %)
H
2O
2 – 10
10 – 12
CO
22 – 12
10 ‐ 13.5
CO
0.01 ‐ 0.1
0.1 ‐ 6
O
25 – 15
0.2 – 2
HC (% C)
0.005 ‐ 0.05
0.5 – 1
NO
x0.003 ‐ 0.06
0.1 – 6
SO
x10 – 100 ppm
15 – 60 ppm
PM
20 – 200 mg/m
31 – 10 mg/m
33
Figure 1. Fuel consumption and 3-way performance of a gasoline engine as a
function of air–fuel (A/F) ratio [5].
The other major catalytic technology proposed and used for the removal of NOx emissions from the lean-burn vehicles is the Selective Catalytic Reduction (SCR) technology. There are two main types of SCR catalysts; ammonia/urea selective catalytic reduction catalysts (NH3-SCR) and hydrocarbon selective catalytic reduction catalysts (HC-SCR) [6]. The first catalyst (NH3-SCR) used has some drawbacks regarding the use of toxic and corrosive NH3 as the reductant (NH3-SCR) and the reaction of NO2 and NH3 forming the exposive ammonium nitrate leading to the deactivation of the catalyst [10]. Secondly, the HC-SCR method which uses zeolite-based HC-SCR exhibits disadvantages due to very limited low-temperature activity(i.e. below 573 K) and the deactivation by of the catalyst by water and SO2.
NOx storage reduction (NSR) also known as the Lean NOx Trap (LNT) technology is one of the promising alternatives for the catalytic NOx removal from lean - burn gasoline engines [5, 11, 12]. The first NSR catalyst was developed and put into the market by Toyota in 1994 [13, 14]. The typical catalysts most commonly used for NSR applications involve combinations of precious noble metals (Pt, Pd, Rh) for oxidation and reduction purposes and K2O and/or barium oxide (BaO) as the primary NOx storage component, supported on a high surface area (~200 m2/g) support material, such as γ-Al2O3. The NSR catalytic concept [15-18] is built on an alternating lean/rich engine operation. During the long “lean” period (~60 s) that is abundant in oxygen the NOx is trapped on the NOx storage component. This is
4
followed by a short “rich” period (~8 s) where NOx is released and successively reduced to N2 on the noble active sites, in a gas phase environment that is enriched in unburned hydrocarbons, H2 and CO (reductant atmosphere) [19].
The possible mechanism of the NSR system as mentioned above begins with the lean atmosphere where NOx (> 90% of which is found as NO in diesel engines) is first oxidized to NO2 over the precious metal sites and then stored as nitrites or nitrates on the trapping agent. During the following reduction stage, the stored NOx is further reduced to nitrogen (N2), while Ba(NO3)2 storage units are converted into BaO domains. The trapping ability of the NSR catalyst is thus restored after a lean cycle followed by a rich cycle [15].
Although a number of improvements on the NSR catalysts have been suggested [20-25], problems still remain which are mainly associated with the deactivation of the catalysts. Thermal deterioration is one of these problems which is due to reaction of the NOx storage material with the support material as well as due
to the morphology changes of the precious metals and the NOx storage material [26].
However, the probably most challenging problem to be solved for the NSR catalyst is the deactivation caused by sulfur. Sulfur compounds present in diesel fuel are predominantly found as substituted benzothiophenes. The quantity of sulfur compounds present in petroleum distillate usually increases with boiling range and therefore conventional diesel fuel invariably contains more sulfur than gasoline. The sulfur compounds originally in the engine lubricating oil also produce sulfur dioxide (SO2) during the combustion process. This can be converted into sulfates on the catalyst through the mechanism as shown in the following equations [27]:
SO2 + ½ O2 → SO3 (1)
BaO + SO3 → BaSO4 (2)
Due to the higher thermodynamic stability of sulfate species compared to the corresponding nitrates, ‘‘sulfates’’ are not decomposed under the same regenerating conditions as nitrates. Thus, sulfur effectively blocks the catalytic sites for NOx storage and gradually reduces the overall NOx storage capacity of the NSR catalysts [27]. In addition, SO2 also effectively poisons the support material. SO2 and/or SO3
2-5
are initially oxidized to SO42- over the precious metal sites and then SO42- further reacts with the γ-Al2O3 support material forming aluminum sulfate (Al2(SO4)3) which hinders the nitrate spill-over, limits the nitrate diffusion on the support surface and plugs the micro-pores of the γ-Al2O3 matrix [28].
Despite the constant reduction in the sulfur content of the refined fuel in the past decades, sulfur poisoning remains one of the major causes for catalytic deactivation of the NSR systems [28-32]. Sulfur poisoning typically leads to the formation of alkaline earth metal and precious metal sulfate or sulfide complexes that are thermodynamically more stable than nitrates as discussed above. For, a large number of oxide substrates the stability of the surface species increases in the following order: NO2- ~ CO32- < NO3- < SO42- [29, 33-36].
Efforts towards improving the catalytic tolerance against sulfur poisoning and designing highly active and stable novel NSR catalysts are vital for the globalization of the NSR technology [28, 30, 32]. Misono [37], Fritz [38] and several others [1, 35, 36, 39-42] reported detailed studies on the improvement and the durability enhancement of NSR catalysts. NSR catalysts have been commercialized for lean-burn gasoline and diesel applications in Europe, Japan and North America. However, the formulated catalysts originally are successfully used in limited markets such as Japan where the sulfur content of the diesel fuel is relatively low (below 10 ppm) [43] when compared to countries in the U.S. (500 ppm) and Europe (50 pppm) [43].
An attempt to enhance the sulfur resistance of NSR catalysts was made by Yamazaki et al. [44] and Fanson et al. [45] by incorporating Fe into Ba-based LNT catalysts. According to Yamazaki et al. Fe was found to decrease sulfur uptake and promote the decomposition of BaSO4. On the other hand, Fanson et al. observed that Fe supported the formation of a bulk nitrate species which was resistant to poisoning. Other researchers have suggested the addition of Mg into the NSR catalyst and studied the sulfur deactivation [46]. Furthermore, there are several examples of mixed binary oxides regarding the addition of TiO2 [47], BaSnO3 [48] or Li2O on support oxides such as Al2O3 [49].The use of Cu containing catalysts has also been studied by promoting and/or replacing Pt in the NSR catalysts [50, 51]. The sulfur tolerance of this type of catalyst was suggested to arise from the inability of Cu to oxidize SO2.
6
Another approach focuses on the use of novel and improved support materials with enhanced sulfur tolerance. Matsumoto and co-workers [28, 52] tried to find an optimum chemical composition of the NOx storage compounds in order to minimize the growth of the sulfate domains, and adjust the surface acidity of the support to inhibit the SOx storage. The macroscopic geometrical structure of the catalytic monolith was also found to be effective in limiting the size of the sulfate particles and controlling the sulfate decomposition/desorption temperature [5, 14]. It was shown that the smaller the sulfate particle size, the easier the decomposition of the sulfates from the surface. This approach became the basis for attacking the deactivation problem in NSR system [44].
Furthermore, the effect of doping of the alumina support with different alkaline metals or alkali-earth metals was also studied in which promising results were reported for lithium doped samples [53]. Theoritical calculations [54] showed that strontium sulfate decomposes at much lower temperatures than barium sulfate when both H2 and CO are used in the regeneration of the sulfated storage sites (presuming the formation of H2S, CO2 and H2O). Recently, Corbos and co-workers [36, 55] studied the effect and the desulfation of model Pt/BaO/support NSR catalysts. In these studies, BaO supported on Al–Si and Ce–Zr mixed oxides was found to exhibit higher NOx storage capacity after exposure to sulfating conditions in comparison with BaO supported on alumina. Moreover, the use of ceria-zirconia as a support was found to result in the destabilization of the bulk BaSO4 upon H2(g) exposure.
TiO2 is commonly utilized as a support material in numerous catalytic processes or as an active catalyst in photocatalytic systems. TiO2 exists in three major crystallographic forms; rutile, anatase and brookite. The anatase type is usually used for photocatalytic applications [56]. The preparation of TiO2 with the sol-gel method has advantages in terms of purity, homogeneity and stoichometric control [56].The particle size of TiO2 depends on grain size, impurities, composition and the calcination temperature. Moreover, acting as a support material for the NSR catalysts, TiO2 was also found to have a noticeable ability to suppress the sulfur deposition [57]. This was related with the surface acidity of TiO2, inhibiting the adsorption of acidic sulfur species and making the sulfates less stable on the TiO2 compared to other oxide supports. It was also shown that the decomposition
7
temperature of the sulfates on a TiO2 support was lower than that of γ-Al2O3. However, in order to circumvent some of the unfavourable properties of TiO2 such as the limited thermal stability, low surface area, and poor mechanical properties, its combination with secondary oxides can be considered to design novel support materials with enhanced properties. Along these lines, γ-Al2O3 [58-60] and/or ZrO2 [4, 61, 62] are among the promising choices for the secondary oxides that can be used in combination with TiO2. It was reported that blending TiO2 with γ-Al2O3 as a support material minimized the amount of SOx deposit on a Pt/Ba/γ-Al2O3 catalyst and enhanced the NOx storage of the sulfur-exposed catalysts. The blend of the non
sulfur-poisoned Pt/TiO2 catalyst with the sulfur-poisoned Ba/Pt/Al2O3 catalyst improved the sulfur desorption from the Ba/Pt/Al2O3 catalyst under rich conditions [28]. It was also suggested that the interface between Al2O3 and TiO2 plays an important role in sulfate decomposition and the desorption processes [57]. Despite the established sulfur resisting effect of TiO2 as an additive in the composition of the Pt/Ba/γ-Al2O3 NSR catalysts, most of the fundamental aspects regarding the influence of TiO2 on the interaction between the NOx storage component and the
support material have not yet been elucidated in detail. In this study, the effect of TiO2 on the surface distribution and the thermal stability of the catalytic species formed on the NOx storage systems will be investigated via two different synthetic
protocols.
In several former studies [28, 32, 57-60, 63-65] it was pointed out that titania addition to the conventional alumina support reduces the stability of the sulfates and the use of titania-containing mixed oxides as support materials provides a potential avenue for sulfur tolerance improvement. Furthermore, active sites on the TiO2 surface can also be relatively readily regenerated under reaction conditions [58]. In the current study [1, 66], we have focused our attention on the structural and morphological changes occurring on the ternary oxide NOx storage systems in the form of BaO/TiO2/Al2O3 [1]. Our findings suggested that on the BaO/TiO2/Al2O3 system, Ti-domains provide strong anchoring sites for the Ba-containing units and significantly alter the surface morphology, composition and the stoichiometry of the Ba-containing units as well as the surface mobility of the BaO clusters. As a continuation of these experiments [1], we have attempted to find an optimum chemistry for the ternary BaO/TiO2/Al2O3 mixed oxide system. Along these lines,
8
the binary oxide TiO2/Al2O3 support material was prepared by using various Ti and Al precursors via two different sol-gel precipitation techniques.
Thus, the composition-dependent and the temperature-dependent structural changes of different TiO2/Al2O3 support materials and the corresponding ternary oxide NOx storage systems (BaO/TiO2/A2O3) are evaluated in detail by means of X-ray diffraction (XRD), Raman spectroscopy, Brunauer-Emmet-Teller (BET) surface area measurements, scanning electron microscopy (SEM), energy dispersive X-ray mapping (EDX-mapping) and transmission electron microscopy (TEM). Furthermore, the aim of the current work is to analyze the performance/functionality of these storage materials with NOx interaction experiments and investigate the deactivation of these samples by SO2 (g)+ O2 (g)through Fourier transform infrared (FTIR) spectroscopy and temperature programmed desorption (TPD) experiments.
9
2 EXPERIMENTAL
2.1 Sample Preparation
2.1.1 Synthesis of TiO
2/Al
2O
3Support Materials
Binary oxide TiO2/Al2O3 support materials were prepared via two different synthetic protocols (P1 and P2). The mole fraction of TiO2 was kept constant at ~0.3 for both support materials.
In P1, the mixed oxide support was synthesized through a sol-gel method [1, 67]. TiCl4 (Fluka, titanium (IV) chloride solution ~0.1 M in 20% hydrochloric acid) and γ-Al2O3 (PURALOX, 200 m2/g, SASOL GmbH, Germany) were used as starting precursors. At first, 6.56 ml of titanium(IV) chloride solution was added drop wise with a syringe to 60 ml deionized water under continuous stirring, where the solution temperature was kept below 333 K inside an ice bath (avoiding the precipitation of hydroxides generated from the heat of the violently exothermic hydrolysis reaction). 13.62 g of γ-Al2O3 in powder form was slowly added to the diluted solution at room temperature. Finally, gelation started after adding 30 % v/v NH3 (aq) to the mixture and adjusting the pH of the solution to 9. After aging the white gel under ambient conditions for 24 hours, the resultant blend was filtered and washed thoroughly with distilled water until the formed product was free of chloride ions, confirmed by the AgNO3 test. The final product (Ti/Al (P1)) was dried in air at 423 K for 2 h.
The second series (P2) of the mixed TiO2/Al2O3 oxide support material was synthesized through a sol-gel route that has been devised by our own research group [2]. The binary oxide support material was prepared by the co-hydrolysis of titanium and aluminium alkoxides. Initially, 24.63 g of aluminum sec-butoxide (97%, Sigma Aldrich) was mixed with 115 ml propan-2-ol (99.5 +%, Sigma Aldrich) and 3.1 ml acetylacetone (99.3 %, Fluka) for 30 min. Sequentially, 7.65 g titanium(IV) isopropoxide (97 %, Sigma Aldrich) was added dropwise to the mixture that proceeded for another half an hour. All of the synthesis steps were carried out at room temperature under vigorous stirring. The co-precipitation of the corresponding hydroxides was accomplished after the gradual addition of 5 ml of 0.5 M HNO3 to the solution which consecutively led to the formation of gel. The resulting white
10
precipitate was aged under ambient conditions for 10 days. The final mixed support oxide (Ti/Al (P2)) was attained after drying the gel in air at 873 K for 2 h.
For further analysis of the obtained TiO2/Al2O3 support materials (through P1 and P2), various thermal treatment processes ranging from 423 K to 1273 K (2 h in air for each temperature) were performed.
2.1.2. Synthesis of BaO/TiO
2/Al
2O
3: NO
xStorage Materials
A set of NOx storage materials in the form of BaO/TiO2/Al2O3 were synthesized by conventional incipient wetness impregnation of the TiO2/Al2O3 binary oxide support materials (prepared via P1 and P2). In order to obtain 8 wt% and 20 wt% BaO loadings, TiAl (P1) (dried in air at 473K) and (P2) (dried in air at 673K) were impregnated with aqueous solutions of barium nitrate (ACS Reagent, ≥ 99 %, Riedel-de Häen, Germany). The synthesized materials (Ba(NO3)2/TiO2/Al2O3) were then dried at 353 K. Finally, for the thermal analysis, the samples were calcined under Ar (g) atmosphere for 2 h at various temperatures, ranging from 423 K to 1273 K. Consequently, representative samples from the treated batches were collected for ex-situ characterization after each temperature treatment. Moreover, for FTIR and TPD studies, the synthesized NOx storage materials were further annealed at 873 K for another 2 h under Ar (g) before being inserted into the catalytic reactor for additional adsorption/desorption experiments.
Other than the synthesized materials, pure γ-Al2O3, pure TiO2 (Anatase Nano-Powder, 99.9 %, 40 nm, Inframat Advanced Materials) and (8/20 wt %) BaO/ã-Al2O3 samples [1, 66] were used as reference materials.
In the current text, synthesized NOx storage materials are denoted as XBa/Ti/Al (P1, P2). Compositions of these materials are also listed below in Table 2.
11
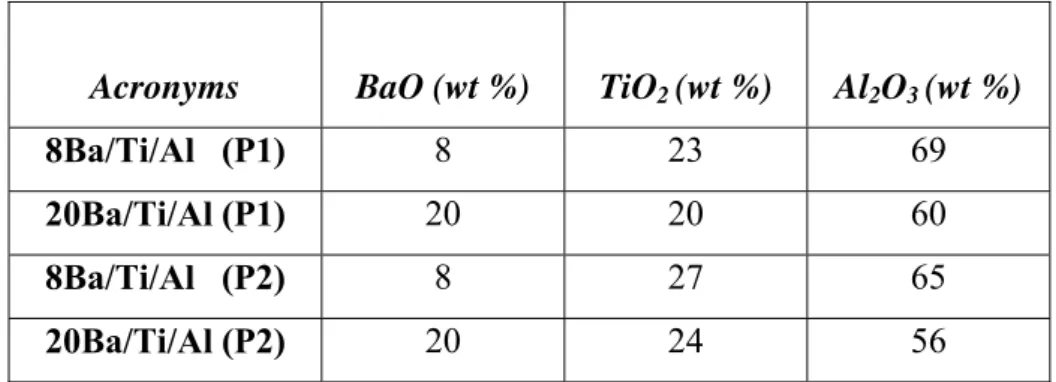
Table 2. Compositions of the synthesized ternary oxide NOx storage materials.
Acronyms BaO (wt %) TiO2 (wt %) Al2O3 (wt %)
8Ba/Ti/Al (P1) 8 23 69
20Ba/Ti/Al (P1) 20 20 60
8Ba/Ti/Al (P2) 8 27 65
12
2.2 Experimental Techniques
2.2.1 BET
BET specific surface area measurements were conducted using a Micromeritics Tristar 3000 surface area and porosity analyzer. The samples were measured via low-temperature isothermal adsorption-desorption of N2. Before the surface area measurements, the samples were outgassed at 623 K for 2 h in vacuum.
2.2.2 XRD
The powder XRD patterns were recorded using a Rigaku diffractometer, equipped with a Miniflex goniometer and an X-ray source with CuKα radiation, at λ = 1.54 Å, 30 kV and 15 mA. The powder samples were pressed and affixed to standard-sized glass slides and scanned in the 10–80o, 2θ range with a scan rate of 0.01o s−1. Diffraction patterns were assigned using Joint Committee on Powder Diffraction Standards (JCPDS) cards supplied by the International Centre for Diffraction Database (ICDD).
2.2.3 Raman Spectroscopy
The Raman spectra were recorded on a HORIBA Jobin Yvon LabRam HR 800 instrument, equipped with a confocal Raman BX41 microscope, spectrograph with an 800 mm focal length and a CCD detector. The Raman spectrometer was equipped with a Nd: YAG laser (λ = 532.1 nm). While the Raman experiments were conducted, the laser power was tuned to 20 mW, measured at the sample position, in order to minimize the sample heating effects. All the powder samples were mechanically dispersed onto a single-crystal Si holder. The incident light source was dispersed by holographic grating with a 600 grooves/mm and focused onto the sample by using a 50X objective. The confocal hole and slit entrance were set at 1100 and 200 μm, respectively. The spectrometer was regularly calibrated by adjusting the zero-order position of the grating and comparing the measured Si Raman band frequency with the typical reference value of 520.7 cm-1. All Raman spectra were acquired within 100-4000 cm-1 with an acquisition time of 213 s and a spectral resolution of 4 cm-1. Pure TiO2 (Anatase - Nano powder, 99.9%, 40nm,
13
Inframat Advanced Materials), rutile (obtained after calcination of the anatase nanopowder at 1273 K for 2 h) Ba(NO3)2 (ACS Reagent, ≥ 99% purity, Riedel-de Häen, Germany) were used as reference powders.
2.2.4 SEM/EDX
SEM and EDX data were performed using a Zeiss EVO40 environmental SEM that is equipped with a LaB6 electron gun, a vacuum SE detector, an elevated pressure SE detector, a backscattering electron detector (BSD) and a Bruker AXS XFlash 4010 detector. Samples for SEM and EDX analysis were prepared by grinding the samples into fine powder and mechanically dispersing them on an electrically conductive carbon film which was placed on an aluminium sample holder. No additional coatings or dispersive liquids were used for the sample preparation. SEM images were obtained using a vacuum SE detector where electron acceleration voltage of the incident beam was varied within 10-20 kV and the samples were kept typically at ≤ 5 ×10⁻⁵ Torr inside the SEM. All of the EDX data were collected using an electron acceleration voltage of 20 kV and a working distance of 15 mm. For the EDX elemental mapping studies, at least four independent areas of identical dimensions on the same catalyst sample were investigated in order to assure the reproducibility of the results.
2.2.5 TEM
Transmission electron microscopic (TEM) images were obtained with a resolution of 0.14 nm on a JEM-2010 (200 keV) microscope equipped with an Energy Dispersive X-ray (EDX) spectrometer with a Si (Li) detector. The analyzed area was about 10 nm. The energy resolution of EDX was 127 eV. The sample for the TEM study was prepared by ultrasonic dispersing in ethanol and subsequent deposition of the suspension upon a “holey” carbon film supported on a copper grid.
2.2.6 FTIR
FTIR spectroscopic measurements were carried out in transmission mode in a batch-type catalytic reactor coupled to an FTIR spectrometer (Bruker Tensor 27) and a quadruple mass spectrometer (QMS) (Stanford Research Systems, RGA 200) for
14
TPD and residual gas analysis (RGA). FTIR spectra were recorded using a Hg-Cd-Te (MCT) detector, where each spectrum was acquired by averaging 128 scans with a spectral resolution of 4 cm-1. The samples were mounted into the IR cell 28 consisting of a five-way stainless steel chamber equipped with optically-polished BaF2 windows. This IR cell was connected to a gas manifold (including a dual-stage rotary vane pump and two turbomolecular pumps) so that the pressure in the cell could be varied within 1000 Torr - 10-6 Torr. About 20 mg of finely ground powder sample was pressed onto a high-transmittance, lithographically-etched fine tungsten grid which was mounted on a copper sample holder assembly, attached to a ceramic vacuum feedthrough. A K-type thermocouple was spot-welded to the surface of a thin tantalum plate attached on the W-grid to monitor the sample temperature. The sample temperature was controlled within 298 K – 1100 K via a computer-controlled DC resistive heating system using the voltage feedback from the thermocouple. After having mounted the sample in the IR cell, sample was gradually heated to 373 K in vacuum and kept at that temperature for at least 12 h before the experiments in order to ensure the removal of water from the surface. In an attempt to minimize the effect of background water (i.e. re-adsorption of water on the sample from the reactor walls and the gas manifold), the system was frequently baked. Prior to each NOx adsorption experiment, the walls of the vacuum system were passivated by flushing 2 Torr of NO2 (g) for an extended period of time (20 min) followed by evacuation at the same temperature. Next, in order to obtain a surface that is free of adsorbed NOx and other adsorbates, the sample was annealed in vacuum by increasing the temperature to 1023 K in a linear fashion at a constant rate of 12 K min-1. After this annealing protocol, sample was cooled down to 323 K. Before acquisition of each spectral series, a background spectrum of the clean, adsorbate-free sample was obtained in vacuum at 323 K (with a residual reactor pressure ~1 x 10⁻⁵ Torr).
NO2 (g) (prepared by reacting NO (g), Air Products, Purity > 99.9% and O2 (g) Ersoy Gas, Purity > 99.9%) used in the adsorption experiments was further purified via several freeze-thaw-pump cycles before the experiments.
2.2.6.1 Surface Acidity via pyridine adsorption
The surface acidity of the studied oxide systems was investigated by in-situ FTIR spectroscopy measurements of chemisorbed pyridine. Pyridine (Merck KGaA,
15
purity > 99.0%) was used as a basic probe molecule in this procedure and further purified via several freeze-thaw-pump cycles before adsorption.
Prior to each pyridine adsorption experiment, the sample surface was activated (dehydrated) in the IR cell by ramping the sample temperature to 623 K and subsequently outgassing the sample at the same temperature for 1 h under vacuum (residual pressure < 10-4 Torr). After this pretreatment protocol, the sample was cooled down to 323 K and a background spectrum of the clean, adsorbate-free sample was obtained (with a residual reactor pressure < 1 × 10⁻⁵ Torr). Then, the sample was exposed to a precisely controlled dose of pyridine vapour (Ppyridine = 3.0 Torr) for 15 min at 323 K. After the saturation of the sample surface (15 min), the system was evacuated at room temperature (Preactor < 1 × 10⁻⁴ Torr). After the acquisition of the pyridine-saturated sample spectrum at 323 K, the sample was heated in vacuum to various temperatures within 323-723 K and then cooled back to 323 K for the sample spectra acquisition.
2.2.6.2 Stepwise NO2 (g)adsorption experiments
In the first type of FTIR experiments, controlled doses of 0.6 Torr of NO2 (g) (measured by a 0.1-1000 Torr MKS Baratron absolute pressure transducer) were introduced in a stepwise fashion onto the NOx – free sample surface at 323 K. After having the acquired sample spectrum of each dose at 323 K, the system was evacuated to ~ 1 x 10⁻³ Torr before the next dosage. Typically, the low-temperature adsorption series was completed with saturating the surface sites with a final insertion of 8 Torr of NO2 at 323 K for 20 min.
2.2.6.3 Temperature-dependent FTIR experiments
In a typical temperature-dependent adsorption experiment, the sample held at 323 K was exposed to 8 Torr of NO2 for 20 min, which typically led to the saturation of the surface with NOx species. Next, the system was evacuated (<1 x 10⁻⁴ Torr) and then the sample temperature was linearly ramped to a given temperature. Once the target temperature was achieved, annealing was stopped and the sample was cooled to 323 K where the sample spectrum was acquired. The same procedure was repeated
16
for different temperature intervals within 323 – 923 K in order to monitor the thermal behavior of the surface species via FTIR.
2.2.6.4 SO2 (g) + O2 (g) adsorption experiments
Prior to each SO2 + O2 adsorption experiment, the sample surface was activated (dehydrated) in the IR cell by ramping the sample temperature to 1023 K and subsequently outgassing the sample at 323 K for 20 min under vacuum (residual pressure < 10-4 Torr). After this pretreatment protocol, a background spectrum of the clean, adsorbate-free sample was obtained (with a residual reactor pressure < 1 × 10⁻⁵ Torr).
The sulfur exposure experiments were performed through four different spectral acquisition steps. In the first spectral acquisition step, the sample was exposed to ~0.6 Torr of SO2 + O2 (SO2:O2, 0.1:1) for 1 h at 323 K and the first FTIR spectrum was obtained under this condition. In the second step, the sample used in the first step was flashed to 473 K in SO2 + O2. After cooling the sample to 323 K, the second FTIR spectrum was acquired. In the third step, the sample used in the second step was further flashed to 673 K (in the presence of SO2 + O2) and the reactor was further evacuated at 323 K for 20 min (Preactor < 1×10⁻⁴ Torr) and the third FTIR spectral acquisition was carried out. In the fourth (i.e. the final) step, the sample used in the third step was flashed to 673 K in vacuum (Preactor < 1×10⁻⁴ Torr) and then the spectral acquisition was performed at 323 K in vacuum.
2.2.6.5 NO2 (g) adsorption on prepoisoned materials
The samples were firstly activated as explained in section 2.2.6.4. Poisoning of the materials were achieved by introducing ~0.6 Torr SO2 + O2 (SO2:O2, 0.1:1) on the dehydrated sample at 323 K and further heating the sample in the gaseous mixture to 473 K for 30 min. Then, the system was evacuated at 323 K (Preactor < 1x10⁻³), prior to NO2 adsorption. Next the poisoned sample was exposed to 8 Torr of NO2 at 323 K for 20 min in order to saturate the surface with NOx. Finally, the reactor was evacuated (Preactor < 1x10⁻³) at 323 K and FTIR spectrum of the sample was obtained.
17
In addition to these experiments, after performing the NOx saturation on a poisoned sample as described above, the sample was flashed to 1023 K in vacuum, followed by cooling the sample to 323 K in vacuum and the FTIR data acquisition at 323 K in vacuum. This latter protocol allowed us to monitor the highly stable surface species that exist on a sample which is initially poisoned, then saturated with NOx and then finally regenerated via a high temperature pumping/evacuation protocol.
2.2.7 TPD
2.2.7.1 Thermal stability of NOx species on the Fresh Materials
TPD experiments were acquired by using a QMS, which was directly connected to the vacuum chamber through a pneumatic gate valve. The sample powder (mass = c.a. 20 mg) was pressed onto a tungsten grid which was mounted in the IR/TPD cell. Prior to each TPD data, oxidation-resistant thoria coated iridium filament of the mass spectrometer was outgassed for 30 min. After cooling to 323 K, the sample was exposed to 8 Torr of NO2 for 20 min until the equilibrium was reached. Next, the system was outgassed to ~1 x 10⁻⁶ Torr in order to remove the weakly physisorbed molecules. Subsequently, TPD experiments were carried out. Evolved NOx species during the desorption process were monitored by recording the QMS signals with mass to charge ratios (m/z) equal to 18 (H2O), 28 (N2/CO), 30 (NO), 32 (O2), 44 (N2O/CO2) and 46 (NO2) in pressure vs. time mode. A linear temperature ramp within 323 – 1023 K was used during the TPD experiments where the ramp rate was 12 K/min. In order to ensure the reproducibility of the results, TPD experiments were performed multiple times for each sample.
2.2.7.2 Thermal stability of SOx/NOx species on the Sulfated Materials
Sulfation of the materials were obtained by exposing ~0.6 Torr SO2+O2 (SO2:O2, 0.1:1) on the sample at 323 K, further heating in gaseous mixture to 473 K for half an hour and lastly evacuating at 323 K (Preactor < 1x10⁻³). The next step regarding the saturation of the surface with NO2 was exactly the same as explained in section 2.2.7.1. In addition to the evolved NOx species, SOx species during the desorption process were also monitored by recording the QMS signals with mass to
18
charge ratios (m/z) equal to 18 (H2O), 28 (N2/CO), 30 (NO), 34 (H2S), 32 (O2), 44 (N2O/CO2), 46 (NO2) and 64 (SO2) in pressure vs. time mode. A linear temperature
ramp within 323 – 1023 K was used during the TPD experiments where the ramp rate was 12 K/min. In order to ensure the reproducibility of the results, TPD experiments were performed multiple times for each sample.
19
3 RESULTS
AND
DISCUSSION
3.1 TiO
2/Al
2O
3Binary Oxide Support Materials
3.1.1 Structural Characterization of the Thermally Treated Ti/Al
Support Materials
3.1.1.1 Specific Surface Area Measurements
Thermal changes and stability of the synthesized Ti/Al systems (P1 and P2) along with the ternary Ba/Ti/Al mixed oxides were analysed as a function temperature in the interval of 423 – 1273 K.
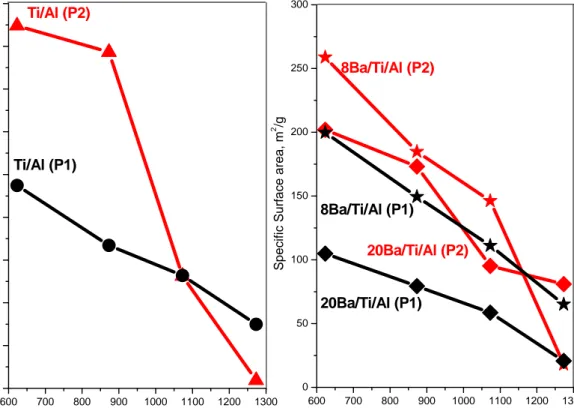
Table 3 illustrates the temperature dependence of the SBET (m2/g) of the samples within 623-1273 K. The same data is also graphically illustrated in Figure 2. Figure 2 and Table 3 clearly indicate that the specific surface areas corresponding to all of the samples are strongly affected by the thermal treatments and as an outcome, the SBET values tend to decrease in a monotonic fashion with increasing temperature. Typically such behaviour is rather common for thermal processes leading to sintering and/or phase transformations. From the results above, it is evident that the Ti/Al samples synthesized by P2, have considerably higher specific surface area values within 623 – 873 K when compared to the Ti/Al (P1) material. However at elevated temperatures (T > 1073 K), the porous structure of the Ti/Al (P2) system exhibits a relatively unstable character and therefore a profound loss in its structural integrity is observed. On the other hand, although Ti/Al (P1) samples have moderately lower surface area values within 623 - 1073 K, these materials tend to preserve their porous structure more efficiently even after the thermal treatment at 1273 K.
20
Figure 2. Specific surface area data for the samples after thermal treatments at
various temperatures
Table 3. BET Specific surface area measurements of the samples calcined within
623-1273K
a Surface area values : m2/g
b Samples were calcined under air at the given temperatures for 2 hr
c Samples were annealed under Ar (g) flow for 2 hr
Sample a
T/ K (P1) Ti/Al b (P2)Ti/Al b 8Ba/Ti/Al (P1) c 8Ba/Ti/Al (P2) c 20 Ba/Ti/Al (P1) c 20 Ba/Ti/Al (P1) c
623 237 424 200 259 105 202 873 167 393 150 185 79 173 1073 132 131 111 146 59 95 1273 75 9 65 18 21 81 (P2 600 700 800 900 1000 1100 1200 1300 0 50 100 150 200 250 300 350 400 450 Ti/Al (P1) Sp eci fic Su rfa c e ar ea , m 2 /g Temperature, K Ti/Al (P2) 600 700 800 900 1000 1100 1200 1300 0 50 100 150 200 250 300 8Ba/Ti/Al (P1) S p e c if ic S u rf ac e ar e a , m 2 /g Temperature, K 20Ba/Ti/Al (P1) 20Ba/Ti/Al (P2) 8Ba/Ti/Al (P2)
21
The BET data for the NOx storage materials 8(20)Ba/Ti/Al (P1/P2) show relatively lower surface area when compared to the corresponding Ti/Al (P1, P2) support materials. Increasing the loading of the NOx storage material (8 to 20 wt% BaO) for both protocols leads to smaller surface area values at elevated temperatures. However a reversal of the observed trend is clearly visible for the 8(20)Ba/Ti/Al (P2) samples at 1273 K, where higher Ba loadings lead to significantly higher surface area values as compared to the Ti/Al (P2) support material. A more elaborate discussion regarding these temperature-dependent structural changes will be provided in the later sections given below.
3.1.1.2 XRD Experiments
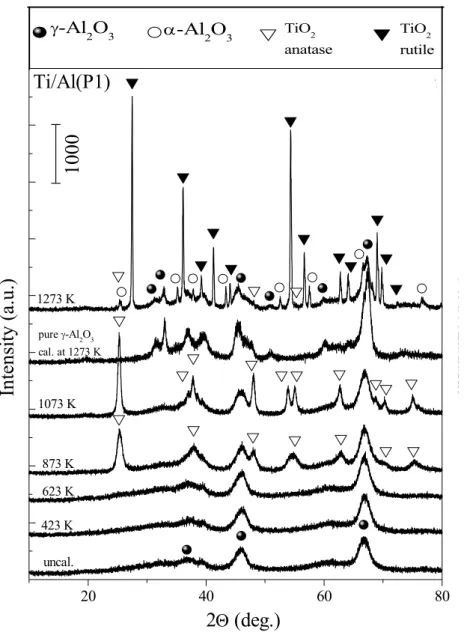
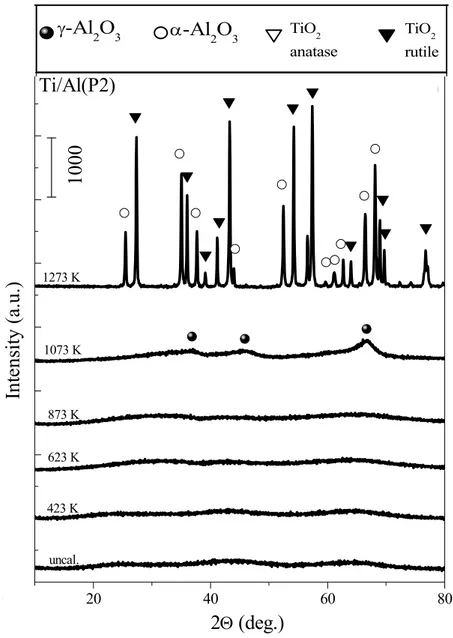
Figure 3 and Figure 4 represents the XRD data that reveal the thermal behavior of the binary Ti/Al (P1, P2) oxide systems within 300-1273 K. The results given in Figure 3 and 4 can be analyzed in detail in order to monitor the thermally induced structural changes of the support materials.
22
Figure 3. XRD patterns of the Ti/Al (P1) samples before and after calcination in the
temperature range of 423-1273 K, pure γ-Al2O3 calcined at 1273 K is also shown in the figure 20 40 60 80 TiO2 rutile α-Al2O3 γ-Al2O3 TiO2 anatase 1273 K pure γ-Al2O3 cal. at 1273 K 1073 K 873 K 623 K 423 K
In
te
ns
ity
(a
.u
.)
2
Θ(deg.)
uncal.Ti/Al(P1)
1000
(a)
In
ten
sity
(a
u
)
23
Figure 4. XRD patterns of the Ti/Al (P2) samples before and after calcination in the
temperature range of 423-1273 K 0 20 40 60 80
![Table 1. Typical concentrations of untreated exhaust gases for diesel and gasoline engines [7]](https://thumb-eu.123doks.com/thumbv2/9libnet/5751532.116088/22.892.182.736.225.546/table-typical-concentrations-untreated-exhaust-diesel-gasoline-engines.webp)
![Figure 1. Fuel consumption and 3-way performance of a gasoline engine as a function of air–fuel (A/F) ratio [5]](https://thumb-eu.123doks.com/thumbv2/9libnet/5751532.116088/23.892.183.784.160.409/figure-fuel-consumption-performance-gasoline-engine-function-ratio.webp)